. 2024 Oct 15;30(20):4618-4634.
doi: 10.1158/1078-0432.CCR-24-1563.

Remote Neuroinflammation in Newly Diagnosed Glioblastoma Correlates with Unfavorable Clinical Outcome

Affiliations

Remote Neuroinflammation in Newly Diagnosed Glioblastoma Correlates with Unfavorable Clinical Outcome

Laura M Bartos et al. Clin Cancer Res. .

Abstract

Purpose: Current therapy strategies still provide only limited success in the treatment of glioblastoma, the most frequent primary brain tumor in adults. In addition to the characterization of the tumor microenvironment, global changes in the brain of patients with glioblastoma have been described. However, the impact and molecular signature of neuroinflammation distant of the primary tumor site have not yet been thoroughly elucidated.

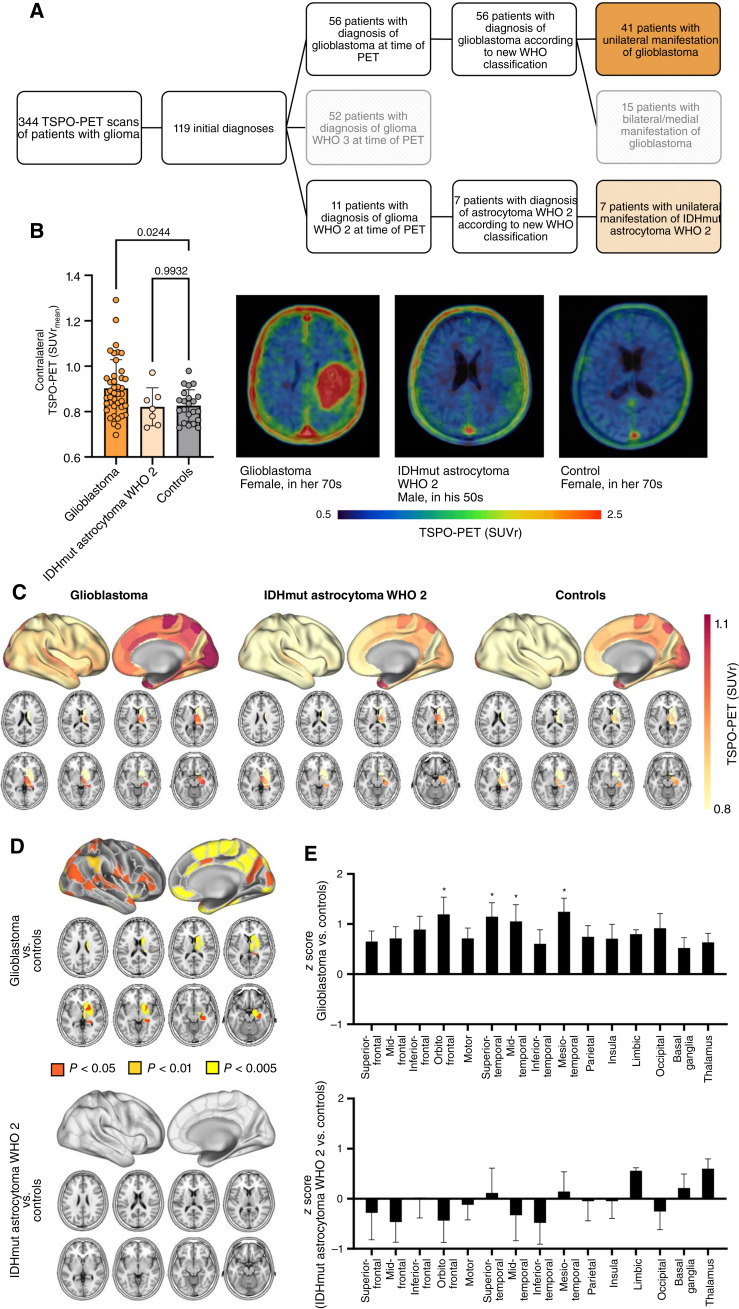
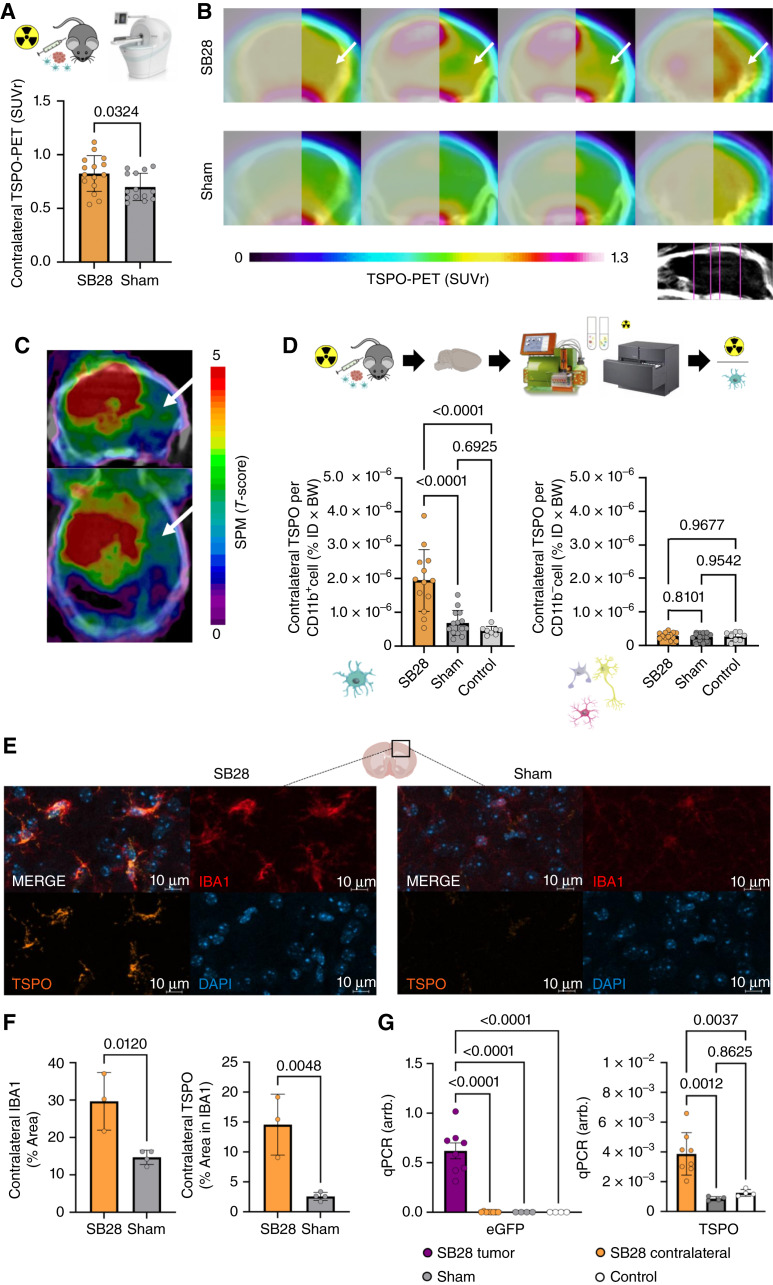
Experimental design: We performed translocator protein (TSPO)-PET in patients with newly diagnosed glioblastoma (n = 41), astrocytoma WHO grade 2 (n = 7), and healthy controls (n = 20) and compared TSPO-PET signals of the non-lesion (i.e., contralateral) hemisphere. Back-translation into syngeneic SB28 glioblastoma mice was used to characterize Pet alterations on a cellular level. Ultimately, multiplex gene expression analyses served to profile immune cells in remote brain.

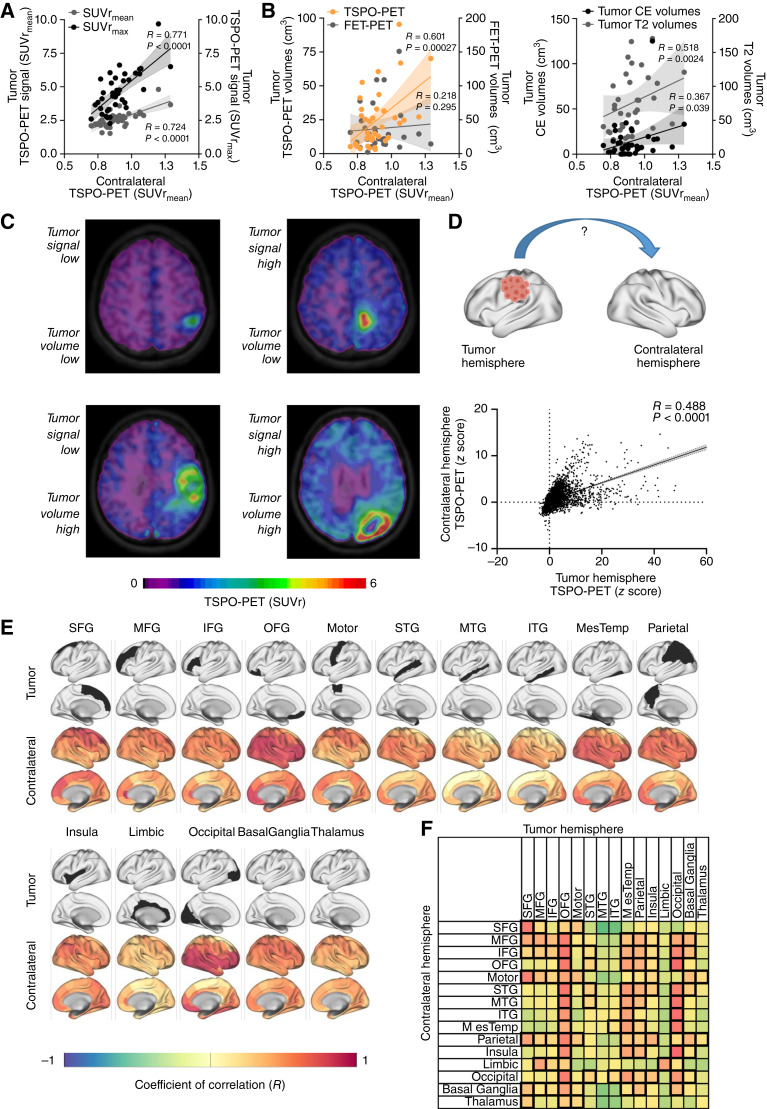
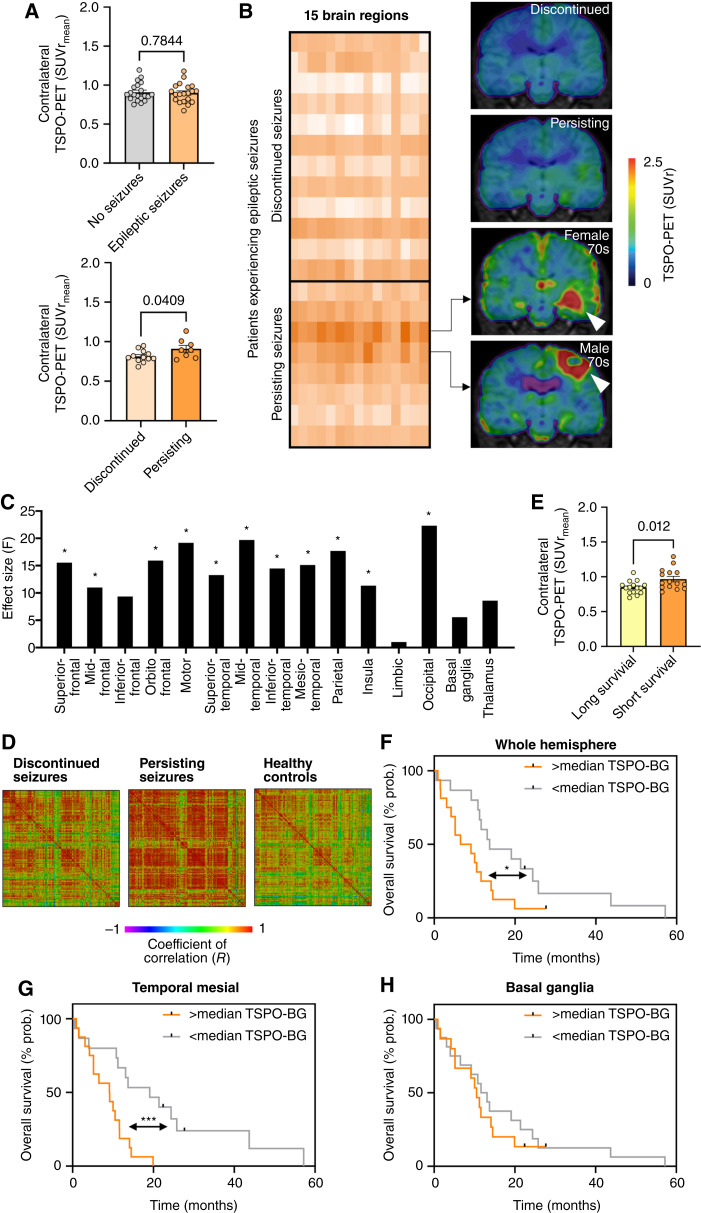
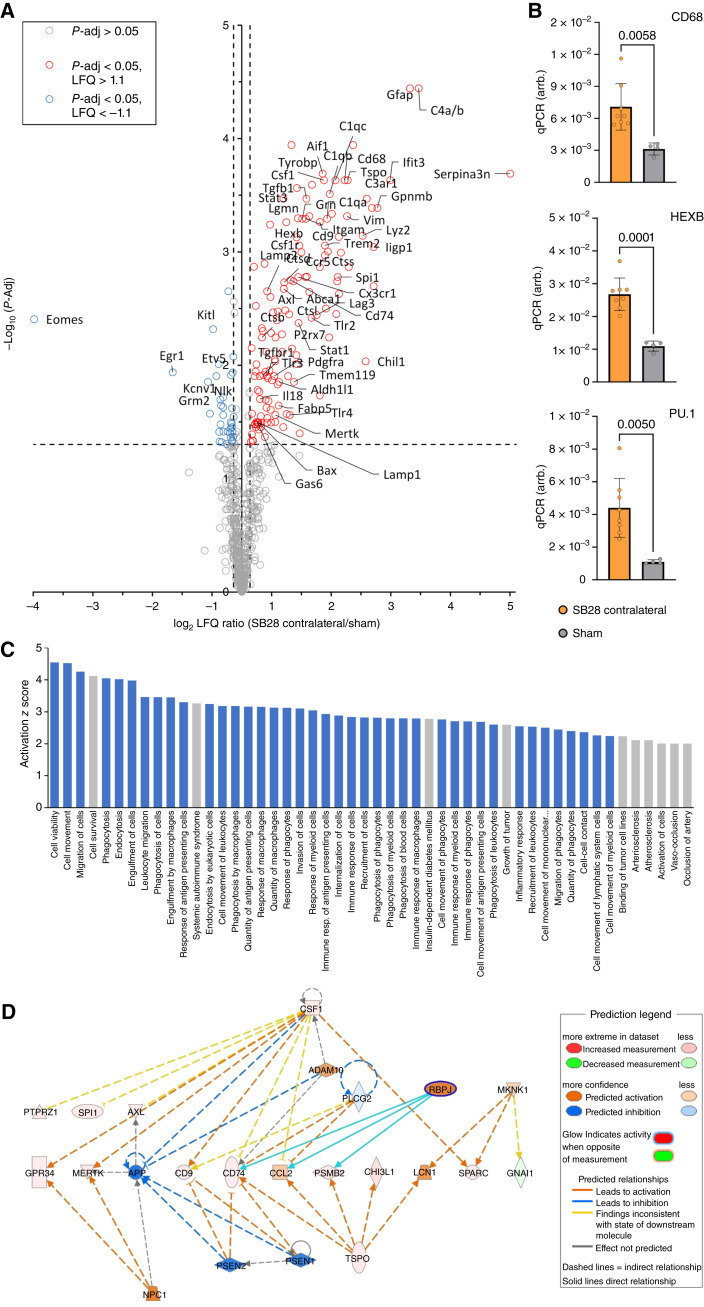
Results: Our study revealed elevated TSPO-PET signals in contralateral hemispheres of patients with newly diagnosed glioblastoma compared to healthy controls. Contralateral TSPO was associated with persisting epileptic seizures and shorter overall survival independent of the tumor phenotype. Back-translation into syngeneic glioblastoma mice pinpointed myeloid cells as the predominant source of contralateral TSPO-PET signal increases and identified a complex immune signature characterized by myeloid cell activation and immunosuppression in distant brain regions.

Conclusions: Neuroinflammation within the contralateral hemisphere can be detected with TSPO-PET imaging and associates with poor outcome in patients with newly diagnosed glioblastoma. The molecular signature of remote neuroinflammation promotes the evaluation of immunomodulatory strategies in patients with detrimental whole brain inflammation as reflected by high TSPO expression.


Conflict of interest statement

V. Zenatti reports grants from Alzheimer’s Association Grant through the AD Strategic Fund (ADSF-21-831226-C) during the conduct of the study. A. Holzgreve reports personal fees from ABX advanced biochemical compounds outside the submitted work. M. Groß reports grants from Ludwig-Maximilian-University during the conduct of the study. J.C. Tonn reports grants from DFG during the conduct of the study as well as grants from Novocure, non-financial support from Munich Surgical Imaging, and personal fees from Servier and Novartis outside the submitted work. N.L. Albert reports grants from German Research Council during the conduct of the study as well as grants and personal fees from Telix Pharmaceuticals; personal fees from Novartis, Advanced Accelerator Applications, OncLive, and Servier; and grants from Thomas Kirch Foundation and Novocure outside the submitted work. M. Brendel reports grants from German Research Foundation during the conduct of the study as well as personal fees from Roche, GE Healthcare, and MIAC; grants, personal fees, and non-financial support from Life Molecular Imaging; and grants from MJFF outside the submitted work. No potential conflicts of interest were disclosed by the other authors.

Figures

Figure 1.
Figure 1.
Elevated TSPO-PET signals in the non-lesional hemisphere of patients with glioblastoma. A, Patient selection process. Patients receiving TSPO-PET imaging at initial diagnosis of glioma were allocated. Patients with unilateral manifestation of glioblastoma (WHO IV; n = 41) or isocitrate dehydrogenase mutant astrocytoma WHO grade 2 (IDHmut astrocytoma WHO 2; n = 7) at the time of PET were selected for further analysis. B, Patients with newly diagnosed glioblastoma but not patients with IDHmut astrocytoma WHO 2 indicate higher TSPO-PET signal in the contralateral hemisphere compared to healthy controls. Images represent examples of TSPO-PET images of patients with newly diagnosed glioblastoma (left) and IDHmut astrocytoma WHO 2 (middle) in comparison to a healthy control (right). C, Surface projections and axial slices of the group average contralateral TSPO-PET signal of patients with glioblastoma, IDHmut astrocytoma WHO 2, and healthy controls. The non-lesional hemispheres were parcellated into 123 sub-regions using the Brainnetome Atlas. Axial slices show TSPO-PET signals of basal ganglia regions (masked cortical regions). D, Significant TSPO-PET signal elevation in brain regions of the contralateral hemisphere of patients with glioblastoma but not with IDHmut astrocytoma WHO 2 compared to healthy controls. E, Pronounced contralateral TSPO expression in orbito-frontal, superior-temporal, mid-temporal, and mesio-temporal regions of patients with glioblastoma. *, P < 0.01.
Figure 2.
Figure 2.
Contralateral TSPO-PET signal elevation is associated with tumor phenotype and localization. A and B, Correlation of contralateral TSPO-PET signals in patients with glioblastoma (n = 38) with the TSPO-PET signal of the tumor (A) and the tumor volume in TSPO-PET, FET-PET (B, left), and MRI (B, right). C, Examples of TSPO-PET images derived from patients with distinct tumor extent and TSPO expression in PET indicate distinct contralateral PET signal elevation. D, Overall correlation between corresponding areas of the tumor and the contralateral hemispheres including all 123 brain sub-regions of each individual patient. E, Correlation of regionally defined tumor seed regions with TSPO-PET signals of the 123 sub-regions in the contralateral hemisphere. Surface projection of tumor seed localization (top rows: seed region, colored in black) and corresponding contralateral coefficients of correlation (bottom rows). IFG, inferior-frontal gyrus; ITG, inferior-temporal gyrus; MesTemp, mesio-temporal; MFG, mid-frontal gyrus; Motor, motor area; MTG, mid-temporal gyrus; OFG, orbitofrontal gyrus; SFG, superior-frontal gyrus; STG, superior-temporal gyrus. F, Correlation of both hemispheres within 15 previously defined anatomically and functionally connected brain regions. Highest coefficients of correlation are colored in red, significant correlations are highlighted by thick boundaries.
Figure 3.
Figure 3.
Contralateral TSPO-PET signal elevation is associated with persisting epileptic seizures and worse overall survival. A, Contralateral TSPO-PET shows no quantitative difference between patients presenting with (n = 20) and without (n = 20) epileptic seizures at inital diagnosis (top). Significant increase of contralateral TSPO expression in patients experiencing persisting epileptic seizures after treatment of the primary tumor site (n = 8) compared to patients with discontinued seizures (n = 12; bottom). B, Heatmap of contralateral TSPO-PET signal in anatomically and functionally predefined brain regions (n = 15) of all patients experiencing epileptic seizures at initial diagnosis highlights two patients (age: in their 70s) with strongest contralateral TSPO expression. Coronal slices of TSPO-PET of these two patients are illustrated in comparison to group average images of patients with discontinued and persisting epileptic seizures after tumor therapy. White arrows point toward the tumor. C, Patients with persisting epileptic seizures indicate significant signal elevation in several contralateral brain regions with predominance in motor cortex, mesial temporal lobe, and occipital lobe compared to patients with discontinued epileptic seizures. *, P < 0.01. D, Matrix of regional TSPO-PET inter-correlation coefficients in comparison of patients with discontinued and persisting seizures as well as controls. Single boxes indicate interregional Pearson’s R. E, Significant increase of the contralateral TSPO-PET signal in patients with short overall survival (≤10.7 months; median split). F, High contralateral TSPO-PET signal (>0.88 SUVr; median split) at initial diagnosis is associated with worse overall survival in patients with glioblastoma. Multivariate Cox regression was adjusted for age, glucocorticoid medication, subsequent radiotherapy, and TSPO-PET signal of the tumor. **, P < 0.01. G and H, Distinct predictive value of contralateral TSPO-PET signal in different sub-regions on overall survival. *, P < 0.05.
Figure 4.
Figure 4.
Back-translation into a glioblastoma mouse model pinpoints myeloid cells as the cellular source of contralateral TSPO-PET signal elevations. A, Glioblastoma mice (n = 15) show higher TSPO-PET signal in the contralateral hemisphere compared to sham injected animals (n = 14). B, Coronal slices of group average TSPO-PET images of SB28 glioblastoma mice (top row; n = 15) and sham injected mice (bottom row; n = 14). Analyzed planes are indicated upon a CT template. Arrows point to the PET signal elevation in the contralateral hemisphere of SB28 mice. Tumor hemisphere is blurred. C, Whole brain tumor seed correlation analysis shows dependency of contralateral TSPO-PET signals (white arrows) from tumor TSPO-PET signals in SB28 mice (n = 15). Tumor TSPO-PET signals were extracted using a spherical volume of interest with 1.5 mm diameter and included as a seed in a voxel-wise statistical parametric mapping regression model. D, CD11b positive myeloid cells of the contralateral hemisphere of glioblastoma mice (n = 13) show higher single-cell TSPO tracer uptake than myeloid cells of sham injected (n = 14) or healthy control mice (n = 8; left). Non-myeloid cells show no difference in TSPO tracer uptake between the three conditions (right). E and F, Immunohistochemistry shows higher myeloid cell abundance and increased TSPO in IBA1 positive myeloid cells in contralateral hemispheres of SB28 glioblastoma mice (n = 3) compared to sham (n = 4). G, qPCR was used to exclude infiltration of SB28 glioblastoma cells into the contralateral hemispheres in SB28 glioblastoma mice (n = 8; left). Tumor tissue was used as a positive control. While tumor cells could only be detected in the tumor tissue, TSPO expression was observed in contralateral hemispheres of SB28 glioblastoma mice and exceeded TSPO expression in sham injected (n = 4) and healthy control mice (n = 4, right). (Adapted from an image created with BioRender.com.)
Figure 5.
Figure 5.
Contralateral hemispheres of SB28 glioblastoma mice indicate signatures of disease-associated myeloid cells and immunosuppression. A, Volcano plot highlights genes with significant upregulation and downregulation in the contralateral hemisphere of SB28 glioblastoma mice (red and blue, respectively) compared to sham. B, qPCR reveals higher expression of genes related to an inflammatory myeloid cell state in contralateral hemispheres of SB28 glioblastoma mice in contrast to sham. C, Illustration of the 50 pathways with highest elevation in immune cells of the contralateral hemisphere of SB28 glioblastoma mice (informed by IPA). Note that 40 out of the 50 pathways with highest activation were related to cell migration (phagocytes, leukocytes), phagocytosis, and immune cell activation (indicated in blue). D, IPA network analysis based on altered gene expression signatures in contralateral hemispheres of SB28 glioblastoma mice in contrast to sham. Depicted is a network plot showing TSPO-mediated associations with poor prognosis (e.g., CCL2) and immunosuppression (e.g., CHI3L1).

References

    1. Hambardzumyan D, Gutmann DH, Kettenmann H. The role of microglia and macrophages in glioma maintenance and progression. Nat Neurosci 2016;19:20–7. - PMC - PubMed
    1. Pyonteck SM, Akkari L, Schuhmacher AJ, Bowman RL, Sevenich L, Quail DF, et al. . CSF-1R inhibition alters macrophage polarization and blocks glioma progression. Nat Med 2013;19:1264–72. - PMC - PubMed
    1. Gutmann DH, Kettenmann H. Microglia/brain macrophages as central drivers of brain tumor pathobiology. Neuron 2019;104:442–9. - PMC - PubMed
    1. Buonfiglioli A, Hambardzumyan D. Macrophages and microglia: the cerberus of glioblastoma. Acta Neuropathol Commun 2021;9:54. - PMC - PubMed
    1. Pombo Antunes AR, Scheyltjens I, Lodi F, Messiaen J, Antoranz A, Duerinck J, et al. . Single-cell profiling of myeloid cells in glioblastoma across species and disease stage reveals macrophage competition and specialization. Nat Neurosci 2021;24:595–610. - PubMed

MeSH terms