. 2024 Aug 16;10(33):eadn6272.
doi: 10.1126/sciadv.adn6272. Epub 2024 Aug 16.

A thalamic nucleus reuniens-lateral septum-lateral hypothalamus circuit for comorbid anxiety-like behaviors in chronic itch

Affiliations

A thalamic nucleus reuniens-lateral septum-lateral hypothalamus circuit for comorbid anxiety-like behaviors in chronic itch

Su-Shan Guo et al. Sci Adv. .

Abstract

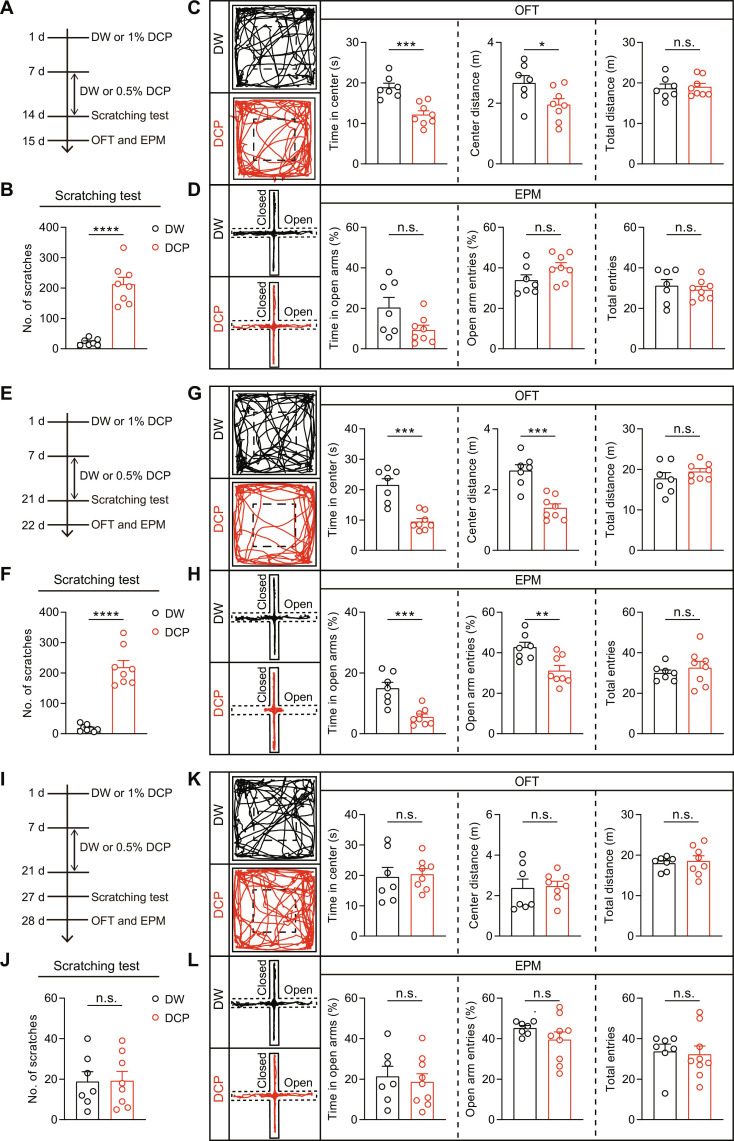
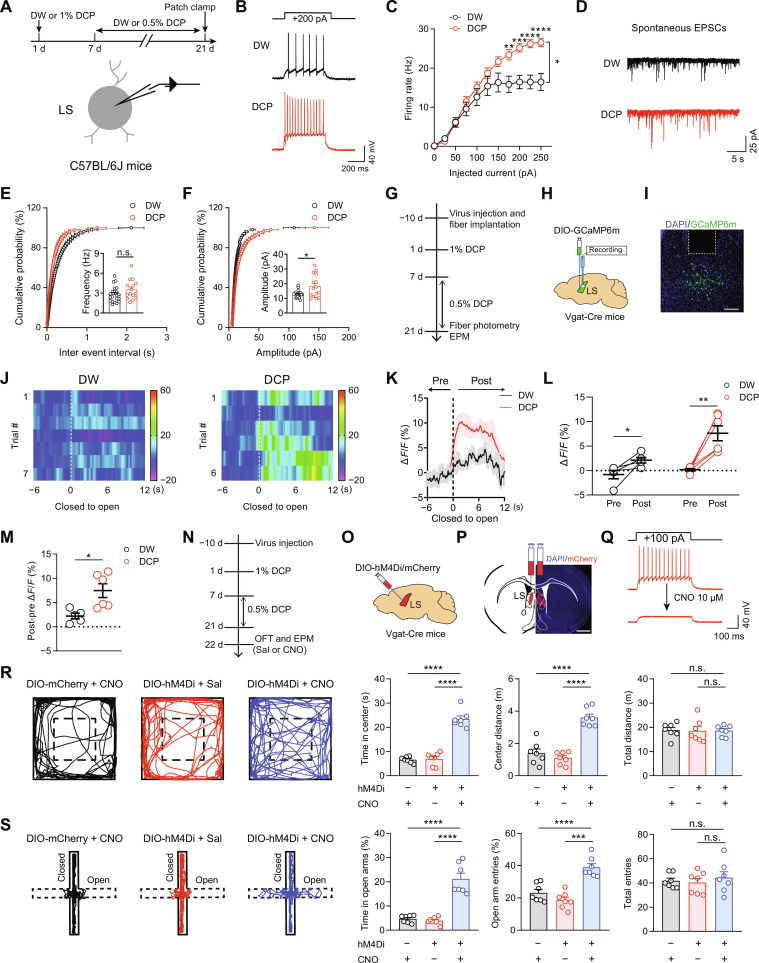
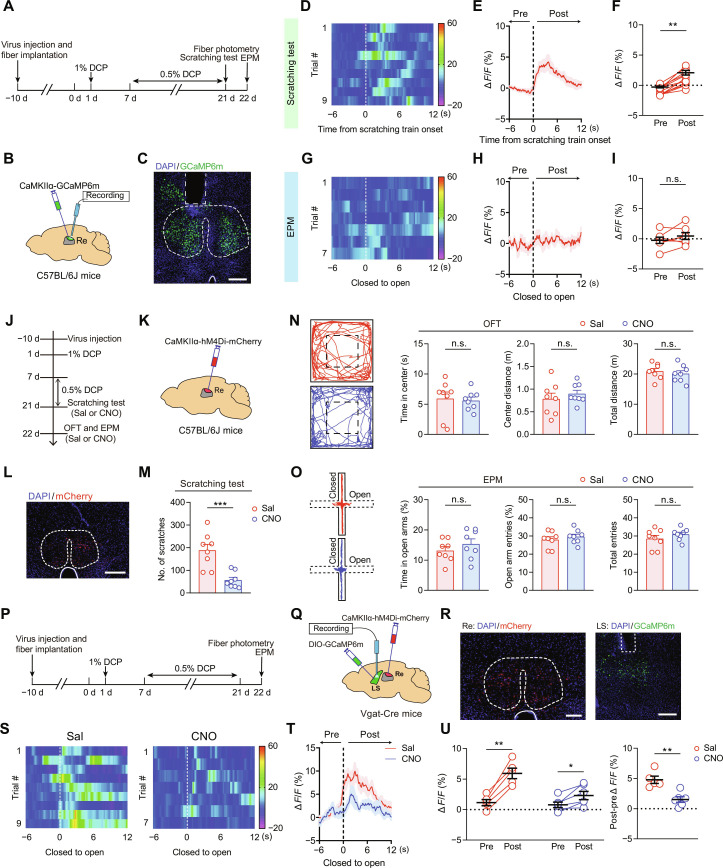
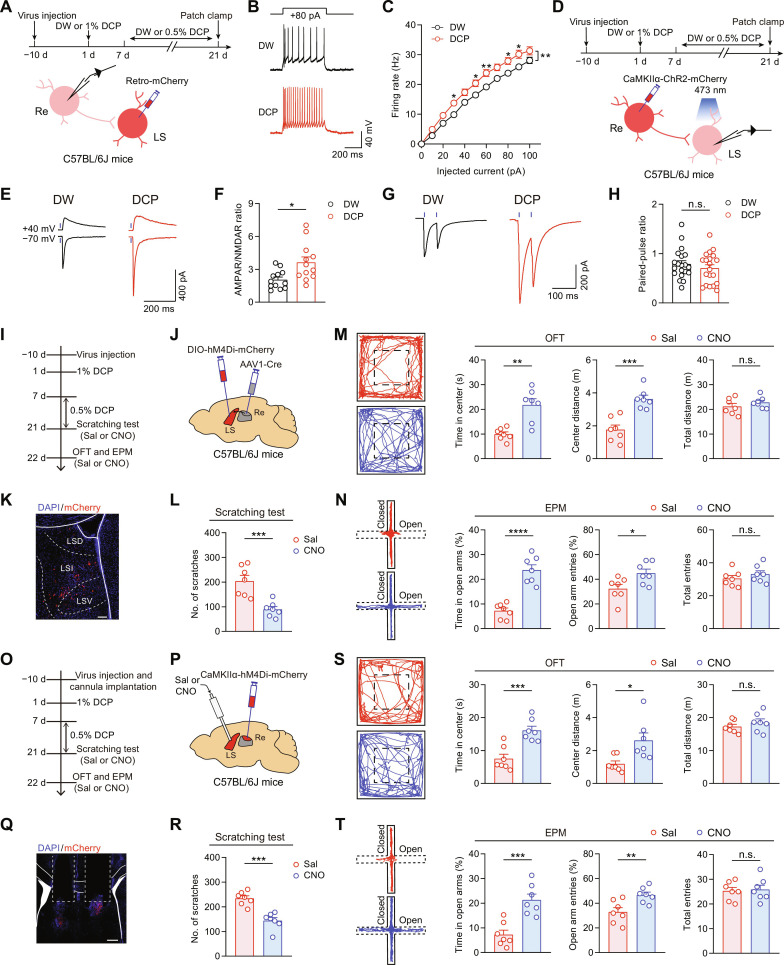
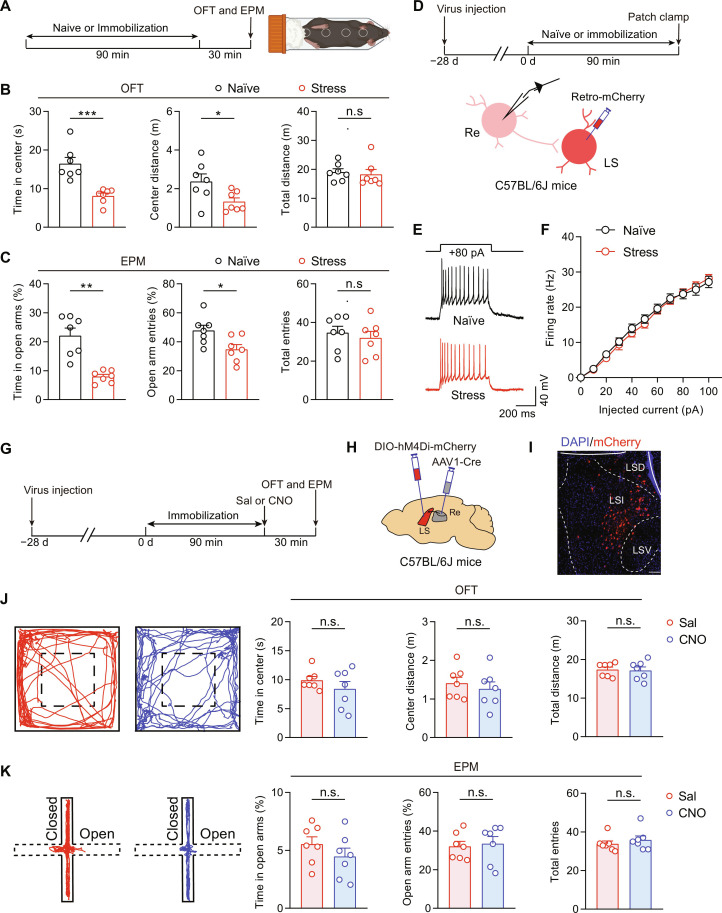
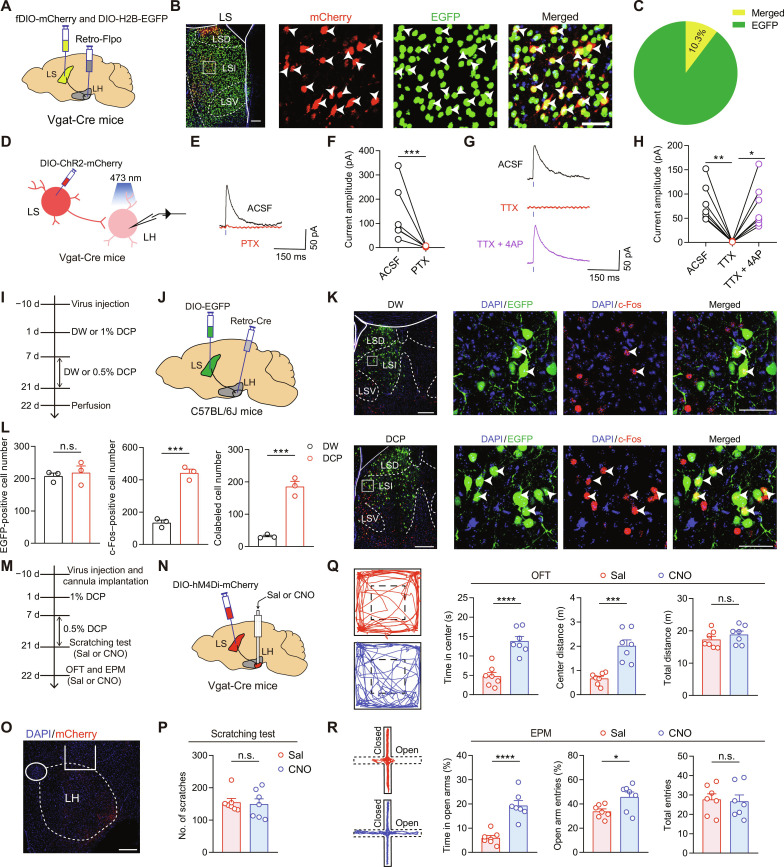
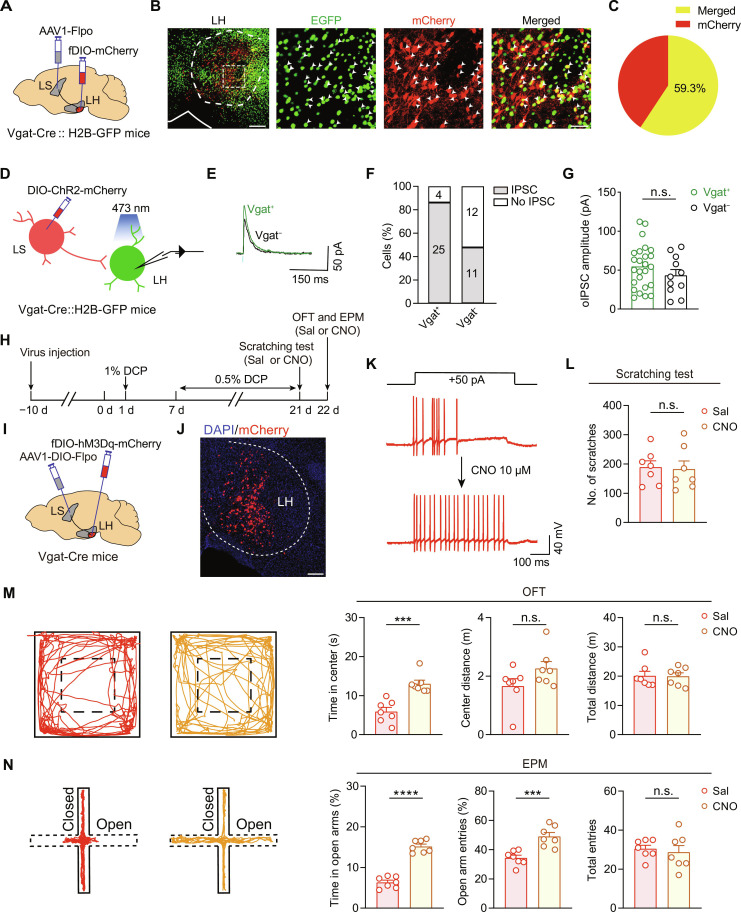
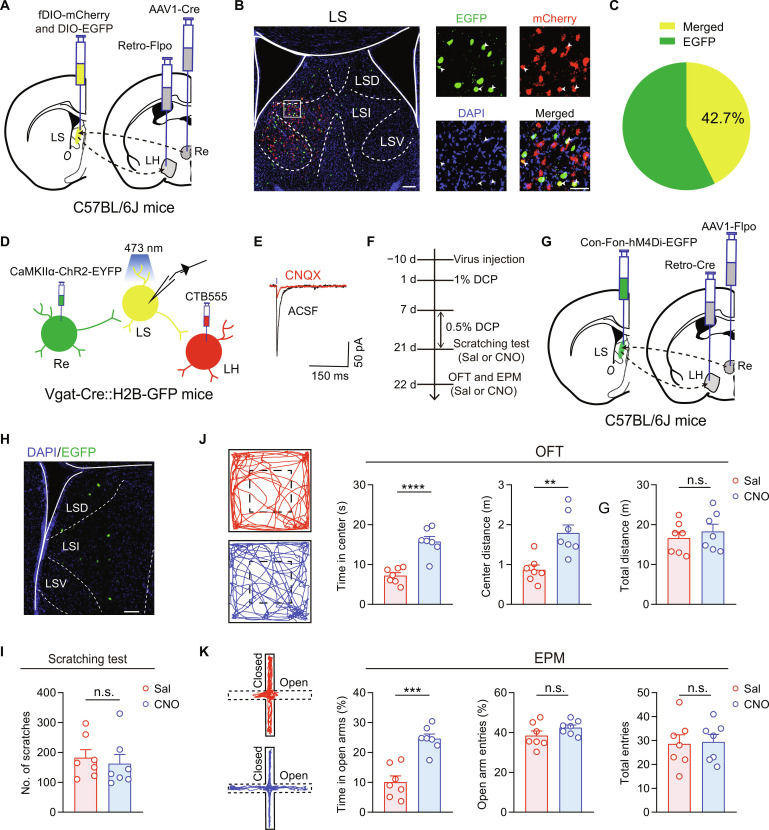
Chronic itch often clinically coexists with anxiety symptoms, creating a vicious cycle of itch-anxiety comorbidities that are difficult to treat. However, the neuronal circuit mechanisms underlying the comorbidity of anxiety in chronic itch remain elusive. Here, we report anxiety-like behaviors in mouse models of chronic itch and identify γ-aminobutyric acid-releasing (GABAergic) neurons in the lateral septum (LS) as the key player in chronic itch-induced anxiety. In addition, chronic itch is accompanied with enhanced activity and synaptic plasticity of excitatory projections from the thalamic nucleus reuniens (Re) onto LS GABAergic neurons. Selective chemogenetic inhibition of the Re → LS circuit notably alleviated chronic itch-induced anxiety, with no impact on anxiety induced by restraint stress. Last, GABAergic neurons in lateral hypothalamus (LH) receive monosynaptic inhibition from LS GABAergic neurons to mediate chronic itch-induced anxiety. These findings underscore the potential significance of the Re → LS → LH pathway in regulating anxiety-like comorbid symptoms associated with chronic itch.


Figures

Fig. 1.
Fig. 1.. Time dependence of chronic itch–induced anxiety–like behaviors.
(A, E, and I) Timelines for establishing DCP-induced animal model of chronic itch and the behavioral tests by OFT and EPM. (A) DCP painting for 1 week; (E) DCP painting for 2 weeks; (I) DCP painting for 2 weeks but with the behavioral tests performed at 1 week after the last DCP painting. (B, F, and J) DCP-evoked repetitive scratching bouts for animals subjected to the treatment regime as illustrated in (A), (E), and (I). (B) DW, n = 7 mice; DCP, n = 8 mice. (F) DW, n = 8 mice; DCP, n = 8 mice. (J) DW, n = 7 mice; DCP, n = 8 mice. ****P < 0.0001, unpaired t test. (C, G, and K) Left: Example trajectories of DW- and DCP-treated mice in OFT. Dashed boxes indicate the center area. Middle and right: Time spent in the center zone, distance traveled in the center zone, and total distance traveled in the open arena. (C) DW, n = 7 mice; DCP, n = 8 mice. (G) DW, n = 7 mice; DCP, n = 8 mice. (K) DW, n = 7 mice; DCP, n = 8 mice. *P < 0.05 and ***P < 0.001, unpaired t test. (D, H, and L) Left: Example trajectories of DW- and DCP-treated mice in EPM. Middle and right: Percentage of time spent in the open arms, percentage of open arm entries, and total number of arm entries. (D) DW, n = 7 mice; DCP, n = 8 mice. (H) DW, n = 7 mice; DCP, n = 8 mice. (L) DW, n = 7 mice; DCP, n = 9 mice. **P < 0.01 and ***P < 0.001, unpaired t test. n.s., no significant difference. Data are presented as means ± SEM.
Fig. 2.
Fig. 2.. LS GABAergic neurons contribute to chronic itch–induced anxiety–like behaviors.
(A) Schematics showing the experimental timeline and configuration of whole-cell patch-clamp recording of LS GABAergic neurons. (B and C) Representative traces (B) and statistical data (C) for action potential firing of LS neurons. DW, n = 13 cells from 5 mice; DCP, n = 17 cells from 6 mice. **P < 0.01, ***P < 0.001, and ****P < 0.0001, two-way repeated-measures analysis of variance (ANOVA) followed by least significant difference (LSD) multiple comparisons test. (D to F) Representative traces (D) and quantitative analysis of sEPSC frequency (E) and amplitude (F). DW, n = 21 cells from 5 mice; DCP, n = 15 cells from 5 mice. *P < 0.05, unpaired t test. (G to I) Schematics of experimental timeline (G), viral strategy (H), and histological verification (I) for fiber photometry recordings of LS GABAergic neurons. Scale bar, 250 μm. (J) Heatmap illustration of Ca2+ signals aligned to the onset of close-to-open transition in EPM (dashed lines) for a representative mouse (left, DW; right, DCP). (K) Average Ca2+ transients (n = 5 or 6 mice per group). Thick lines indicate mean, and shaded areas indicate SEM. (L) Average ΔF/F for pre- and postperiod as shown in (K). DW, n = 5 mice; DCP, n = 6 mice. *P < 0.05 and **P < 0.01, paired t test. (M) Analysis of post-pre ΔF/F for both DW and DCP groups. *P < 0.05, unpaired t test. (N to Q) Experimental timeline (N), viral strategy (O), histological (P), and functional validation (Q) for chemogenetic silencing of LS GABAergic neurons. Sal, saline. Scale bar, 1 mm (P). (R and S) Representative locomotion traces and quantitative analysis of the OFT (R) and EPM (S) data. n = 7 mice for each group. ***P < 0.001 and ****P < 0.0001, one-way ANOVA followed by LSD multiple comparisons test. Data are presented as means ± SEM.
Fig. 3.
Fig. 3.. Involvement of Re in chronic itch–induced scratching behaviors and LS GABAergic neuronal activation.
(A to C) Schematics of experimental timeline (A), viral strategy (B), and histological verification (C) for fiber photometry recordings of Re glutamatergic neurons. Scale bar, 250 μm. (D) Heatmap illustration of Ca2+ signals aligned to the onset of scratching train (dashed line) for a representative mouse. (E and F) Average Ca2+ signals (E) and ΔF/F for pre- and postperiod (F) relative to the onset of DCP-induced scratching train. n = 6 mice. **P < 0.01, paired t test. (G) Heatmap illustration of Ca2+ signals aligned to the onset of close-to-open transition in EPM (dashed line) for a representative mouse. (H and I) Average Ca2+ transients (H) and ΔF/F for pre- and postperiod (I) relative to the transition from closed to open arms. n = 7 mice. (J to L) Schematics of experimental timeline (J), viral strategy (K), and histological verification (L) for chemogenetic silencing of Re glutamatergic neurons. Scale bar, 200 μm. (M) Number of scratching bouts for either saline- or CNO-treated animals. n = 8 mice. ***P < 0.001, unpaired t test. (N and O) Representative locomotion traces and quantitative analysis of the OFT (N) and EPM (O) data. n = 8 mice for each group. (P to R) Experimental timeline (P), viral strategy (Q), and histological verification (R) for fiber photometry recordings of LS neurons with chemogenetic inhibition of Re neurons. Scale bars, 100 μm (left) and 250 μm (right). (S to U) Heatmaps (S), average traces (T), and quantification (U) of GCaMP6m signal. Saline, n = 5 mice; CNO, n = 6 mice. *P < 0.05 and **P < 0.01, paired t test (U, left) or unpaired t test (U, right). Data are presented as means ± SEM.
Fig. 4.
Fig. 4.. The Re → LS projection mediates chronic itch–evoked anxiety–like behaviors.
(A) Schematics showing the timeline and configuration of whole-cell patch-clamp recording of LS-projecting Re neurons in DW- or DCP-treated animals. (B and C) Representative traces (B) and statistical data (C) for action potential firing. DW, n = 27 cells from 5 mice; DCP, n = 25 cells from 5 mice. *P < 0.05 and **P < 0.01, two-way repeated-measures ANOVA followed by LSD multiple comparisons test. (D) Schematics showing the timeline and configuration of electrophysiological recording of Re → LS synaptic transmission. (E and F) Sample traces (E) and summary data of AMPAR/NMDAR ratio (F). DW, n = 12 cells from 5 mice; DCP, n = 12 cells from 5 mice. *P < 0.05, unpaired t test. (G and H) Sample traces (G) and summary data (H) of paired-pulse ratio (PPR) of light-evoked EPSCs. DW, n = 20 cells from 7 mice; DCP, n = 20 cells from 6 mice. (I to K) Schematics of experimental timeline (I), viral strategy (J), and histological verification (K) for chemogenetic silencing of Re-innervated LS neurons. Scale bar, 100 μm. LSD, lateral septum, dorsal part; LSI, lateral septum, intermediate part; LSV, lateral septum, ventral part. (L) Number of scratching bouts for either saline- or CNO-treated animals. n = 7 mice. ***P < 0.001, unpaired t test. (M and N) Representative locomotion traces and quantitative analysis of the OFT (M) and EPM (N) data. *P < 0.05, **P < 0.01, ***P < 0.001, and ****P < 0.0001, unpaired t test. (O to Q) Schematics of experimental timeline (O), viral strategy (P), and histological verification (Q) for chemogenetic inhibition of Re → LS projection. Scale bar, 250 μm. (R) Number of scratching bouts. n = 7 mice. ***P < 0.001, unpaired t test. (S and T) Representative locomotion traces and quantitative analysis of the OFT (S) and EPM (T) data. *P < 0.05, **P < 0.01, and ***P < 0.001, unpaired t test. Data are presented as means ± SEM.
Fig. 5.
Fig. 5.. The Re → LS circuit is not involved in acute restraint stress–induced anxiety–like behaviors.
(A) Schematic of timeline for behavioral experiments on mice subjected to acute restraint stress. (B and C) Performance of naïve mice and those subject to restraint stress in OFT (B) or EPM (C). n = 7 mice for each group. *P < 0.05, **P < 0.01, and ***P < 0.001, unpaired t test. (D) Schematics showing timeline and configuration of electrophysiological recording on LS-projecting Re neurons in naïve and restraint stress–treated animals. (E and F) Sample traces (E) and statistical data (F) for action potential firing. Naïve, n = 25 cells from 5 mice; stress, n = 31 cells from 4 mice. (G to I) Schematics of experimental timeline (G), viral strategy (H), and histological verification (I) for chemogenetic silencing of Re-innervated LS neurons. Scale bar, 100 μm. (J and K) Representative locomotion traces and quantitative analysis of the OFT (J) and EPM (K) data. n = 7 mice for each group. Data are presented as means ± SEM.
Fig. 6.
Fig. 6.. The LS → LH projection mediates chronic itch–evoked anxiety–like behaviors.
(A) Schematic showing the viral strategy for retrograde tracing of LS → LH projection. (B) Representative images for EGFP (GABAergic neurons), mCherry (LH-projecting LS neurons), and merge (yellow and white arrowheads). Scale bars, 150 μm (left) and 50 μm (right). (C) Pie chart showing the percentage of EGFP+/mCherry+ cells among all EGFP+ cells. n = 5 mice. (D) Schematic showing the configuration for electrophysiological recording of the LS → LH projection. (E and F) Sample traces (E) and statistical data (F) of blue light–induced IPSCs in LH neurons in the absence and presence of PTX. n = 6 cells from 3 mice. ***P < 0.001, ratio paired t test. (G and H) Sample traces (G) and statistical data (H) of blue light–induced IPSCs in the absence and presence of TTX or TTX plus 4AP. n = 7 cells from 3 mice. *P < 0.05 and **P < 0.01, one-way repeated-measures ANOVA followed by LSD multiple comparisons test. (I and J) Schematics of experimental timeline (I) and viral strategy (J) for examining the activation of LS → LH circuit by chronic itch. (K) Representative images for EGFP, c-Fos, and merge. Scale bars, 250 μm (left) and 50 μm (right). (L) Quantitative analysis of numbers of EGFP+, c-Fos+, and EGFP+/c-Fos+ cells. n = 3 mice. ***P < 0.001, unpaired t test. (M to O) Experimental timeline (M), viral strategy (N), and histological verification (O) for chemogenetic inhibition of LS → LH projection. Scale bar, 250 μm. (P) Number of scratching bouts. n = 7 mice. (Q and R) Representative locomotion traces and quantitative analysis of the OFT (Q) and EPM (R) data. n = 7 mice for each group. *P < 0.05, ***P < 0.001, and ****P < 0.0001, unpaired t test. Data are presented as means ± SEM.
Fig. 7.
Fig. 7.. LS projects to LH GABAergic neurons to mediate chronic itch–induced anxiety–like behaviors.
(A) Schematic showing the viral strategy for identifying the predominant LH cell type that receives innervations from LS. (B) Representative images of immunofluorescent signals for GFP (GABAergic neurons), mCherry (LS-innervated LH cells), and merge (yellow and white arrowheads). Scale bars, 250 μm (left) and 50 μm (right). (C) Pie chart showing the percentage of GFP+/mCherry+ cells among all mCherry+ cells in the LH. n = 5 mice. (D) Schematic showing the configuration for electrophysiological identification of the postsynaptic LH cell types receiving innervation from LS GABAergic neurons. (E and F) Sample traces (E) and summary graph (F) showing percentage of LH Vgat+ (GFP+) and Vgat (GFP) neurons that responded to light stimulation with IPSCs. (G) Statistical data of the amplitude of optogenetically-evoked IPSCs (oIPSCs) recorded in Vgat+ (25 cells from seven mice) and Vgat (11 cells from seven mice) LH neurons. (H to K) Schematics of experimental timeline (H), viral strategy (I), histological (J), and functional verification (K) for chemogenetic activation of LS-innervated LH GABAergic neurons. Scale bar, 200 μm (J). (L) Number of scratching bouts. n = 7 mice; t12 = 0.1814, P = 0.859, unpaired t test. (M and N) Representative locomotion traces and quantitative analysis of the OFT (M) and EPM (N) data. n = 7 mice for each group. ***P < 0.001 and ****P < 0.0001, unpaired t test. Data are presented as means ± SEM.
Fig. 8.
Fig. 8.. Connectivity and function of the Re → LS → LH pathway.
(A) Schematic showing the combinational viral strategy for characterizing the connectivity of the Re → LS → LH circuit. (B) Representative images of immunofluorescent signals for EGFP (Re-innervated LS neurons), mCherry (LH-projecting LS cells), DAPI, and merge (yellow and white arrowheads). Scale bars, 150 μm (left) and 50 μm (right). (C) Pie chart showing the percentage of EGFP+/mCherry+ cells among all EGFP+ cells in the LS. n = 5 mice. (D) Schematic of viral and CTB555 injection and whole-cell recording configuration in the LS slices from Vgat-Cre:H2B-GFP mice. (E) Representative EPSC traces, in the absence and presence CNQX, evoked in CTB555+/GFP+ neurons by blue light stimulation of Re projection terminals. (F to H) Schematics of experimental timeline (F), viral strategy (G), and histological verification (H) for chemogenetic inhibition of LH-projecting LS neurons that receive innervation from Re. Scale bar, 100 μm. (I) Number of scratching bouts. n = 7 mice; t12 = 0.4991, P = 0.6268, unpaired t test. (J and K) Representative locomotion traces and quantitative analysis of the OFT (J) and EPM (K) data. n = 7 mice for each group. **P < 0.01, ***P < 0.001, and ****P < 0.0001, unpaired t test. Data are presented as means ± SEM.

References

    1. Dong X., Dong X., Peripheral and central mechanisms of itch. Neuron 98, 482–494 (2018). - PMC - PubMed
    1. Cevikbas F., Lerner E. A., Physiology and pathophysiology of itch. Physiol. Rev. 100, 945–982 (2020). - PMC - PubMed
    1. Chen X. J., Sun Y. G., Central circuit mechanisms of itch. Nat. Commun. 11, 3052 (2020). - PMC - PubMed
    1. Sanders K. M., Akiyama T., The vicious cycle of itch and anxiety. Neurosci. Biobehav. Rev. 87, 17–26 (2018). - PMC - PubMed
    1. Jafferany M., Davari M. E., Itch and psyche: Psychiatric aspects of pruritus. Int. J. Dermatol. 58, 3–23 (2019). - PubMed

Publication types