. 2024 Aug 16;10(33):eado7249.
doi: 10.1126/sciadv.ado7249. Epub 2024 Aug 16.

Magnetically attracting hydrogel reshapes iron metabolism for tissue repair

Affiliations

Magnetically attracting hydrogel reshapes iron metabolism for tissue repair

Yichang Xu et al. Sci Adv. .

Abstract

Ferroptosis, caused by disorders of iron metabolism, plays a critical role in various diseases, making the regulation of iron metabolism essential for tissue repair. In our analysis of degenerated intervertebral disc tissue, we observe a positive correlation between the concentration of extracellular iron ions (ex-iron) and the severity of ferroptosis in intervertebral disc degeneration (IVDD). Hence, inspired by magnets attracting metals, we combine polyether F127 diacrylate (FDA) with tannin (TA) to construct a magnetically attracting hydrogel (FDA-TA). This hydrogel demonstrates the capability to adsorb ex-iron and remodel the iron metabolism of cells. Furthermore, it exhibits good toughness and self-healing properties. Notably, it can activate the PI3K-AKT pathway to inhibit nuclear receptor coactivator 4-mediated ferritinophagy under ex-iron enrichment conditions. The curative effect and related mechanism are further confirmed in vivo. Consequently, on the basis of the pathological mechanism, a targeted hydrogel is designed to reshape iron metabolism, offering insights for tissue repair.


Figures
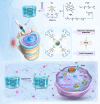
Fig. 1.
Fig. 1.. Schematic illustration of the preparation of magnetic absorbent hydrogel and reshaping iron metabolism in treating IVDD.
Fig. 2.
Fig. 2.. Verifying the correlation between iron ion concentration, ferroptosis, and degeneration degree in human degenerative NP tissue.
(A) MRI images of moderate degeneration of the intervertebral disc. (B) MRI images of severe degeneration of the intervertebral disc. (C) Prussian blue enhanced staining of the NP tissue with different degrees of degeneration; GPX4 and FTH1 immunofluorescence double-labeled staining. (D) Quantitative analysis of the Prussian blue enhanced staining positive area, semi-quantitative analysis of immunofluorescence intensity (n = 6). (E) WB analysis of GPX4 and FTH1 in different degrees of degeneration (n = 3). (F to I) Correlation analysis between iron ion concentration and GPX4 mRNA expression, FTH1 mRNA expression, GPX4 immunohistochemical positive cell number, and FTH1 immunohistochemical positive cell number. (J) Correlation analysis between MRI grade and tissue iron ion concentration. Statistical analysis was performed using Tukey’s test; statistical significance was set at P < 0.05.
Fig. 3.
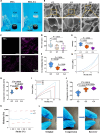
Fig. 3.. Verifying the correlation between iron ion concentration, ferroptosis, and degeneration degree in rat-degenerated NP tissue.
(A) MRI images of rat-degenerated intervertebral discs in different degrees. (B) WB analysis of GPX4 and FTH1 in the degenerated NP tissue (n = 3). (C) Prussian blue enhanced staining in different degrees of degeneration; GPX4 and FTH1 immunofluorescence analysis. (D) Quantitative analysis of Prussian blue enhanced staining positive area (n = 6). (E) Semi-quantitative analysis of FTH1 immunofluorescence intensity (n = 6). (F) Semi-quantitative analysis of GPX4 immunofluorescence intensity (n = 6). (G to J) Correlation analysis between tissue iron ion concentration and GPX4 mRNA expression, FTH1 mRNA expression, GPX4 immunohistochemical positive cell number, and FTH1 immunohistochemical positive cell number. (K) Correlation analysis between MRI grade and tissue iron ion concentration. Statistical analysis was performed using a one-way analysis of variance (ANOVA) with Tukey’s post hoc test. Statistical significance was set at P < 0.05.
Fig. 4.
Fig. 4.. In vitro verifications of ferroptosis induced by iron ions in NPCs.
(A) WB analysis of ferroptosis-related indicators in different groups (n = 6). (B) Semi-quantitative analysis of GPX4 fluorescence intensity (n = 6). (C) GPX4 and FTH1 immunofluorescence staining. (D) FerroOrange probe staining and TEM observation of mitochondrial morphology of NPCs (yellow arrow indicates mitochondria). (E) JC-1 staining to detect mitochondrial membrane potential. (F) Semi-quantitative analysis for FTH1 fluorescence intensity (n = 6). (G) Semi-quantitative analysis for FerroOrange fluorescence intensity (n = 6). (H) Semi-quantitative analysis of JC-1 staining fluorescence intensity (n = 6). (I) Quantitative analysis of flow cytometry of H2DCFDA and C11-BODIPY581/591 (n = 6). (J) Flow cytometry analysis of H2DCFDA and C11-BODIPY581/591. (K) Scratch test to evaluate the activity of NPCs in different groups. (L) Quantitative analysis for C11-BODIPY581/591 flow cytometry (n = 6). (M) Scratch test healing quantitative analysis (n = 6). Statistical analysis was performed using a ANOVA with Tukey’s post hoc test. Statistical significance was set at P < 0.05.
Fig. 5.
Fig. 5.. Preparation and characterization of targeted magnetic hydrogel.
(A) General view of FDA and FDA-TA hydrogels before and after crosslinking. (B) SEM analysis of hydrogels with different volume ratios (G2 = 2:1, G3 = 3:1, and G4 = 4:1). (C) Mapping analysis of different groups of hydrogel adsorption iron ion in vitro. (D) Analysis of hydrogel pore size (n = 15). (E) Semi-quantitative analysis of fluorescence intensity of mapping in different groups (n = 4). (F) UV crosslinking time determination of different groups of hydrogels (n = 3). (G and H) Compression modulus curves and analysis of different groups of hydrogels (n = 3). (I to J) Tensile modulus curves and analysis of different groups of hydrogels (n = 4). (K) Hydrogel rheological testing to assess self-healing. (L) Demonstration of hydrogel toughness. Statistical analysis was performed using an ANOVA with Tukey’s post hoc test. Statistical significance was set at P < 0.05.
Fig. 6.
Fig. 6.. The targeted hydrogel reshapes iron metabolism in vitro.
(A) Schematic illustration of coculture experiment. (B to D) WB results and statistical analysis of ferroptosis-related indicators and ECM synthesis-related indicators (n = 6). (E) Semi-quantitative analysis of FerroOrange fluorescence intensity (n = 6). (F) FerroOrange probe staining and TEM observation of mitochondrial morphology in NPCs (yellow arrows indicate mitochondria). (G) Semi-quantitative analysis of fluorescence intensity of JC-1 staining (n = 6). (H) Quantitative analysis of H2DCFDA by flow cytometry (n = 6). (I) Quantitative analysis of C11-BODIPY581/591 by flow cytometry analysis (n = 6). (J) JC-1 staining of NPCs. (K) H2DCFDA and C11-BODIPY581/591 flow cytometry analysis. Statistical analysis was performed using an ANOVA with Tukey’s post hoc test. Statistical significance was set at P < 0.05.
Fig. 7.
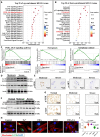
Fig. 7.. The targeted hydrogel activates the PI3K-AKT pathway to inhibit ferritinophagy in NPCs.
(A) KEGG enrichment analysis of up-regulated signaling pathways. (B) KEGG enrichment analysis of down-regulated biological behaviors. (C) PI3K-AKT, ferroptosis, autophagy-animal GSEA enrichment analysis. (D) LC3b and NCOA4 protein expression in human degenerative NP tissue. (E) p-PI3K and p-AKT immunohistochemical staining of human-degenerated NP tissue. (F) LC3b and NCOA4 protein expression in rat-degenerated NP tissue. (G) p-PI3K and p-AKT immunohistochemical staining of rat-degenerated NP tissue. (H) LC3b immunofluorescence staining of NPCs. (I) Semi-quantitative analysis of LC3b immunofluorescence intensity (n = 5). Statistical analysis was performed using an ANOVA with Tukey’s post hoc test. Statistical significance was set at P < 0.05. FDR, false discovery rate; NES, normalized enrichment score.
Fig. 8.
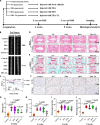
Fig. 8.. The targeted hydrogel reshapes iron metabolism and IVDD in vivo.
(A) Overview of animal experiments. (B) MRI and radiographic analysis of rat degenerated intervertebral disc. (C) DHI% analysis of the intervertebral disc space. (D) H&E staining 4 and 8 weeks after treatment. DHI, disc height index. (E) S&O staining 4 and 8 weeks after treatment. (F) LC3b and NCOA4 immunohistochemical staining after 8 weeks of treatment. (G) Statistical analysis of MRI classification 4 weeks after treatment (n = 5). (H) Statistical analysis of MRI classification 8 weeks after treatment (n = 5). (I) Statistical analysis of histological findings 4 weeks after treatment (n = 5). (J) Statistical analysis of histological findings 8 weeks after treatment (n = 5). Statistical analysis was performed using a one-way or two-way ANOVA with Tukey’s post hoc test. Statistical significance was set at P < 0.05.

References

    1. Liu C., Shen Y., Cavdar O., Huang J., Fang H., Angiotensin II-induced vascular endothelial cells ferroptosis via P53-ALOX12 signal axis. Clin.Exp. Hypertens. 45, 2180019 (2023). - PubMed
    1. Chu B., Kon N., Chen D., Li T., Liu T., Jiang L., Song S., Tavana O., Gu W., ALOX12 is required for p53-mediated tumour suppression through a distinct ferroptosis pathway. Nat. Cell Biol. 21, 579–591 (2019). - PMC - PubMed
    1. Wang B., Jin Y., Liu J., Liu Q., Shen Y., Zuo S., Yu Y., EP1 activation inhibits doxorubicin-cardiomyocyte ferroptosis via Nrf2. Redox Biol. 65, 102825 (2023). - PMC - PubMed
    1. Yang W., Mu B., You J., Tian C., Bin H., Xu Z., Zhang L., Ma R., Wu M., Zhang G., Huang C., Li L., Shao Z., Dai L., Desaubry L., Yang S., Non-classical ferroptosis inhibition by a small molecule targeting PHB2. Nat. Commun. 13, 7473 (2022). - PMC - PubMed
    1. Zhu J., Sun R., Sun K., Yan C., Jiang J., Kong F., Shi J., The Deubiquitinase USP11 ameliorates intervertebral disc degeneration by regulating oxidative stress-induced ferroptosis via deubiquitinating and stabilizing Sirt3. Redox Biol. 62, 102707 (2023). - PMC - PubMed