. 2024 Aug 16;9(98):eadh0368.
doi: 10.1126/sciimmunol.adh0368. Epub 2024 Aug 16.

Functional overlap of inborn errors of immunity and metabolism genes defines T cell metabolic vulnerabilities

Affiliations

Functional overlap of inborn errors of immunity and metabolism genes defines T cell metabolic vulnerabilities

Andrew R Patterson et al. Sci Immunol. .

Abstract

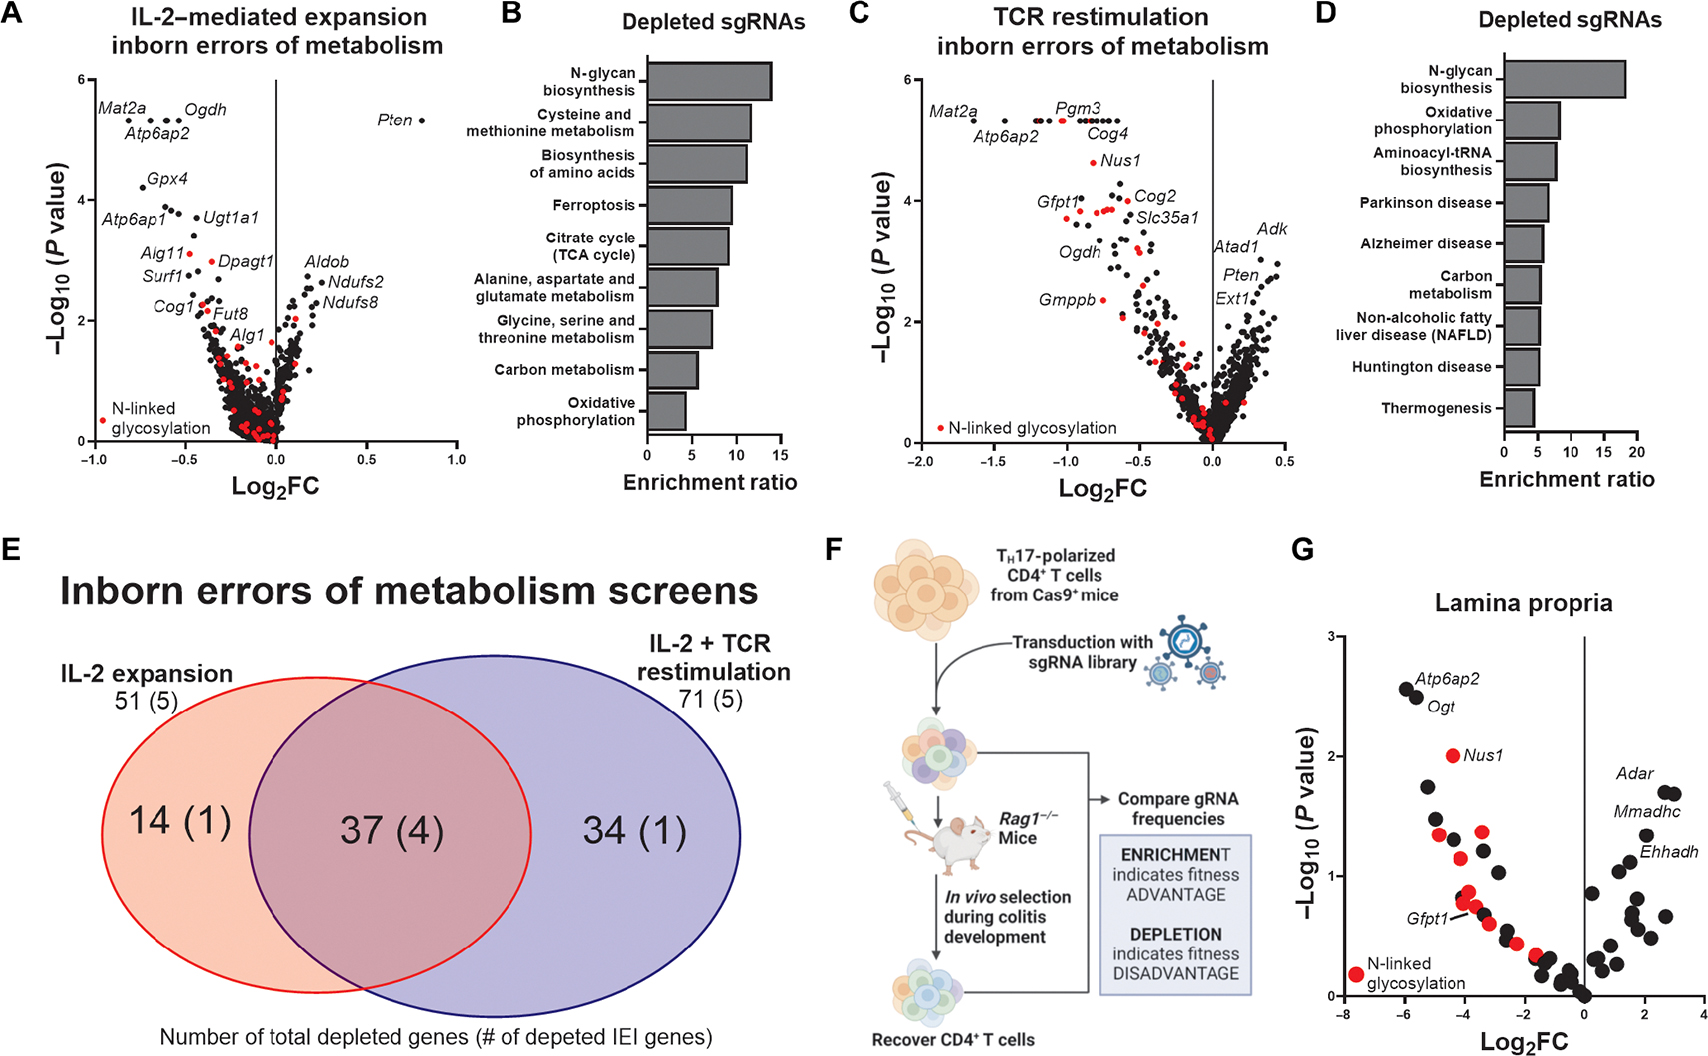
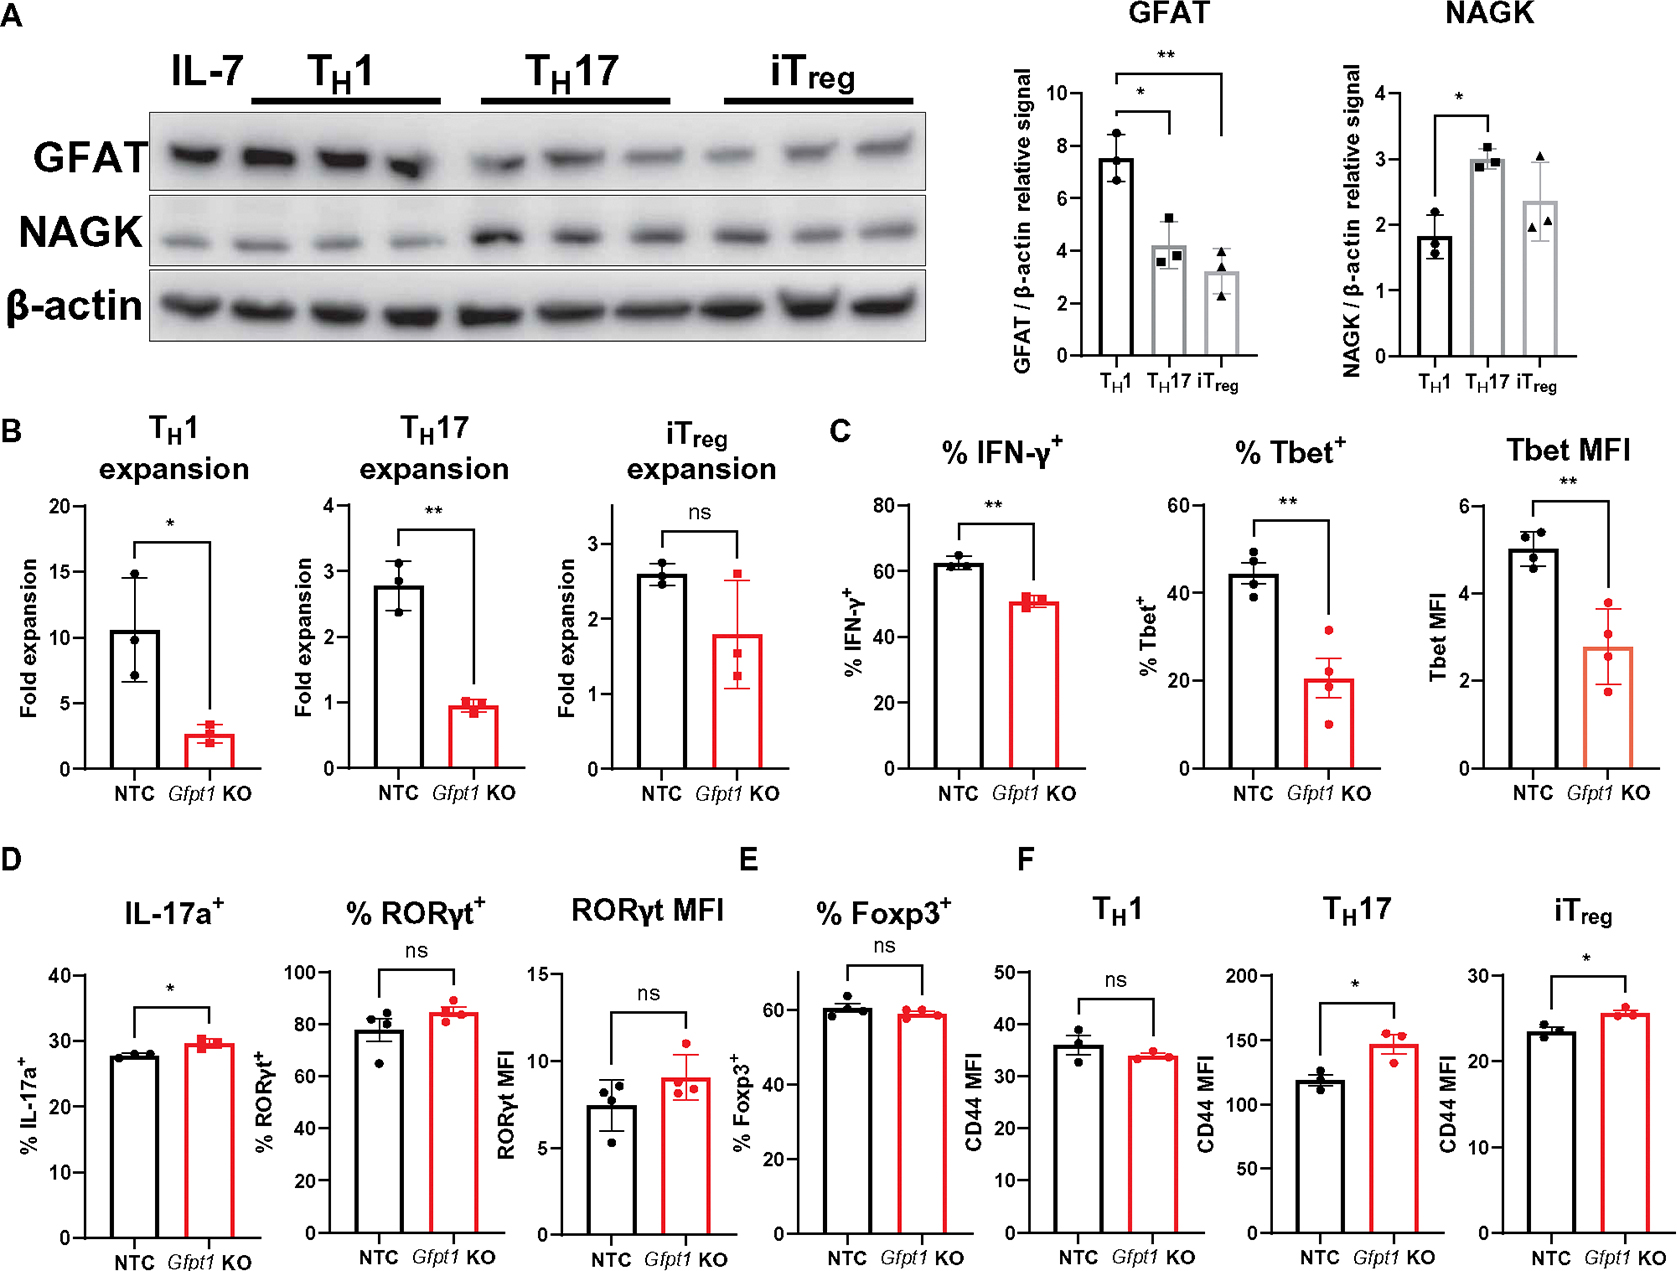
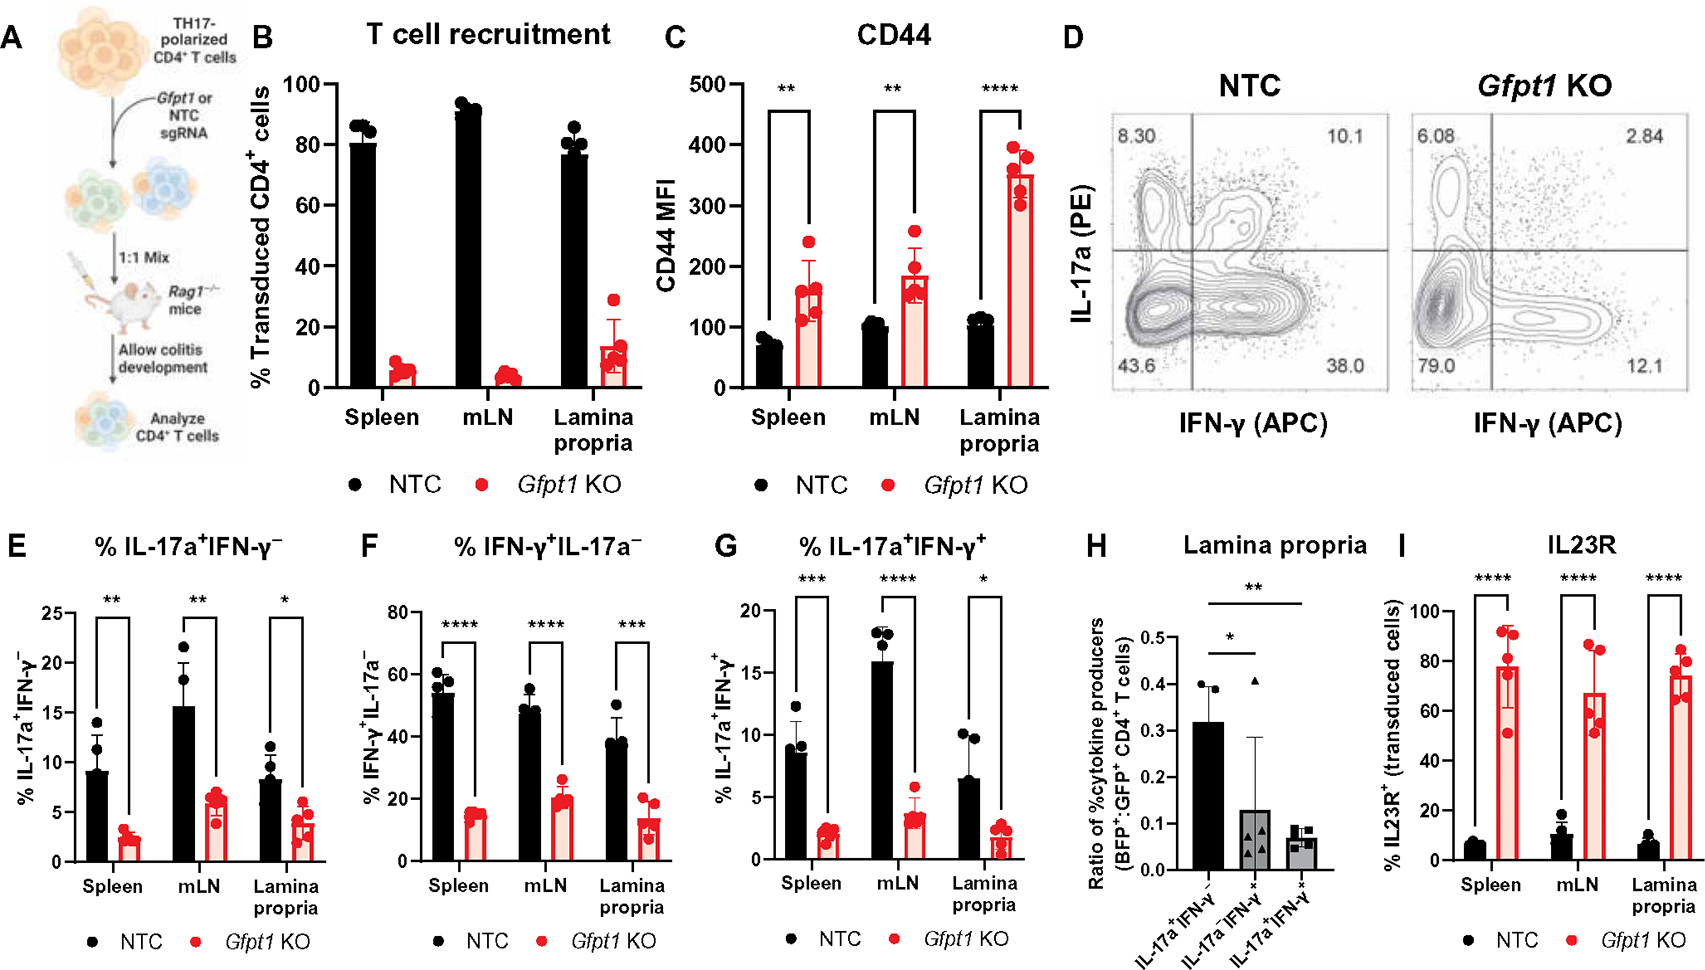
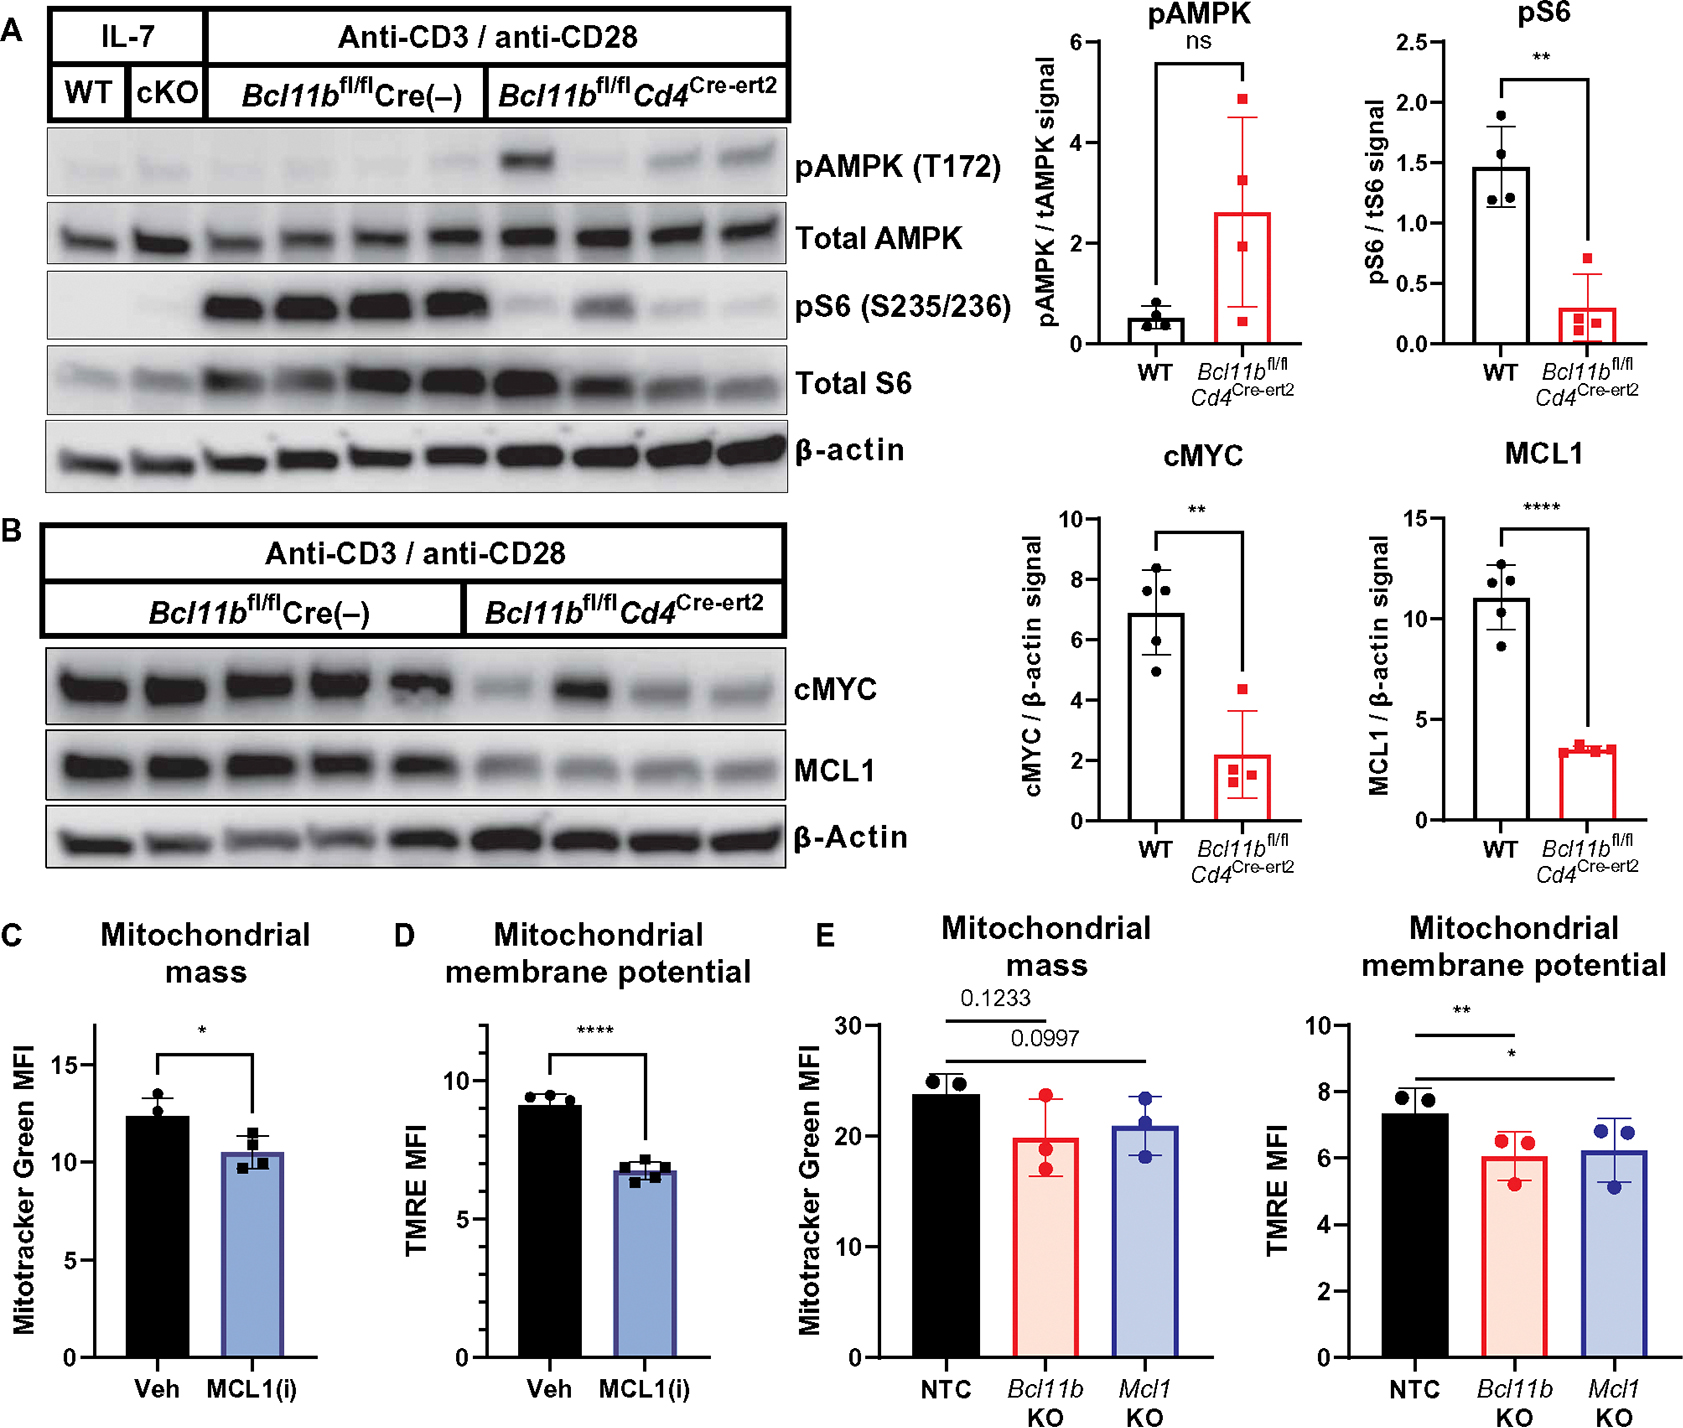
Inborn errors of metabolism (IEMs) and immunity (IEIs) are Mendelian diseases in which complex phenotypes and patient rarity have limited clinical understanding. Whereas few genes have been annotated as contributing to both IEMs and IEIs, immunometabolic demands suggested greater functional overlap. Here, CRISPR screens tested IEM genes for immunologic roles and IEI genes for metabolic effects and found considerable previously unappreciated crossover. Analysis of IEMs showed that N-linked glycosylation and the hexosamine pathway enzyme Gfpt1 are critical for T cell expansion and function. Further, T helper (TH1) cells synthesized uridine diphosphate N-acetylglucosamine more rapidly and were more impaired by Gfpt1 deficiency than TH17 cells. Screening IEI genes found that Bcl11b promotes the CD4 T cell mitochondrial activity and Mcl1 expression necessary to prevent metabolic stress. Thus, a high degree of functional overlap exists between IEM and IEI genes, and immunometabolic mechanisms may underlie a previously underappreciated intersection of these disorders.


Conflict of interest statement

Competing interests: J.C.R. is a founder, scientific advisory board member, and stockholder of Sitryx Therapeutics; a scientific advisory board member and stockholder of Caribou Biosciences; a member of the scientific advisory board of Nirogy Therapeutics; has consulted for Merck, Pfizer, and Mitobridge within the past 3 years; and has received research support from Incyte Corp., Calithera Biosciences, and Tempest Therapeutics. R.G.J. is a scientific advisory board member for Immunomet Therapeutics. The other authors declare that they have no competing interests.

Figures

Fig. 1.
Fig. 1.. Screening the inborn errors identifies immunometabolic regulators.
(A) Workflow for pooled CRISPR screens targeting the IEMs and IEIs for changes in CD4 T cell function and metabolism, respectively. (B) Overlap between the inborn errors covers a range of immunological phenotypes and metabolic pathways. (C and D) Change in sgRNA abundance over 4 days from IEI-targeted in vitro CRISPR screens after (C) IL-2–mediated expansion alone or (D) with restimulation with anti-CD3/anti-CD28. sgRNAs marked in magenta are associated with IL-2 signaling. sgRNAs in green are associated with TCR signaling. Representative of three independent experiments. (E) Comparison of sgRNA abundance samples treated 2 days with 2 mM 2-DG relative to vehicle-treated samples from a screen of IEM genes. Genes associated with the electron transport chain are marked in green (C1) or magenta (C3). (F) Overenrichment analysis significantly and trending [−log10 (P value) > 0.1] depleted genes in the 2-DG–treated sample relative to vehicle-treated cells generated using WebGestalt.
Fig. 2.
Fig. 2.. N-linked glycosylation is critical for CD4 T cell expansion in vitro and in vivo.
(A) Change in sgRNA abundance from IEM-targeted in vitro–pooled CRISPR screens after IL-2–mediated expansion. Genes associated with N-linked glycosylation are marked in red. Representative of three independent screens. (B) Overenrichment analysis of significantly and trending [−log10 (P value) > 0.1] depleted genes in (A) generated using WebGestalt. (C) Change in sgRNA abundance from IEM-targeted in vitro–pooled CRISPR screens after IL-2–mediated expansion and restimulation with anti-CD3/anti-CD28. Genes associated with N-linked glycosylation are marked in red. Representative of two independent screens. (D) Overenrichment analysis of significantly and trending [−log10 (P value) > 0.1] depleted genes in (C) generated using WebGestalt. (E) Comparison sgRNAs depleted in screens of IEM genes after expansion with IL-2 alone or expansion and restimulation with anti-CD3/anti-CD28 across all biological replicates. Numbers shown describe number of total genes depleted and (number of IEI genes depleted) at two or more independently validated screens using a cutoff of P < 0.1 for the stated conditions. (F) Schematic of in vivo screen using a model of colitis. (G) Screen for CD4 T cells isolated from the lamina propria after colitis development. Screen represents pooled populations from five mice. Genes associated with N-linked glycosylation are marked in red.
Fig. 3.
Fig. 3.. GFAT is required for T cell expansion and TH1 polarization.
(A) Expression of GFAT and Nagk in polarized CD4 T cells 3 days after activation (n = 3; means ± SD). One-way ANOVA with Šídák’s multiple comparisons test. (B) Expansion of TH1-, TH17-, and iTreg-polarized WT and Gfpt1-KO cells over 4 days after gene deletion. (C) Expression of IFN-γ and Tbet in TH1-polarized cells, (D) IL-17a and RORγt in TH17-polarized cells, and (E) Foxp3 in iTreg-polarized cells (n = 3 or 4; means ± SD). (F) Expression of CD44 in polarized WT and Gfpt1-KO cells (n = 3; means ± SD). ns, not significant. MFI, mean fluorescence intensity. Student’s unpaired two-tailed t test; *P < 0.05 and **P < 0.01.
Fig. 4.
Fig. 4.. Greater synthesis of UDP-GlcNAc in TH1 cells is reliant upon GFAT.
(A to D) TH1 and TH17 cells were stimulated 5 days before incubation with 13C6-glucose for 4 hours. Cells were lysed, and metabolites were analyzed by metabolomics. Percentage of (A) hexose phosphates, (B) glucosamine-6-P, and (C) UDP-GlcNAc labeled with glucose-derived 13C (n = 4 or 5; means ± SD). Student’s unpaired two-tailed t test comparing the amount of labeled metabolite. (D) Levels of GlcNAc-phosphate and UDP-GlcNAc in TH1- and TH17-polarized WT and Gfpt1-KO cells 8 days after activation (6 days after transduction). (n = 10; means ± SEM, two-way ANOVA with Holm–Šídák correction for multiple comparisons). Expression of (E) IFN-γ in TH1-polarized cells and (F) IL-17a in TH17-polarized cells 4 days after gene deletion. Ten millimolar GlcNAc was added to cultures during the final 2 days of incubation (n = 3; means ± SD, two-way ANOVA with Holm-Šídák correction for multiple comparisons). a.u., arbitrary units. *P < 0.05, **P < 0.01, and ***P < 0.001.
Fig. 5.
Fig. 5.. Impaired expansion of GFAT-deficient CD4 T cells during colitis.
(A) Schematic of colitis induction via cotransfer of WT and Gfpt1-KO TH17 cells into Rag1−/− mice. (B) Percentage of CD4 T cells that are either WT or Gfpt1-KOs in the spleens, mesenteric lymph nodes, or lamina propriae of mice (n = 5; means ± SD). Expression of (C) CD44 and (D to G) IL-17a and IFN-γ by transduced cells. Student’s unpaired two-tailed t test. (H) Ratio of cytokine production by Gfpt1-KO and WT cells (Gfpt1-KO:WT). One-way ANOVA with Šídák’s multiple-comparisons test. (I) Expression of IL23R by transduced cells. Representative of two independent experiments. Student’s unpaired two-tailed t test; *P < 0.05, **P < 0.01, ***P < 0.001, and ****P < 0.0001.
Fig. 6.
Fig. 6.. In vitro CD4 T cell screens identify Bcl11b as a key metabolic regulator in CD4 T cells.
(A) Schematic of CD4 T cell screen for metabolic readouts. Activated Cas9 Tg CD4 T cells were transduced with a pooled CRISPR library and expanded in IL-2. The cells were stained for metabolic readouts associated with mitochondria function or nutrient uptake, and the sgRNA abundance in the top and bottom quintile was determined. Enrichment relative to the bottom quintile indicates that a loss of that gene promotes increased signal, whereas depletion is associated with reduced signal. (B) Screen of the IEM library for effects on mitochondrial membrane potential. Genes associated with electron transport chain marked in red. (C to G) Depletion-enrichment plots of CD4 T cells transduced with the IEI library after 7 days of expansion in IL-2 and selection for the top and bottom quintiles for (C) mitochondrial mass (MTG), (D) mitochondrial membrane potential (TMRE), (E) mitochondrial ROS (MitoSOX), (F) 2-NDBG uptake, and (G) C16-BODIPY uptake.
Fig. 7.
Fig. 7.. BCL11B-deficient CD4 T cells exhibit impaired mitochondrial function.
(A) Mitochondrial mass, (B) membrane potential, and (C) reactive oxygen species in dividing CD4 T cells stimulated 3 days with anti-CD3/anti-CD28 (n = 4 to 6; means ± SD). (D) Seahorse XP Cell Mito stress test performed on WT or BCL11B-deficient CD4 T cells stimulated 3 days with anti-CD3/anti-CD28 (n = 4 or 5). (E) Basal oxygen consumption rate (OCR), (F) maximal OCR, (G) SRC, and (H) basal extracellular acidification rate (ECAR) measured in (D) (means ± SD). Student’s unpaired two-tailed t test; *P < 0.05, ***P < 0.001, and ****P < 0.0001.
Fig. 8.
Fig. 8.. BCL11B-deficient CD4 T cells are metabolically stressed with reduced expression of c-Myc and MCL1.
(A and B) Protein immunoblots of CD4 T cells from Bcl11b-KO mice or littermate controls stimulated for 3 days with anti-CD3/anti-CD28 (n = 4 or 5; mean signal relative to β-actin ± SD). Blots correspond to those in fig. S11F, and the actin blot is shared. (C and D) WT CD4 T cells stimulated for 3 days with anti-CD3/anti-CD28 followed by 2-day expansion in IL-2 ± 500 nM S63845 (MCL1 inhibitor) were evaluated for mitochondrial (C) mass and (D) membrane potential (n = 4 or 5; means ± SD, Student’s paired two-tailed t test). (E and F) Mitochondrial (E) mass and (F) membrane potential in activated CD4 T cells 5 days after transduction with sgRNAs targeting Bcl11b, Mcl1, or an NTC (n = 3; means ± SD, one-way ANOVA). *P < 0.05, **P < 0.01, ***P < 0.001, and ****P < 0.0001.

Update of

References

    1. Macintyre AN, Gerriets VA, Nichols AG, Michalek RD, Rudolph MC, Deoliveira D, Anderson SM, Abel ED, Chen BJ, Hale LP, Rathmell JC, The glucose transporter Glut1 is selectively essential for CD4 T cell activation and effector function. Cell Metab. 20, 61–72 (2014). - PMC - PubMed
    1. Sinclair LV, Howden AJM, Brenes A, Spinelli L, Hukelmann JL, Macintyre AN, Liu X, Thomson S, Taylor PM, Rathmell JC, Locasale JW, Lamond AI, Cantrell DA, Antigen receptor control of methionine metabolism in T cells. eLife 8, 1–29 (2019). - PMC - PubMed
    1. Sugiura A, Andrejeva G, Voss K, Heintzman DR, Xu X, Madden MZ, Ye X, Beier KL, Chowdhury NU, Wolf MM, Young AC, Greenwood DL, Sewell AE, Shahi SK, Freedman SN, Cameron AM, Foerch P, Bourne T, Garcia-Canaveras JC, Karijolich J, Newcomb DC, Mangalam AK, Rabinowitz JD, Rathmell JC, MTHFD2 is a metabolic checkpoint controlling effector and regulatory T cell fate and function. Immunity 55, 65–81 e69 (2022). - PMC - PubMed
    1. Johnson MO, Wolf MM, Madden MZ, Andrejeva G, Sugiura A, Contreras DC, Maseda D, Liberti MV, Paz K, Kishton RJ, Johnson ME, de Cubas AA, Wu P, Li G, Zhang Y, Newcomb DC, Wells AD, Restifo NP, Rathmell WK, Locasale JW, Davila ML, Blazar BR, Rathmell JC, Distinct regulation of Th17 and Th1 cell differentiation by glutaminase-dependent metabolism. Cell 175, 1780–1795 e19 (2018). - PMC - PubMed
    1. Gerriets VA, Kishton RJ, Nichols AG, Macintyre AN, Inoue M, Ilkayeva O, Winter PS, Liu X, Priyadharshini B, Slawinska ME, Haeberli L, Huck C, Turka LA, Wood KC, Hale LP, Smith PA, Schneider MA, MacIver NJ, Locasale JW, Newgard CB, Shinohara ML, Rathmell JC, Metabolic programming and PDHK1 control CD4+ T cell subsets and inflammation. J. Clin. Invest. 125, 194–207 (2015). - PMC - PubMed

Publication types