. 2024 Aug 16;12(8):e008665.
doi: 10.1136/jitc-2023-008665.

NR4A ablation improves mitochondrial fitness for long persistence in human CAR-T cells against solid tumors

Affiliations

NR4A ablation improves mitochondrial fitness for long persistence in human CAR-T cells against solid tumors

Kensuke Nakagawara et al. J Immunother Cancer. .

Abstract

Background: Antitumor effect of chimeric antigen receptor (CAR)-T cells against solid tumors is limited due to various factors, such as low infiltration rate, poor expansion capacity, and exhaustion of T cells within the tumor. NR4A transcription factors have been shown to play important roles in T-cell exhaustion in mice. However, the precise contribution of each NR4a factor to human T-cell differentiation remains to be clarified.

Methods: In this study, we deleted NR4A family factors, NR4A1, NR4A2, and NR4A3, in human CAR-T cells recognizing human epidermal growth factor receptor type 2 (HER2) by using the CRISPR/Cas9 system. We induced T-cell exhaustion in these cells in vitro through repeated co-culturing of CAR-T cells with Her2+A549 lung adenocarcinoma cells and evaluated cell surface markers such as memory and exhaustion phenotypes, proliferative capacity, cytokine production and metabolic activity. We validated the antitumor toxicity of NR4A1/2/3 triple knockout (TKO) CAR-T cells in vivo by transferring CAR-T cells into A549 tumor-bearing immunodeficient mice.

Results: Human NR4A-TKO CAR-T cells were resistant against exhaustion induced by repeated antigen stimulation in vitro, and maintained higher tumor-killing activity both in vitro and in vivo compared with control CAR-T cells. A comparison of the effectiveness of NR4A single, double, and TKOs demonstrated that triple KO was the most effective in avoiding exhaustion. Furthermore, a strong enhancement of antitumor effects by NR4A TKO was also observed in T cells from various donors including aged persons. Mechanistically, NR4A TKO CAR-T cells showed enhanced mitochondrial oxidative phosphorylation, therefore could persist for longer periods within the tumors.

Conclusions: NR4A factors regulate CAR-T cell persistence and stemness through mitochondrial gene expression, therefore NR4A is a highly promising target for the generation of superior CAR-T cells against solid tumors.

Keywords: Adoptive cell therapy - ACT; Chimeric antigen receptor - CAR; Lung Cancer; Solid tumor; Stem cell.


Conflict of interest statement

Competing interests: None declared.

Figures

Figure 1
Figure 1. Generation of NR4A TKO CAR-T cells and characterization before and after CAE. (A) NR4A protein expression in chimeric antigen receptor (CAR)-T cells 5 days after electroporation using western blot analysis in donor 1 (20s woman). The red-arrowed bands indicate the NR4A expression. (B) Overview of the procedure for generating NR4A triple knockout (TKO) CAR-T cells. (C) Overview of the procedure of the continuous antigen exposure (CAE) model of human epidermal growth factor receptor type 2 CAR-T cells co-cultured with A549. (D) Proliferation rate of control CAR-T cells and NR4A single (sKO), double (dKO), and TKO CAR-T cells in the CAE model. The data represents mean±SD from different three donors (one 20s woman, one 30s man, and one 40s man). (E) Expression of memory phenotype markers (CD28 and CD62L) in control CAR-T cells and NR4A sKO, dKO, and NR4A1/2/3 TKO CAR-T cells 17 days after CAE in donor 1 (20s woman). (F) Populations of CD28+/CD62L+ CAR-T cells in the control and NR4A TKO CAR-T groups. The mean fluorescence intensity (MFI) of CD62L, CCR7, and CD28 in the control CAR-T cells and NR4A sKO, dKO, and TKO CAR-T cells 17 days after CAE is shown (data are presented as the means of n=3 replicate wells). (G) Representative flow cytometry plots showing the exhaustion markers (PD-1 and TIM-3) in the control CAR-T cells and NR4A sKO, dKO, and TKO CAR-T cells co-cultured with A549 for 17 days in donor 1 (20s woman). (H) Expression and MFI of the T-cell exhaustion markers PD-1, LAG-3, TIM-3, and CD39 in the control CAR-T cells and NR4A sKO, dKO, and TKO CAR-T cells 17 days after CAE (data are presented as the means of n=3 replicate wells). The data represents mean±SD regarding the CAR-T cells from different three donors (one 20s woman, one 30s man, and one 40s man). Data are representative of at least two independent experiments. *p<0.05; **p<0.01; ns, not significant; LAG-3, lymphocyte activation gene-3; PD-1, Programmed cell Death 1; TIM-3, T-cell immunoglobulin and mucin domain 3.
Figure 2
Figure 2. Characterization of the control and NR4A TKO CAR-T cells from different donors. (A) Proliferation rate of the control (red) and NR4A TKO CAR-T cells (blue) from five different donors in the continuous antigen exposure (CAE) model. (B) Comparison of CD8+ CAR-T fractions expressing the early memory markers (CD62L+CD28+ and CCR7+CD45RA+) before (Pre) and after (Post) CAE. (C) Comparison of the exhaustion markers (PD-1+TIM3+ and PD-1+LAG3+TIM3+CD39+) expressing CD8+ CAR-T fractions before (Pre) and after (Post) CAE. (D) MFI of the indicated exhaustion markers in the control and NR4A TKO CD8+ CAR-T cells. N=5 different human donors. Data are representative of at least two independent experiments. *p<0.05; **p<0.01; ns, not significant; CAR, chimeric antigen receptor; LAG-3, lymphocyte activation gene-3; MFI, mean fluorescence intensity; PD-1, Programmed cell Death 1; TIM-3, T-cell immunoglobulin and mucin domain 3; TKO, triple knockout.
Figure 3
Figure 3. In vitro tumor cell-killing activity of the control and NR4A TKO CAR-T cells. (A) Cell division profile after antigen stimulation measured using the dilution of cell trace violet. Control or NR4A TKO CAR-T cells isolated before (Pre) and after (Post) continuous antigen exposure (CAE) were labeled with cell trace violet and then cultured with A549 cells for 3 days. The proliferation index is calculated based on the ratio of CellTrace Violet’s mean fluorescence intensity before and after stimulation. The data represents mean±SD regarding the CAR-T cells from different four donors (one 20s woman, one 30s man, one 40s man, and one 50s woman). (B) CAR-T cells isolated before (Pre) and after (Post) CAE were co-cultured with A549 cells for 24 hours. The concentration of TNF-α, IFN-γ, and IL-2 in the culture supernatant was measured using ELISA. The data represents mean±SD regarding the CAR-T cells from different four donors (one 20s woman, one 30s man, one 40s man, and one 50s woman). (C) Cytotoxicity of the control and NR4A TKO CAR-T cells before (Pre) and after (Post) CAE. Representative imaging of 549 cells stably expressing EGFP co-cultured with CAR-T cells for indicated periods are shown on the left. Real-time quantitative data of EGFP imaging using the IncuCyte system is shown on the right. Statistical analysis was performed regarding the control and NR4A TKO CAR-T cells before and after CAE with p values indicated on the graph. The data represents mean±SD regarding the CAR-T cells from different three donors (one 20s woman, one 30s man, and one 40s man). (D) Cytokine levels in the culture supernatant of the control and NR4A TKO CAR-T cells from two independent donors (one 30s man and 60s man) after (Post) CAE (data are presented as the means of n=4 replicate wells). (E) Cytotoxicity of the control and NR4A TKO CAR-T cells from two independent donors (one 30s man and 60s man) after (Post) CAE measured using the IncuCyte system. Data are representative of at least two independent experiments. *p<0.05; **p<0.01; ***p<0.001; ****p<0.0001; ns, not significant; CAR, chimeric antigen receptor; EGFP, enhanced green fluorescent protein; IFN, interferon; IL, interleukin; TKO, triple knockout; TNF, tumor necrosis factor.
Figure 4
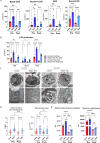
Figure 4. NR4A TKO enhanced energy production and mitochondrial fitness in CAR-T cells. (A) Metabolic rates assessed using Seahorse analysis of the basal and maximal oxygen consumption rate (OCR), spare respiratory capacity (SRC), and basal extracellular acidification rate (ECAR) of the control or NR4A TKO CAR-T cells before (Pre) or after (Post) continuous antigen exposure (CAE). Representative actual measurement figures are shown in online supplemental figure S6A, B. Data are presented as the means of n=5 replicate wells from different five donors. (B) Mitochondria-derived and glycolysis-derived ATP production rates were calculated based on changes in the OCR and ECAR, respectively. The total ATP production rate is the sum of mitochondria-derived ATP and glycolytic ATP. Data are presented as the means of n=5 replicate wells. (C) Representative electron microscopy images of T cells and mitochondria of CAR-T cells before (Pre) and after (Post) CAE. Mitochondria were indicated by the red arrows, and cristae were indicated by the blue arrows. (D) Mitochondrial area and number of cristae per mitochondria of CAR-T cells measured from electron microscopy images. (E) The mean fluorescence intensity (MFI) was measured using flow cytometry for the mitochondrial activity (MitoTracker deep red) and reactive oxygen species (MitoSOX) in control CAR-T cells and NR4A TKO CAR-T cells before (Pre) and after (Post) CAE. Data are presented as the mean±SEM of different four donors (one 20s woman, one 30s man, one 40s man, and one 50s woman). Data are representative of at least two independent experiments. *p<0.05; **p<0.01; ***p<0.001; ****p<0.0001; ns, not significant; one-way analysis of variance. CAR, chimeric antigen receptor; TKO, triple knockout.
Figure 5
Figure 5. NR4A TKO enhanced stemness-related and oxidative phosphorylation-related genes and reduced exhaustion-related genes. (A) Principal component (PC) analysis of RNA sequencing data for the control and NR4A TKO CAR-T cells 14 days after continuous antigen exposure (CAE) from three independent donors (one 30s man, one 40s man, and one 50s woman). (B) Volcano plot of differentially expressed genes in NR4A TKO CAR-T cells compared with control CAR-T cells 14 days after CAE. The average of the RNA-seq data of the CAR-T cells 14 days after CAE from three donors were analyzed. Transcripts with FDR<0.05 are highlighted in blue and red. Among them, stemness-related and exhaustion-related genes that were upregulated in NR4A TKO CAR-T cells are indicated. (C, D) Gene Ontology and Gene Set Enrichment Analysis of RNA-seq data and enrichment plot of naïve, memory, exhaustion and T-cell dysfunction associated gene of the CAR-T cells 14 days after CAE. (E) Heat map of the selected genes associated with the mitochondria, OXPHOS, memory, exhaustion, and effector of control and NR4A TKO CAR-T cells 14 days after CAE. CAR, chimeric antigen receptor; FDR, false discovery rate; NES, normalized enrichment score; NSCLC, non-small cell lung cancer; OXPHOS, oxidative phosphorylation; RNA-seq, RNA sequencing; TKO, triple knockout.
Figure 6
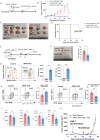
Figure 6. In vivo antitumor effects of NR4A TKO CAR-T cells. (A) Schema of the tumor cell and CAR-T cell transplantation. NSG mice were inoculated with 1.0×10⁶ A549 cells subcutaneously on the right side of their backs. Tumor growth was monitored using a digital caliper. Then, 5.0×10⁶ CD8+ CAR-T cells were injected through the tail vein 2 weeks after tumor cell transplantation. (B) Average tumor growth (n=7 mice per group). Unpaired t-test on day 40. (C) Pictures of tumors in each group on day 40. (D) Kaplan-Meier survival plots regarding the treated mice (n=10 mice per group). (E) Schema regarding the analysis of TILs. NSG mice were inoculated with 1.0×10⁶ A549 cells subcutaneously on the right side of their backs. Two weeks after tumor cell transplantation, 5.0×10⁶ CD8+ CAR-T cells were injected through the tail vein. TILs were isolated and analyzed 1 week after the administration of CAR-T cells. (F) Pictures of tumors and average tumor size in each group on day 21. Unpaired t-test. (G) Flow cytometry analysis of CD4+ and CD8+ CAR-T cells in the TILs. The numbers of CD4+ and CD8+ T cells in the control and NR4A TKO CAR-T cells are shown. The data represents the mean±SD (n=5). (H) Representative flow cytometry plots of memory markers (CD28 and CD62L) in tumor-infiltrated CD8+CAR-T cells. Quantitative data of CD28+CD62L+ population are shown on the right. (I, J) Representative flow cytometry plots of the exhaustion markers. PD-1+LAG-3+TIM-3+CD39+ population and mean fluorescence intensity (MFI) of the indicated T-cell exhaustion markers in CD8+ CAR-T cells infiltrating the tumors on day 21. (K) Average tumor growth (n=5 mice per group) in the rechallenge model. Arrows on day 14 indicate administration of NR4A TKO CAR-T cells and arrows on day 42 indicate rechallenge of A549 cells. The data represents the mean±SD (n=5). The experiment was performed twice with CAR T cells generated from two different healthy donors (one 20s woman and one 30s man). *p<0.05; **p<0.01; CAR, chimeric antigen receptor; i.v., intravenous; s.c., subcutaneous; TIL, tumor-infiltrating lymphocyte; TKO, triple knockout.

Similar articles

Cited by

References

    1. Maude SL, Frey N, Shaw PA, et al. Chimeric antigen receptor T cells for sustained remissions in leukemia. N Engl J Med. 2014;371:1507–17. - PMC - PubMed
    1. Ahmed N, Brawley VS, Hegde M, et al. Human epidermal growth factor receptor 2 (HER2) -specific chimeric antigen receptor-modified T cells for the immunotherapy of HER2-positive sarcoma. J Clin Oncol. 2015;33:1688–96. doi: 10.1200/JCO.2014.58.0225. - DOI - PMC - PubMed
    1. Martinez M, Moon EK. CAR T cells for solid tumors: new strategies for finding, infiltrating, and surviving in the tumor microenvironment. Front Immunol. 2019;10:128. doi: 10.3389/fimmu.2019.00128. - DOI - PMC - PubMed
    1. Drent E, Themeli M, Poels R, et al. A rational strategy for reducing on-target off-tumor effects of CD38-chimeric antigen receptors by affinity optimization. Mol Ther. 2017;25:1946–58. doi: 10.1016/j.ymthe.2017.04.024. - DOI - PMC - PubMed
    1. Spranger S, Bao R, Gajewski TF. Melanoma-intrinsic β-catenin signalling prevents anti-tumour immunity. Nature. 2015;523:231–5. doi: 10.1038/nature14404. - DOI - PubMed

MeSH terms

Substances