. 2024 Sep 18;44(38):e2011222024.
doi: 10.1523/JNEUROSCI.2011-22.2024.

Experience Dependence of Alpha Rhythms and Neural Dynamics in the Mouse Visual Cortex

Affiliations

Experience Dependence of Alpha Rhythms and Neural Dynamics in the Mouse Visual Cortex

Pouria Riyahi et al. J Neurosci. .

Abstract

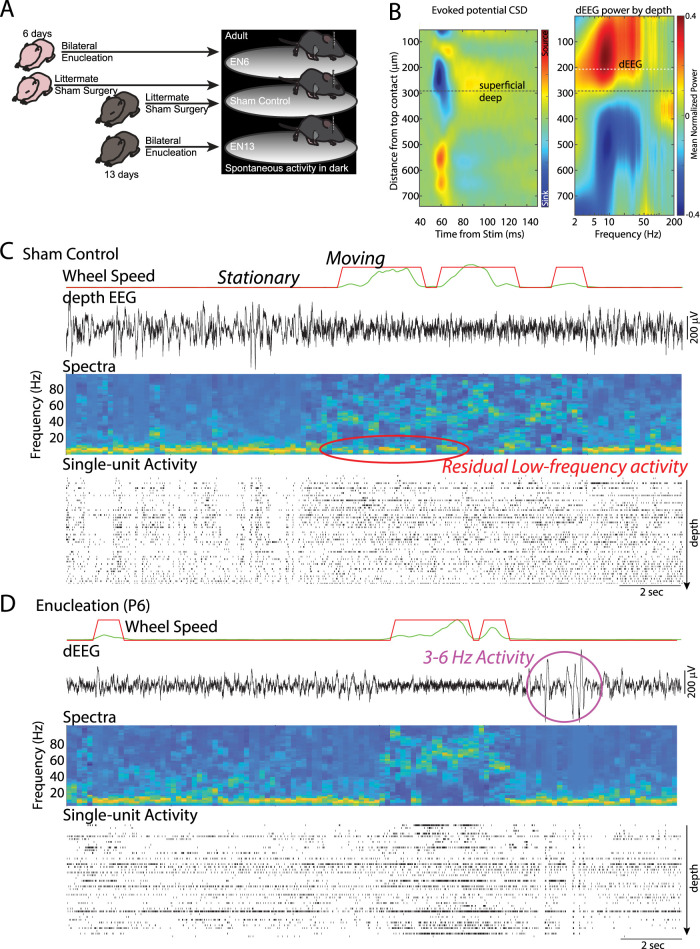
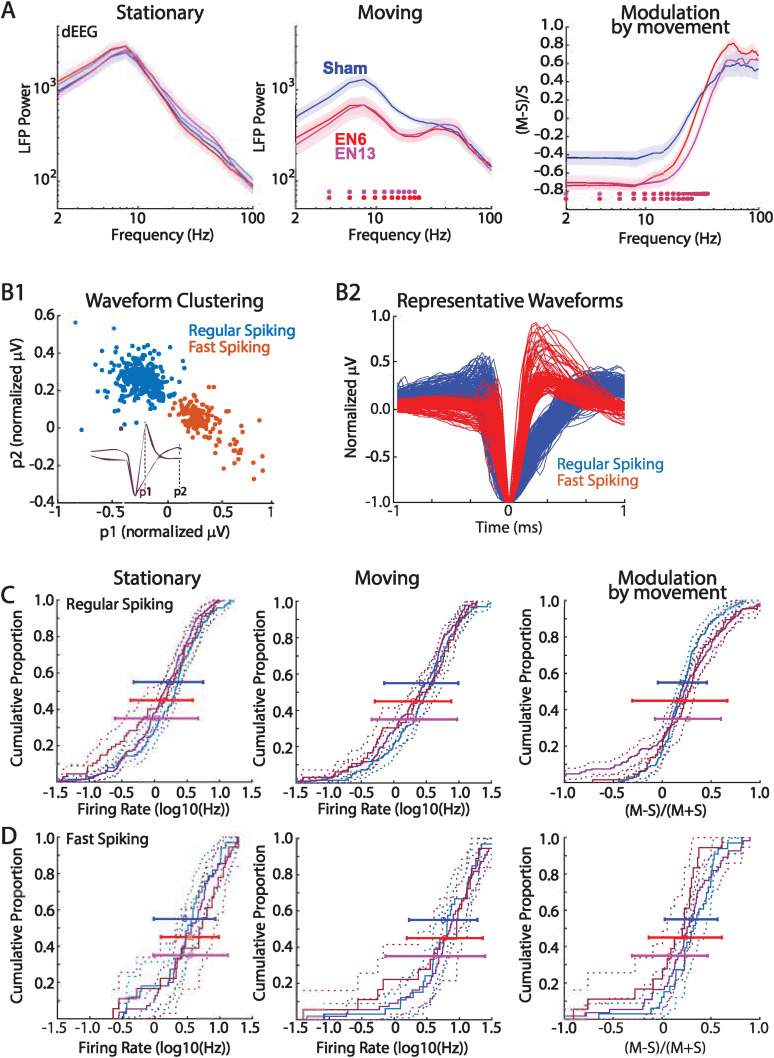
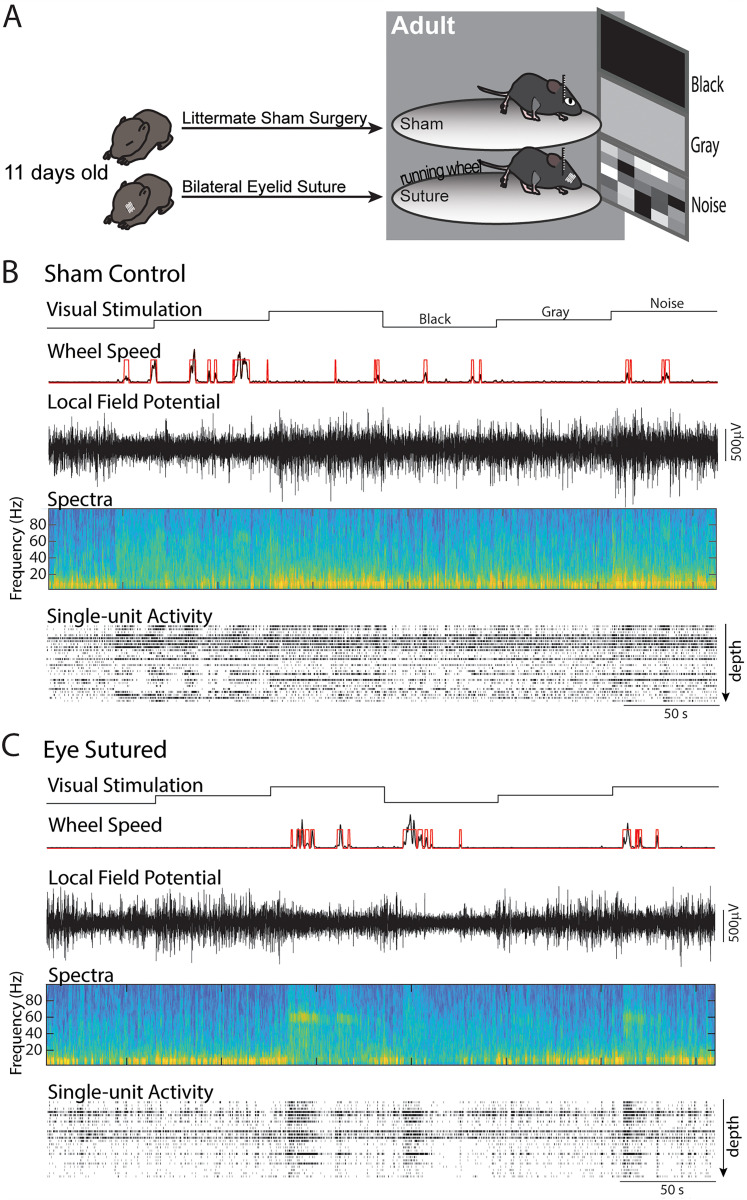
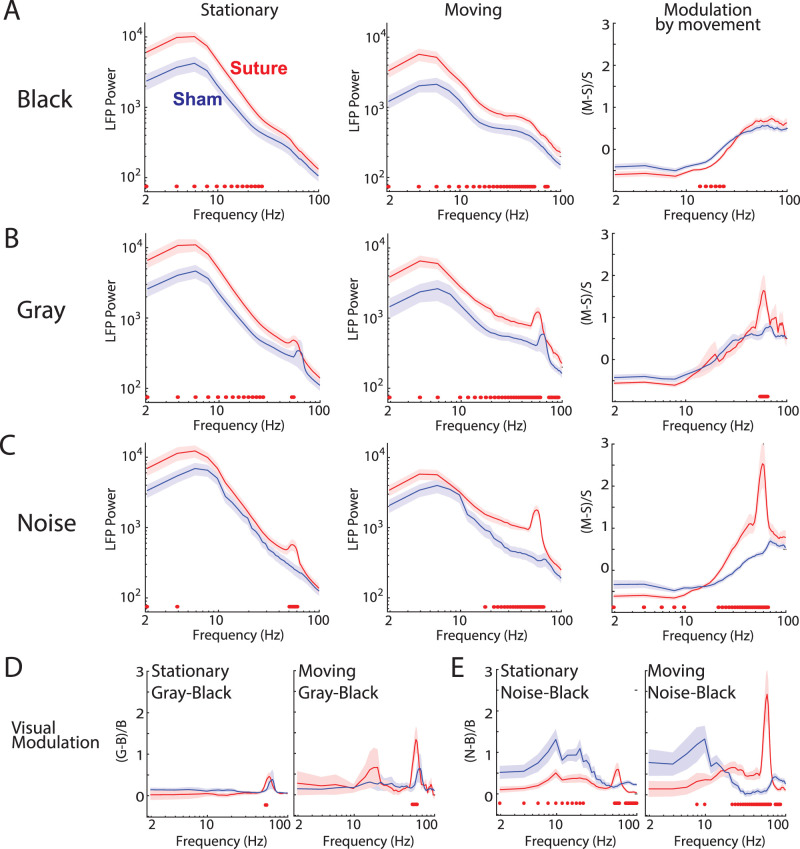
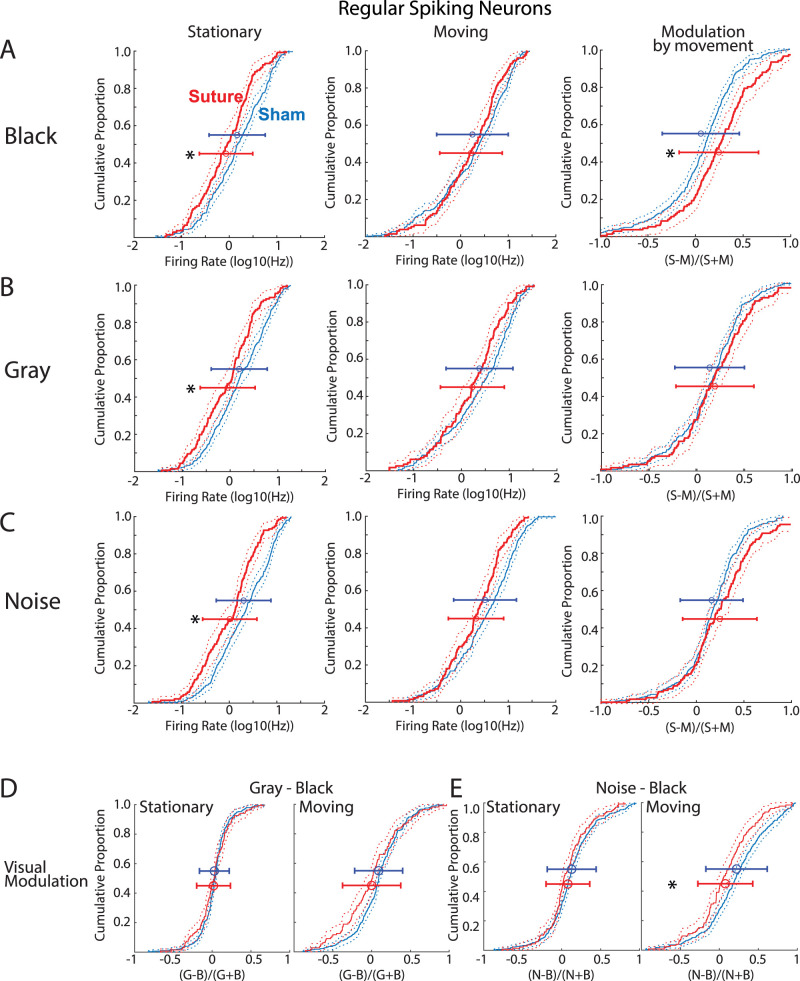
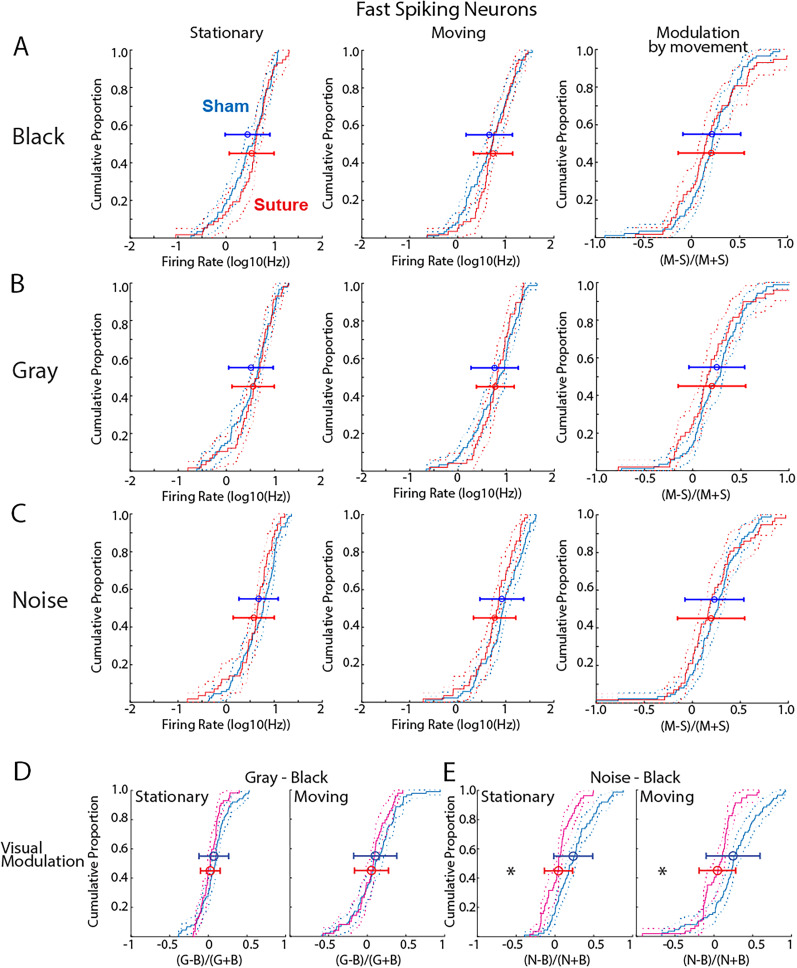
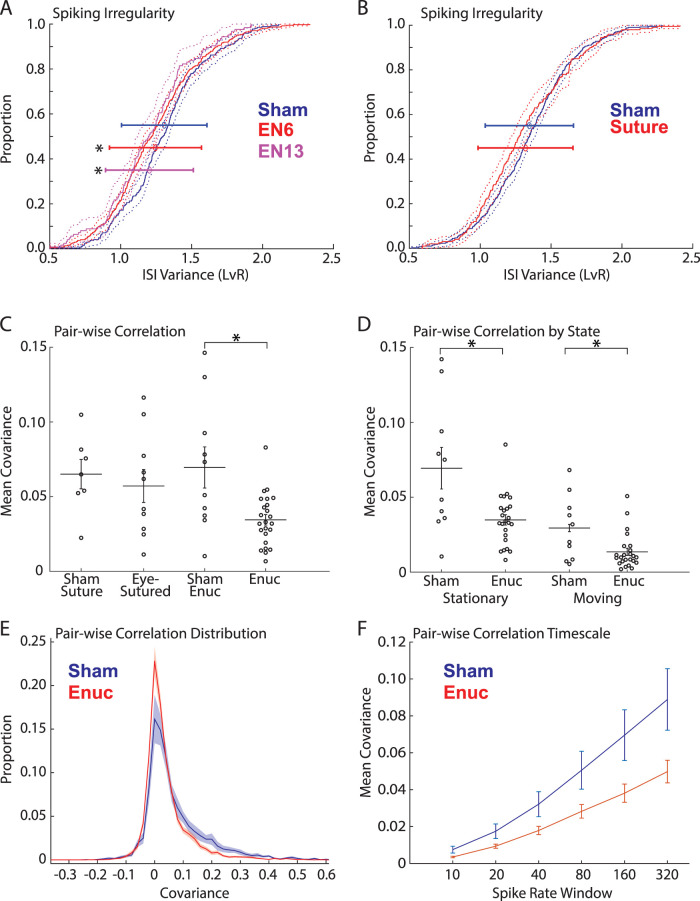
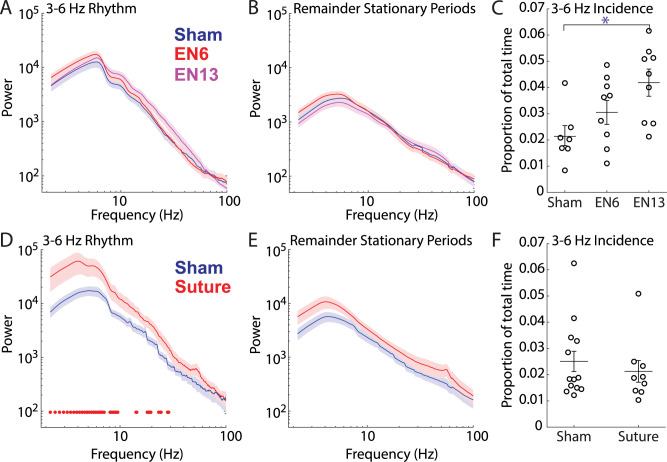
The role of experience in the development and maintenance of emergent network properties such as cortical oscillations and states is poorly understood. To define how early-life experience affects cortical dynamics in the visual cortex of adult, head-fixed mice, we examined the effects of two forms of blindness initiated before eye opening and continuing through recording: (1) bilateral loss of retinal input (enucleation) and (2) degradation of visual input (eyelid suture). Neither form of deprivation fundamentally altered the state-dependent regulation of firing rates or local field potentials. However, each deprivation caused unique changes in network behavior. Laminar analysis revealed two different generative mechanisms for low-frequency synchronization: one prevalent during movement and the other during quiet wakefulness. The former was absent in enucleated mice, suggesting a mouse homolog of human alpha oscillations. In addition, neurons in enucleated animals were less correlated and fired more regularly, but no change in mean firing rate. Eyelid suture decreased firing rates during quiet wakefulness, but not during movement, with no effect on neural correlations or regularity. Sutured animals showed a broadband increase in depth EEG power and an increased occurrence, but reduced central frequency, of narrowband gamma oscillations. The complementary-rather than additive-effects of lid suture and enucleation suggest that the development of emergent network properties does not require vision but is plastic to modified input. Our results suggest a complex interaction of internal set points and experience determines mature cortical activity, with low-frequency synchronization being particularly susceptible to early deprivation.

Keywords: alpha; arousal; blindness; gamma; oscillations; vision.


Conflict of interest statement

The authors declare no competing financial interests.

Figures

Figure 1.
Figure 1.
Effect of bilateral enucleation on cortical dynamics. A, Experimental design. Mouse pups underwent bilateral enucleation at 6 d old (EN6), before the development of continuous background activity and adult-like cortical states, or at 13 d old (EN13), before eye opening but after the initial emergence of background cortical activity and states (Shen and Colonnese, 2016; Riyahi et al., 2021). Littermates of each group received sham surgery and were recorded on interleaved days. Activity in the monocular visual cortex was recorded in adult head-fixed, awake animals that were allowed free movement on a circular treadmill in the dark. B, Laminar identification. Left: current source density of the mean flash-evoked response in a sham animal; Right: mean-normalized depth spectra of spontaneous activity in the dark from the same animal. Separation between superficial (L1–4) and deep (L5–6) was determined as the transition point between high and low 5–20 Hz power. This corresponded to the bottom of the early evoked potential in sighted animals and the band of high-frequency (100 Hz+) power in Layer 5 present in most animals. The depth EEG (dEEG) for each animal was calculated from the best electrode 100–200 superficial to the dividing line. C, Representative recording from sham control littermate. Aligned time courses show running disk velocity (green) and binarized threshold (red) dividing session into stationary and moving periods; local field potential (dEEG) from Layer 4, spectral decomposition of dEEG signal on log (power) color scale; and raster plot of isolated single-unit firing arranged from the surface at the top to Layer 5 below. Red circle marks periods of residual low-frequency activity during moving periods which were observed to be absent in the enucleated animals. D, Representative recording from EN6 animal. Note qualitatively similar network dynamics including a decrease in EEG and unit synchronization and concomitant increase in firing during movement periods, while low-frequency activity is reduced during movement. Purple circle shows periods of large-amplitude “3–6 Hz oscillations” that occurred more frequently in the enucleated groups.
Figure 2.
Figure 2.
Effect of bilateral enucleation on EEG power and firing rates. A, Population mean and standard deviation for dEEG power for sham (blue), P6 enucleated (EN6; red) and P13 enucleated (EN13; purple). Power during periods of stationary (left) and moving (middle) periods and the proportional change during movement (modulation by movement, right) are shown, with frequencies of significant difference (permutation test) from sham shown by color-coded dot for each experimental group. B, Separation by neuron type. B1, Scatterplot of all sham and EN single units for the two waveform metrics used. Assignment following clustering is shown by color, blue for RS and red for FS. Insert shows example waveforms for each type and the time-points for two metrics. B2, Representative waveforms (50 ea) for FS- and RS-assigned clusters. C, Cumulative distribution of single-unit firing rates for RS (presumptive excitatory) neurons during stationary and moving periods and for the modulation by movement. Solid lines show distribution and dotted lines the associated 95% confidence interval. Error bars show population mean and standard deviation for all neurons. Firing rates were not significantly different for any group (Table 1). D, Cumulative distribution for FS (presumptive inhibitory) neuron firing rates.
Figure 3.
Figure 3.
Effect of bilateral eyelid suture on cortical dynamics. A, Experimental design. Mouse pups underwent bilateral eyelid suture before natural eye opening. Control littermates underwent sham surgery and were recorded on alternating days. Activity in the monocular visual cortex was recorded in adult head-fixed, awake animals that were allowed free movement on a circular treadmill, while alternating blocks of visual stimuli were presented to the contralateral eye. Visual stimuli consisted of 1 min blocks of a “black” screen (full darkness), “gray” screen,” or isoluminant “noise” stimuli of changing luminance blocks. B, Representative recording from a sham-sutured animal across two rounds of stimulation. C, Representative recording from eye-sutured littermate. Note qualitative similarity in state regulation between sham and sutured animals, including desynchronization of dEEG and increased firing during movement. Also note the increased narrowband gamma generated by this eye-sutured animal during noise stimulation that was amplified by movement.
Figure 4.
Figure 4.
Effect of bilateral eyelid suture on EEG dynamics. A, Population mean and standard deviation of dEEG frequency power during black screen segments for stationary (left) and moving (middle) periods. On the right, proportional change in power during movement is graphed. Frequencies statistically different between groups are marked by red dots near the x-axis. B, As for A but for gray stimulus. C, As for A but noise stimulus. D, Frequency power change by gray (relative to black) stimulation for each movement condition. Frequencies statistically different between groups are marked by red dots near the x-axis. E, Frequency power change by noise (relative to black) stimulation for each movement condition.
Figure 5.
Figure 5.
Effect of bilateral eyelid suture on RS neuron firing rates. A, Cumulative distribution histogram of RS neuron firing rates during black screen segments for stationary (left) and moving (middle) periods. Change in firing rate by movement is shown in the right column. Solid lines show distribution and dotted lines the 95% confidence interval. Mean and standard deviation of each distribution are shown by the error bars. Significant difference (ANOVA post hoc) between groups is shown by asterisk. B, As for A but during gray stimulus. C, As for A but during noise stimulus. D, Cumulative distribution of firing rate modulation by gray stimulus (relative to black), divided by the behavioral state. E, Cumulative distribution of firing rate modulation by noise stimulus (relative to black), divided by the behavioral state. See Table 2 for associated data.
Figure 6.
Figure 6.
Effect of bilateral eyelid suture on FS neuron firing rates. A, Cumulative distribution histogram of FS neuron firing rates during black screen segments for stationary (left) and moving (middle) periods. Change in firing rate by movement is shown in the right column. Solid lines show distribution and dotted lines the 95% confidence interval. Mean and standard deviation of each distribution are shown by the error bars. Significant difference (ANOVA post hoc) between groups is shown by asterisk. B, As for A but during gray stimulus. C, As for A but during noise stimulus. D, Cumulative distribution of firing rate modulation by gray stimulus (relative to black), divided by the behavioral state. E, Cumulative distribution of firing rate modulation by noise stimulus (relative to black), divided by the behavioral state. See Table 3 for associated data.
Figure 7.
Figure 7.
Effect of enucleation and eyelid suture on higher-order firing behavior. A, Cumulative distributions of spiking irregularity for the enucleation experiment. LvR is a normalized measure of ISI that is not affected by firing rate (Shinomoto et al., 2009); higher LvR indicates less regular firing. Solid lines show distribution, and dotted lines 95% confidence interval. Error bars show mean and standard deviation for each group. Significant difference from the sham group (ANOVA post hoc) is shown by asterisk. B, Cumulative distributions of spiking irregularity for the suturing experiment (both groups in the dark). C, Animal mean pairwise spike rate covariance for both experiments. Mean and standard deviation are shown along with each animal mean covariance measured for a 160 ms window. Asterisk shows significant difference from group control by ANOVA post hoc. Both P6 and P13 enucleation groups were pooled. D, Population mean pairwise spike rate for enucleated groups for stationary and moving periods separately (160 ms window). Asterisk shows significant difference from group control by ANOVA post hoc. Reduced correlations caused by enucleation are present for both moving and stationary periods. E, Distribution of pairwise correlations for all neurons (160 ms window). Mean and standard deviation (shaded region) shown. F, Mean pairwise correlation by window size.
Figure 8.
Figure 8.
Effect of enucleation and eyelid suture on the 3–6 Hz rhythm. A, dEEG frequency power for isolated periods of 3–6 Hz rhythm for the enucleation experiments. Population mean and standard deviation (shaded regions) are shown. No significant differences were observed for any frequency. B, dEEG power for the remainder of stationary periods after removal of 3–6 Hz periods. C, Proportion of time spent in 3–6 Hz rhythm for each animal and the population mean and standard deviation. Significant difference (ANOVA post hoc) is shown by asterisk. D–F, As for A–C with the suture experiment recorded in the dark. Red dots near the x-axis in D show significant differences between specific frequencies.
Figure 9.
Figure 9.
Dissociation of “alpha” components in sham and enucleated animals. A, LFP traces through the depth of V1 from representative animals. Left column in each group: a single low-frequency event isolated from the 3–6 Hz period (top) and moving period (bottom). The raw trace is red, and the 2–12 Hz-filtered dEEG trace used to isolate and analyze low-frequency events is blue. Right column: the mean traces for events from this animal during each period. Note prominent positive surface peaks and negative deep trough observed during 3–6 Hz but not moving periods for the sham animal, while the enucleated animal has these peaks in both states. B, Quantification of low-frequency events identified from negative potentials in L4 (B1,3,5,6) or positive potentials in L1 (B2,4,7) during 3–6 Hz periods, quiescent periods without 3–6 Hz oscillations (still), and moving periods. Population means (n = 10 sham blue, 16 enucleated red) for event amplitude (left) and incidence (middle). For this and all graphs, the asterisk denotes the difference between groups for each state; # denotes the difference from the 3–6 Hz period for that group. Incidence (B3,4) but not amplitude (B1,2) of events is significantly lower during still and move periods in enucleated animals compared with sham, suggesting a reduced number of low-frequency events underlie the reduced frequency power in moving enucleated animals. B5–7, Correlation of amplitude in each layer for each isolated event. Correlation analysis shows that the LFP amplitudes in L1, 4, and 6 become more correlated during movement in sham animals. This is not observed, however, for enucleated animals, as L4 remains anticorrelated to L1 and L4 and L6 do not increase their correlation, suggesting that enucleated animals lose an event type present during movement in sham animals. C, Representative example of the field–field cross-correlation for each state (C1). Asterisk marks the L1 channel used as the target. C2, Population means of the difference in the time of peak negativity between adjacent layers on the cross correlogram (“correlation skew”). Sham animals show strong skew for the 3–6 Hz activity, indicating a spreading wave during these events that is absent during movement. Enucleated animals show similar skew during both periods suggesting similar activity patterns. D, Analysis of field-spike correlation. D1, Representative heat-map of the correlation of multiunit firing rate to 2–12 Hz LFP for each period. The LFP layer used for correlation is shown by an asterisk (L1 top, L4 mid, L6 bottom). D2, Population means of the mean zero-phase field-spike correlation coefficients measured across all layers. Sham animals have different relationships between fields and spikes during 3–6 Hz periods and moving periods, while enucleated animals largely maintain the 3–6 Hz relationship during moving periods.

Similar articles

References

    1. Adrian ED, Matthew BHC (1934) The Berger rhythm: potential changes from the occipital lobes in man. Brrain 57:355–385. 10.1093/brain/57.4.355 - DOI
    1. Alamia A, Terral L, D'ambra MR, VanRullen R (2023) Distinct roles of forward and backward alpha-band waves in spatial visual attention. eLife 12:e85035. 10.7554/eLife.85035 - DOI - PMC - PubMed
    1. Bollimunta A, Chen Y, Schroeder CE, Ding M (2008) Neuronal mechanisms of cortical alpha oscillations in awake-behaving macaques. J Neurosci 28:9976–9988. 10.1523/JNEUROSCI.2699-08.2008 - DOI - PMC - PubMed
    1. Bottari D, Troje NF, Ley P, Hense M, Kekunnaya R, Röder B (2016) Sight restoration after congenital blindness does not reinstate alpha oscillatory activity in humans. Sci Rep 6:24683. 10.1038/srep24683 - DOI - PMC - PubMed
    1. Brainard DH (1997) The psychophysics toolbox. Spat Vis 10:433–436. 10.1163/156856897X00357 - DOI - PubMed

LinkOut - more resources