

Population size, HIV prevalence, and antiretroviral therapy coverage among key populations in sub-Saharan Africa: collation and synthesis of survey data, 2010-23
- PMID: 39151976
- PMCID: PMC11345451
- DOI: 10.1016/S2214-109X(24)00236-5
Population size, HIV prevalence, and antiretroviral therapy coverage among key populations in sub-Saharan Africa: collation and synthesis of survey data, 2010-23
Abstract
Background: Key population HIV programmes in sub-Saharan Africa require epidemiological information to ensure equitable and universal access to effective services. We aimed to consolidate and harmonise survey data among female sex workers, men who have sex with men, people who inject drugs, and transgender people to estimate key population size, HIV prevalence, and antiretroviral therapy (ART) coverage for countries in mainland sub-Saharan Africa.
Methods: Key population size estimates, HIV prevalence, and ART coverage data from 39 sub-Saharan Africa countries between 2010 and 2023 were collated from existing databases and verified against source documents. We used Bayesian mixed-effects spatial regression to model urban key population size estimates as a proportion of the gender-matched, year-matched, and area-matched population aged 15-49 years. We modelled subnational key population HIV prevalence and ART coverage with age-matched, gender-matched, year-matched, and province-matched total population estimates as predictors.
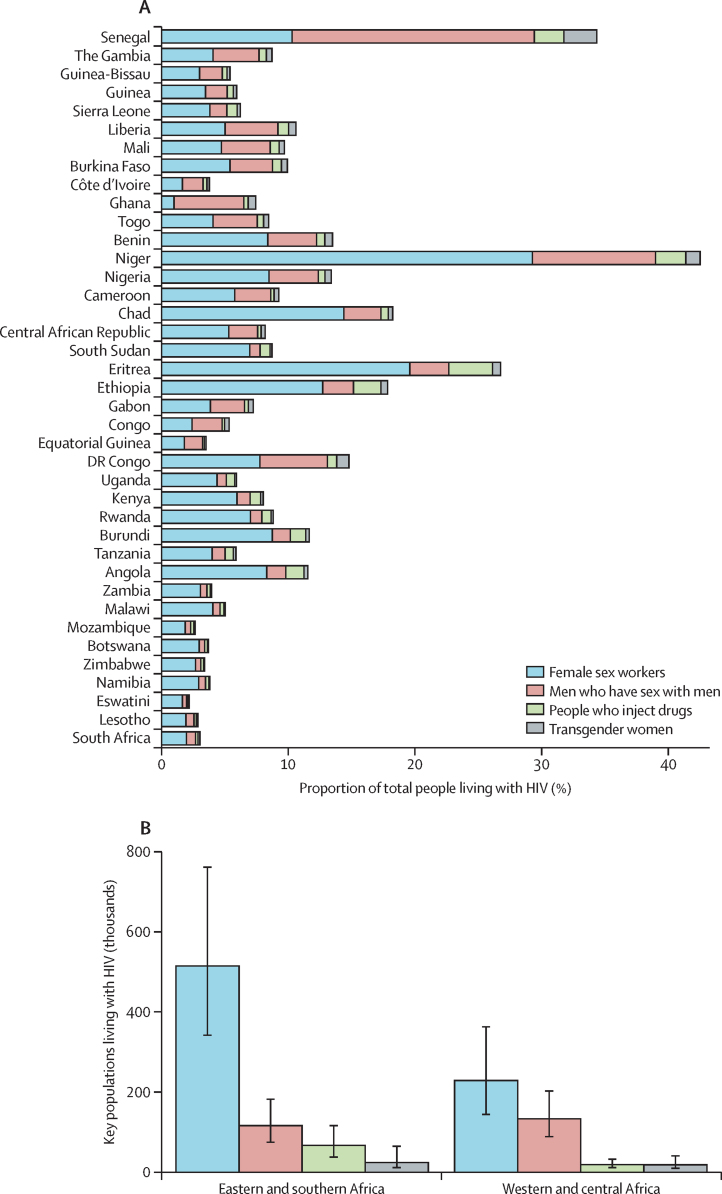
Findings: We extracted 2065 key population size data points, 1183 HIV prevalence data points, and 259 ART coverage data points. Across national urban populations, a median of 1·65% (IQR 1·35-1·91) of adult cisgender women were female sex workers, 0·89% (0·77-0·95) were men who have sex with men, 0·32% (0·31-0·34) were men who injected drugs, and 0·10% (0·06-0·12) were women who were transgender. HIV prevalence among key populations was, on average, four to six times higher than matched total population prevalence, and ART coverage was correlated with, but lower than, the total population ART coverage with wide heterogeneity in relative ART coverage across studies. Across sub-Saharan Africa, key populations were estimated as comprising 1·2% (95% credible interval 0·9-1·6) of the total population aged 15-49 years but 6·1% (4·5-8·2) of people living with HIV.
Interpretation: Key populations in sub-Saharan Africa experience higher HIV prevalence and lower ART coverage, underscoring the need for focused prevention and treatment services. In 2024, limited data availability and heterogeneity constrain precise estimates for programming and monitoring trends. Strengthening key population surveys and routine data within national HIV strategic information systems would support more precise estimates.
Funding: UNAIDS, Bill & Melinda Gates Foundation, and US National Institutes of Health.
Copyright © 2024 The Author(s). Published by Elsevier Ltd. This is an Open Access article under the CC BY 4.0 license. Published by Elsevier Ltd.. All rights reserved.
Conflict of interest statement
Declaration of interests SB has received funding from the US National Institutes of Health (NIH). FC has received funding from the Wellcome Trust, the Medical Research Council, NIH, Unitaid, and the Bill & Melinda Gates Foundation. LD has received untied educational grants for the study of new opioid medications in Australia from Indivior and Sequirus. EF has received funding from the UK Research and Innovation Medical Research Council, the Royal Society, and the Centre for Sexual Health and HIV/AIDS Research Zimbabwe. JWI-E acknowledges funding from UNAIDS, NIH, the Gates Foundation, UK Research and Innovation, and BAO Systems, and has received support to attend meetings from UNAIDS, the South African Centre for Epidemiological Modelling and Analysis, the International AIDS Society, and the Gates Foundation. KR and MM-G have received support to attend meetings from UNAIDS. JS has received funding from UNAIDS. OS has received funding from UNAIDS. All other authors declare no competing interests.
Figures


References
-
- UNAIDS The Gap Report. 2014. https://www.unaids.org/en/resources/documents/2014/20140716_UNAIDS_gap_r...
-
- WHO Consolidated guidelines on HIV, viral hepatitis and STI prevention, diagnosis, treatment and care for key populations. 2014. http://apps.who.int/iris/bitstream/10665/128048/1/9789241507431_eng.pdf?... - PubMed
-
- UN Global AIDS strategy 2021–2026—end inequalities. End AIDS. 2021. https://www.unaids.org/en/resources/documents/2021/2021-2026-global-AIDS...
-
- Baneshi MR, Rastegari A, Haghdoost AA. Advances in experimental medicine and biology. Springer; 2021. Review of size estimation methods; pp. 1–15. - PubMed
MeSH terms
Substances
Grants and funding
LinkOut - more resources
Full Text Sources
Medical
