. 2024 Sep 20;34(8):1224-1234.
doi: 10.1101/gr.278601.123.

Allele-specific transcription factor binding across human brain regions offers mechanistic insight into eQTLs

Affiliations

Allele-specific transcription factor binding across human brain regions offers mechanistic insight into eQTLs

Ashlyn G Anderson et al. Genome Res. .

Abstract

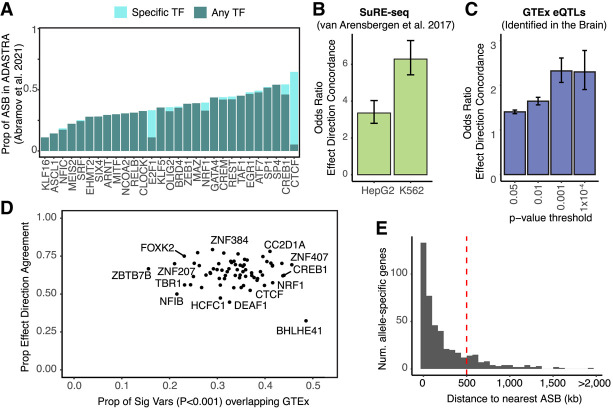
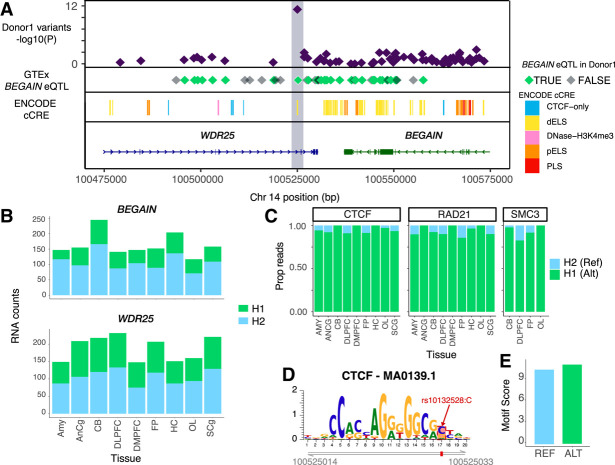
Transcription factors (TFs) regulate gene expression by facilitating or disrupting the formation of transcription initiation machinery at particular genomic loci. Because TF occupancy is driven in part by recognition of DNA sequence, genetic variation can influence TF-DNA associations and gene regulation. To identify variants that impact TF binding in human brain tissues, we assessed allele-specific binding (ASB) at heterozygous variants for 94 TFs in nine brain regions from two donors. Leveraging graph genomes constructed from phased genomic sequence data, we compared ChIP-seq signals between alleles at heterozygous variants within each brain region and identified thousands of variants exhibiting ASB for at least one TF. ASB reproducibility was measured by comparisons between independent experiments both within and between donors. We found that rare alleles in the general population more frequently led to reduced TF binding, whereas common alleles had an equal likelihood of increasing or decreasing binding. Further, for ASB variants in predicted binding motifs, the favored allele tended to be the one with the stronger expected motif match, but this concordance was not observed within highly occupied sites. We also found that neuron-specific cis-regulatory elements (cCREs), in contrast with oligodendrocyte-specific cCREs, showed depletion of ASB variants. We identified 2670 ASB variants associated with evidence for allele-specific gene expression in the brain from GTEx data and observed increasing eQTL effect direction concordance as ASB significance increases. These results provide a valuable and unique resource for mechanistic analysis of cis-regulatory variation in human brain tissue.


Figures

Figure 1.
Figure 1.
Overview of experimental design and allele-specific binding (ASB). (A) Workflow for detection of ASB. Whole-genome sequencing and ChIP-seq of 94 TFs were performed in postmortem brain samples from two donors. ChIP-seq reads were mapped to personalized graph genomes and tested for ASB across donors and tissues. Abbreviations denote the following: (DLPFC) dorsolateral prefrontal cortex, (FP) frontal pole, (OL) occipital lobe, (CB) cerebellum, (AnCg) anterior cingulate, (SCg) subgenual cingulate, (DMPFC) dorsomedial prefrontal cortex, (Amy) amygdala, and (HC) hippocampus. (B) Density plot showing the distribution of reference allele frequency at heterozygous variants for different P-value thresholds. (C) The number of total phased variants, heterozygous variants, significant variants (P < 0.05), and significant variants (P < 0.001) for both donors. “Shared” indicates variants that are shared and pass filters in both donors. (D) Within-donor reproducibility. The fraction of ASB events that preferred the same allele across brain regions at increasing P-value threshold. (E) Between-donor reproducibility. The fraction of ASB events that favored the same allele when comparing the same TF–allele interaction between donors.
Figure 2.
Figure 2.
Genetic and genomic properties of ASB variants. (A) Stacked bar plots showing the fraction of regions which overlap a particular cCRE annotation for all heterozygous variants (top), ASB variants (middle), and all TF peaks (bottom). Red indicates promoter-like signal (PLS); orange, proximal enhancer-like signal (pELS); yellow, distal enhancer-like signal (dELS); blue, CTCF-only; pink, DNase-H3K4me3; and gray, non-cCRE regions. (B) Bar plot showing the proportion of ASB variants (P < 0.001) favoring the ancestral and derived allele and the degree of the allele preference [log2(Anc. count + 1/Der. count + 1)] for varying ranges of AAF. (C) For varying ranges of AAF (x-axis), we show the fraction of ASB variants found in each P-value range (y-axis). (D) The log2 fold enrichment (FE) for variants with a GERP-score > 4. The background for each TF is the nonsignificant heterozygous variants with a read depth greater than 11 for the corresponding TF. Only TFs with a chi-squared P-value < 0.01 are shown. (E) For each TF, the proportion of ASB variants that significantly alter a JASPAR motif (motifbreakR P-value < 0.0001) versus the maximum motif score for the PFM. Dashed line indicates the best fit line. (F) The proportion of ASB events that agree with the direction of the motif change in HOT sites versus non-HOT sites.
Figure 3.
Figure 3.
Neural-specific effects of ASB. (A) Correlation of ASB effects across brain regions for variants with a P-value < 0.001 in at least one brain region. (Top) Correlation of significance [−log10(P-value)]. (Bottom) Correlation of effect size (percentage of reads mapping to the reference allele [% REF]). (B) Dot plot showing PC2 and PC3 from a PCA of the −log10(P-values) for all variants with a P-value < 0.001 in at least one brain region. Color denotes the brain region. Shape denotes if the TF is CTCF/RAD21 or another TF in the data set. (C) Distribution of the percentage of peaks containing an ASB by TF. Dashed line indicates the average percentage. Only TFs with at least 15,000 peaks are shown. (D) Enrichment for ASB variants in cell type–specific snATAC-seq peaks. Neuron indicates that the peak was called in excitatory-only, inhibitory-only, or excitatory and inhibitory neurons. Shared peaks were identified in two or more cell types, excluding those shared between neuronal cell types. (E) Results from LDSC measuring heritability of ASB with GWAS traits grouped by disease type. Heatmap indicates coefficient Z-score from sLDSC. Feature-trait combinations with a Z-score significantly larger than zero (one-sided Z-test, P < 0.01) are indicated with a numeric value reporting the enrichment score. Abbreviations denote the following: (SCZ) schizophrenia, (BIP) bipolar disorder, (MMD) major depression disorder, (ASD) autism spectrum disorder, (ADHD) attention deficit hyperactivity disorder, (ALS) amyotrophic lateral sclerosis, (PD) Parkinson's disease, (AD) Alzheimer's disease, (SLE) systemic lupus erythematosus, (MS) multiple sclerosis, (RA) rheumatoid arthritis, (IBD) inflammatory bowel disease, (BMI) body mass index.
Figure 4.
Figure 4.
Functional characterization of ASB variants. (A) Proportion of ASB variants that overlap an ASB variant in ADASTRA for TFs profiled in both studies. (Light teal) Overlap occurs between the same TF between the studies; (dark teal) overlap occurs between different TFs. (B) Enrichment for effect direction concordance (i.e., increase in binding corresponds with increase in regulatory activity) with SuRE-seq data in K562 and HepG2 cells. Error bars indicate the 95% CI. (C) The odds ratio of effect direction concordance for GTEx eQTLs found in the brain and overlapping a significant ASB variant for various ASB P-value thresholds. Error bars indicate the 95% CI. (D) For each TF, the proportion of ASB variants that overlap an eQTL versus the proportion of those variants that agree on effect direction. (E) Histogram showing the distribution of distances from the TSS of an allele-specific gene to the closest ASB variant.
Figure 5.
Figure 5.
ASB analysis assists with fine-mapping eQTLs. (A) Genomic tracks for the 100 kb region surrounding rs10132528. (First) Maximum −log10(P-value) of all TFs for heterozygous variants in Donor1. (Second) GTEx eQTLs for BEGAIN colored by overlap with heterozygous variants in Donor1. (Third) ENCODE cCREs. (Fourth) Gene annotations from Ensembl v86. (B) Stacked bar plots showing the number of RNA reads supporting haplotype1 or haplotype2 for BEGAIN (top) and WDR25 (bottom). (C) The proportion of ChIP-seq reads for CTCF (left), RAD21 (middle), and SMC3 (right) supporting the reference and alternate allele for each brain region where the TF was profiled. (D) Position of the JASPAR CTCF motif on Chr 14 with the position of ASB variant indicated in red. (E) MotifbreakR score for the reference and alternate allele for rs10132528.

Update of

References

    1. Abramov S, Boytsov A, Bykova D, Penzar DD, Yevshin I, Kolmykov SK, Fridman MV, Favorov AV, Vorontsov IE, Baulin E, et al. 2021. Landscape of allele-specific transcription factor binding in the human genome. Nat Commun 12: 2751. 10.1038/s41467-021-23007-0 - DOI - PMC - PubMed
    1. Andersen BB, Korbo L, Pakkenberg B. 1992. A quantitative study of the human cerebellum with unbiased stereological techniques. J Comp Neurol 326: 549–560. 10.1002/cne.903260405 - DOI - PubMed
    1. Anderson AG, Rogers BB, Loupe JM, Rodriguez-Nunez I, Roberts SC, White LM, Brazell JN, Bunney WE, Bunney BG, Watson SJ, et al. 2023. Single nucleus multiomics identifies ZEB1 and MAFB as candidate regulators of Alzheimer's disease-specific cis-regulatory elements. Cell Genomics 3: 100263. 10.1016/j.xgen.2023.100263 - DOI - PMC - PubMed
    1. Bailey TL, Johnson J, Grant CE, Noble WS. 2015. The MEME suite. Nucleic Acids Res 43: W39–W49. 10.1093/nar/gkv416 - DOI - PMC - PubMed
    1. Behrens S, Vingron M. 2010. Studying the evolution of promoter sequences: a waiting time problem. J Comput Biol 17: 1591–1606. 10.1089/cmb.2010.0084 - DOI - PMC - PubMed

Substances

LinkOut - more resources