. 2024 Aug 16;15(1):7059.
doi: 10.1038/s41467-024-51009-1.

Semaphorin heterodimerization in cis regulates membrane targeting and neocortical wiring

Affiliations

Semaphorin heterodimerization in cis regulates membrane targeting and neocortical wiring

Paraskevi Bessa et al. Nat Commun. .

Abstract

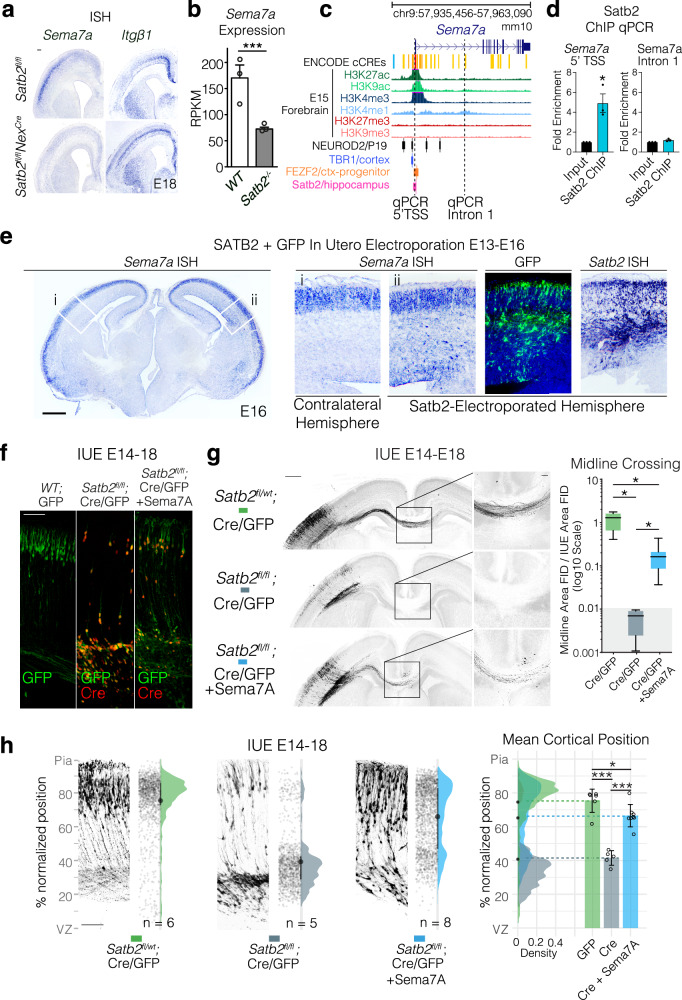
Disruption of neocortical circuitry and architecture in humans causes numerous neurodevelopmental disorders. Neocortical cytoarchitecture is orchestrated by various transcription factors such as Satb2 that control target genes during strict time windows. In humans, mutations of SATB2 cause SATB2 Associated Syndrome (SAS), a multisymptomatic syndrome involving epilepsy, intellectual disability, speech delay, and craniofacial defects. Here we show that Satb2 controls neuronal migration and callosal axonal outgrowth during murine neocortical development by inducing the expression of the GPI-anchored protein, Semaphorin 7A (Sema7A). We find that Sema7A exerts this biological activity by heterodimerizing in cis with the transmembrane semaphorin, Sema4D. We could also observe that heterodimerization with Sema7A promotes targeting of Sema4D to the plasma membrane in vitro. Finally, we report an epilepsy-associated de novo mutation in Sema4D (Q497P) that inhibits normal glycosylation and plasma membrane localization of Sema4D-associated complexes. These results suggest that neuronal use of semaphorins during neocortical development is heteromeric, and a greater signaling complexity exists than was previously thought.


Conflict of interest statement

The authors declare no competing interests.

Figures

Fig. 1
Fig. 1. Semaphorin7A is downstream of Satb2 and can restore migration and axon projection in Satb2 deficient neurons.
a In situ hybridization (ISH) of Sema7A and Itgβ1 expression in the Satb2 cortex, scale bar is 100μm. b Sema7A expression quantified as Reads Per Kilobase per Million mapped reads (RPKM), mean±SEM from ncortices WT = 3, Satb2KO = 3. DESeq2 q = 0.005283 (dataset from GSE68912). c UCSC genome browser view of Sema7A gene locus with annotation tracks: ENCODE cis-regulatory elements (cCREs), Histone ChIPseq from embryonic forebrain and ReMap ChIPseq tracks for NeuroD2, Tbr1 and Fezf2, and Satb2-V5 Hippocampal ChIPseq. d Satb2 ChIP-qPCR fold enrichment (mean±SEM) of 5’TSS and Intron 1 Sema7A, ncortices WT = 3, Satb2fl/flNexCre = 3. Unpaired t-test, 5’TSS; p = 0.0139, Intron 1; p = 0.656. e E16 wild-type brains electroporated at E13 with full-length Satb2 full-length cDNA and GFP show ectopic expression of Sema7A RNA at the electroporation site. Scale bar 500 µm. f Overexpression of Sema7A into Satb2-deficient neurons restores migration cell autonomously. Immunostaining with GFP and Cre in wild type and Satb2fl/fl cortices after IUE with GFP (left), Cre/GFP (middle) and Cre/GFP +Sema7A (right). Scale bar is 100μm. g Re-expression of Sema7A in Satb2 deficient cells partially rescues midline projections cell autonomously. In utero electroporations (IUE) into E14 embryos collected at E18 are shown with midline magnifications. In all conditions pNeuroD1-Cre + pCAG-FSF-GFP is abbreviated to Cre/GFP. Midline crossing was quantified by normalizing GFP Fluorescent Integrated Density (FID) at the midline to the FID of the electroporated area. Box and whisker plots represent whiskers as min-max with bounds of box at lower and upper quartiles and center at the median (right). nbrains GFP = 5, Cre = 4, Cre + Sema7A = 8. Brown-Forsythe ANOVA with Dunnett’s T3 multiple comparison test; GFP vs Cre padjusted = 0.0197, GFP vs Cre + Sema7A padjusted = 0.0357, Cre vs Cre+Sema7A padjusted = 0.0161. Gray-ed out area at base of plot signifies measurements in this area are likely at the level of noise due to the complete absence of GFP fibers in Cre condition. Scale bar in the panoramic picture is 500μm, magnification is 100μm. h Satb2 negative cells migrate into the cortical plate after Sema7A re-expression. Adjacent to example electroporation images, are raw data points corresponding to all cell positions, a half-violin showing the total cell distribution across nbrains in that condition, where mean (point) and interquartile range (line) are plotted between raw data points and the half-violin. Cell distributions for the different conditions are shown overlaid on the right with mean cortical position per nbrains, along with the mean of means ±SD. One way ANOVA with Tukey’s multiple comparisons. GFP vs Cre padjusted < 0.0001, GFP vs Cre+Sema7A padjusted = 0.0460, Cre vs Cre+Sema7A padjusted < 0.0001. Scalebar at the bottom of GFP IUE = 100 μm. For simplicity, figures denote p < 0.05 as *; p < 0.01 as **; and p < 0.001 as ***. All source data are provided in the Source Data file.
Fig. 2
Fig. 2. Sema7A restores the polarization and axon outgrowth in Satb2-deficient neurons also in vitro.
a Examples of WT, Satb2 deficient, and Sema7A rescue conditions in E14 primary cortical neurons after 2 days in vitro (DIV2). b After 4 days in vitro (DIV4), axons can be identified in all conditions by their enrichment of TAU-1 and depletion of MAP2. Scale bar = 50 μm. c Box & whisker plots (whiskers: min, max, box spanning the interquartile range, and center line at median) of neuronal morphology at DIV2 (left column) and DIV 4 (right column). Data were non-normally distributed (D’Agostino & Pearson, Shapiro-Wilk tests). For all tests, Kruskal–Wallis test followed by Dunn’s Multiple comparison was used, where adjusted p values < 0.001 = ***, <0.01 = **, <0.05 = *. DIV2 longest neurite nneurons WT = 48, Satb2−/− = 54, Satb2−/− + Sema7A n = 37; DIV2 nneurons primary/end neurites WT = 40, Satb2−/− = 39, Satb2−/− + Sema7A = 37. DIV4 axon length nneurons WT = 20, Satb2 −/− = 39, Satb2−/− + Sema7A = 37. DIV4 nneurons primary/end neurites WT = 21, Satb2−/− = 39, Satb2−/− + Sema7A = 37. A full list of p values can be found in Supplementary Data S2. d Loss of Satb2 is associated with a random distribution of the centrosome which can be restored by Sema7A. (Top row): Representative images of DIV2 primary cortical neurons stained with the golgi marker Gm130 and centrosomal marker Cdk5rap2 (scale bar 25μm). Radar plots depict the circularized histograms of angle counts, where 360 degrees are binned in 30-degree increments. Measured blind, the polarity angle was measured using a standardized 100 × 100 pixel cross placed with the parallel axis centered in the process and the perpendicular axis touching the Golgi. Data were non-normally distributed (D’Agostino & Pearson, Shapiro–Wilk tests). Kruskal Wallis test followed by Dunn’s Multiple comparison padjusted GFP vs Cre <0.0001, padjusted GFP vs Cre + Sema7A = 0.0026, padjusted Cre vs Cre + Sema7A = 0.0794. nneurons WT = 35, Satb2−/− = 25, Satb2−/− + Sema7A = 35. For simplicity, panels denote p < 0.05 as *; p < 0.01 as **; and p < 0.001 as ***. All source data are provided in the Source Data file.
Fig. 3
Fig. 3. Semaphorin 7A Domains associated with membrane localization and dimerization are required for migration and axon outgrowth.
a Schematic of Sema7A domains and deletion mutants. The scheme shows all currently annotated domains of Sema7A and depicts the deletion constructs generated. Sema domain is depicted in purple, the Plexin-Semaphorin-Integrin (PSI) domain in pink, the immunoglobulin domain (IG) in yellow and the Glycosyl-Phosphatidyl-Inositol (GPI) membrane anchor is depicted in orange. The Arginine-Glycine-Aspartic acid (RGD) reported to be important for Integrin binding was mutated to Lysine-Cysteine-Glutamic Acid (KCE) and is depicted as a red star. b Panoramas of Satb2fl/fl IUE brains with the indicated Sema7A deletion constructs together with pCAG-FSF-GFP and pNeuroD1-Cre and midline magnifications and quantifications. Full Length Sema7A panorama is reproduced here from Fig. 1 for comparison. Midline crossing is quantified as described in Fig. 1. Box and whisker plot whiskers as min-max with box bounds at lower and upper quartiles and center line on the median. Grey-ed out area at base of plot signifies measurements in this area are likely at the level of noise due to the complete absence of GFP fibers in Cre only condition (Fig. 1). Brown-Forsythe ANOVA with Dunnett’s T3 multiple comparisons test. padjusted Sema7A vs ΔSEMA = 0.0457, padjusted Sema7A vs ΔMEM = 0.0416, padjusted Sema7A vs KCE = 0.0342. nbrains Cre + Sema7A (from Fig. 1) = 8, nbrains Cre + Sema7A-ΔSEMA = 3, nbrains Cre + Sema7A-ΔPSI = 4, nbrains Cre + Sema7A-ΔIG = 4, nbrains Cre + Sema7A-ΔMEM = 6, nbrains Cre + Sema7A-KCE = 3. Scale bar in panoramic picture is 500 μm, while scale bar in midline magnification is 100 μm. c Sema7A deletion mutant migration profiles from E14-18 IUEs, presented in the same format described in Fig. 1. Cre + Full length Sema7A is reproduced here from Fig. 1 for comparison. Scalebar bottom left of Cre+Sema7A IUE is 100μm. (Right): Cell distributions for the different conditions are shown overlaid on the right with mean cortical position per nbrains, along with the mean of means ±SD. One way ANOVA with Dunnett’s multiple comparisons test. padjusted Sema7A vs ΔSEMA = 0.0001, padjusted Sema7A vs ΔMEM < 0.0001, padjusted Sema7A vs KCE = 0.0493. nbrains Cre + Sema7A (from Fig. 1) = 8, nbrains Cre + Sema7A-ΔSEMA = 3, nbrains Cre + Sema7A-ΔPSI = 4, nbrains Cre + Sema7A-ΔIG = 4, nbrains Cre + Sema7A-ΔMEM = 6, nbrains Cre + Sema7A-KCE = 4. For simplicity, panels denote p < 0.05 as *; p < 0.01 as **; and p < 0.001 as ***. All source data are provided in the Source Data file.
Fig. 4
Fig. 4. Sema4D binds with high affinity to Sema7A.
a Sema7A binds to Sema4D and Sema6A. HEK293T cells transfected with the GFP-tagged Sema7A (this paper) and the indicated Myc-tagged Sema family members: N-Myc-Sema4D (addgene # 51599, ~120 kDa), N-myc-Sema5A (~65 kDa), and N-myc-Sema6A (~120/130 kDa). b In Situ Hybridization (ISH) at E15 in wild-type mouse cortex shows the expression of both Semaphorins in the cortical plate. Scale bar= 100μm. c Co-IP of Sema4D-flag from myc-Sema4D:Sema4D-flag homodimers in the presence of increasing concentrations of HA-tagged Sema7A in HEK cells. One way ANOVA with Dunnett’s multiple comparison test. padjusted Sema4D only vs 1.0 μg Sema7A = 0.0068, padjusted Sema4D only vs 1.5 μg Sema7A = 0.0003. nbio.replicates = 3. d Computational modeling of structural alignment of Sema4D:Sema7A heterodimer using published crystal structures. e Co-immunoprecipitation of HA-Sema7A using sp-myc-Sema4D in HEK cells. f Endogenous Co-immunoprecipitation of Sema7A using anti-Sema4D antibody from mouse cortex. gl Localization and distribution of Sema4D-Sema7A complexes in primary cortical neurons. Primary E14 neurons transfected with sp-Myc-Sema4D, HA-Sema7A, and GFP were fixed at DIV2 and DIV4 and subcellular localization of semaphorin complexes determined by Proximity Ligation Assay (PLA). GFP signal (cell fill) can be seen in cyan, Sema4D-Sema7A PLA signal in yellow, and MAP2 in magenta. Scale bars in (gl) are 10μm. For simplicity, panels denote p < 0.05 as *; p < 0.01 as **; and p < 0.001 as ***. All source data are provided in the Source Data file.
Fig. 5
Fig. 5. The Cytoplasmic Domain of Sema4D is required for cell-autonomous migration and axon outgrowth.
a Simultaneous downregulation of Semaphorin 4D by shRNA reverses Semaphorin 7A rescue of neuronal migration in Satb2-deficient neurons. Neuronal migration profiles from E14-18 IUEs, presented in the same format described in Fig. 1. GFP, Cre and Cre + Sema7A are reproduced from Fig. 1 here for comparison. Scalebar in the bottom of GFP IUE is 100μm. Cell distributions for the different conditions are shown overlaid on the right with mean cortical position per nbrains, along with the mean of means ±SD. One way ANOVA with Tukey’s multiple comparisons test. GFP vs Cre padjusted < 0.0001, GFP vs Cre+Sema7A padjusted = 0.0604, GFP vs Cre+Sema7A+shSema4D padjusted < 0.0001, Cre vs Cre+Sema7A padjusted < 0.0001, Cre vs Cre+Sema7A+shSema4D padjusted = 0.9816, Cre+Sema7A vs Cre+Sema7A+shSema4D padjusted < 0.0001. b Quantification of midline crossing after simultaneous downregulation of Semaphorin 4D in Sema7A-rescued Satb2-deficient neurons. GFP, Cre and Cre+Sema7A images and data are reproduced from Fig. 1. Brown-Forsythe ANOVA with Dunnett’s T3 multiple comparisons test. GFP vs Cre padjusted = 0.0328, GFP vs Cre+Sema7A padjusted = 0.0589, GFP vs Cre+Sema7A+shSema4D padjusted = 0.0326, Cre vs Cre+Sema7A padjusted = 0.0292, Cre vs Cre+Sema7A+shSema4D padjusted = 0.9592, Cre+Sema7A vs Cre+Sema7A+shSema4D padjusted = 0.0277. Migration nbrains GFP = 6, Cre = 5, Cre + Sema7A = 8, Cre + Sema7A+ shSema4D = 4. c shows Cre+Sema7A+shSema4D midline panorama example. Panorama scalebar = 500μm, magnification scalebar = 100μm. d Midline panoramas of Sema4D and Sema7A shRNA electroporations and magnifications. Control scrambled shRNA (shScr), shRNA against Sema4D, shRNA against Sema4D + Sema4D cDNA (Sema4D Overexpression, OE), or shRNA against Sema4D plus a version of Sema4D cDNA lacking the intracellular domain -IC (Sema4D-ΔIC) were introduced into the cerebral cortex at E14 and axons crossing the midline were observed at E18. Scale bar in panoramas is 500 μm, while scale bar in midline magnification is 100 μm. e Quantification of midline crossing of shRNA electroporations. Kruskal-Wallis with Dunn’s multiple comparison test. scrambled shRNA (shScr) vs shSema7A padjusted = 0.0404, shScr vs shSema4D padjusted = 0.0253, shScr vs shSema4D+Sema4D OE padjusted = 0.6127, shScr vs shSema4D + Sema4D-ΔIC padjusted = 0.0017. In box and whisker plots (b, e) whiskers represent min-max with box bounds at lower and upper quartiles and center line at the median. Midline nbrains GFP = 5, Cre = 4, Cre + Sema7A = 8, Cre + Sema7A + shSema4D = 4, shScr = 5, shSema7A = 4, shSema4D = 4, shSema4D + Sema4D OE = 7, shSema4D + Sema4D-ΔIC = 4. f Neuronal migration profiles of after downregulation of Sema4D from E14-18 IUEs, presented in the same format described in Fig. 1. Scalebar in the bottom of shScr IUE is 100μm. Representative electroporations are shown adjacent to raw data points and half violin plots of the total distribution with mean of means±SD cortical position on the right. One way ANOVA with Tukey’s multiple comparisons. scScr vs shSema7A padjusted = 0.0069, scScr vs shSema4D padjusted < 0.0001, shScr vs shSema4D+Sema4D OE padjusted = 0.8358, shScr vs shSema4D+Sema4D-ΔIC padjusted = 0.001, shSema4D vs shSema4D + Sema4D OE padjusted < 0.0001, shSema4D vs shSema4D+Sema4D-ΔIC padjusted = 0.3605, shSema4D-Sema4D OE vs shSema4D+Sema4D-ΔIC padjusted = 0.0115. Migration nbrains shScr = 8, shSema4D = 8, shSema7A = 4, shSema4D + Sema4D OE = 6, shSema4D + Sema4D-ΔIC = 3. For simplicity, panels denote p < 0.05 as *; p < 0.01 as **; and p < 0.001 as ***. All source data are provided in the Source Data file.
Fig. 6
Fig. 6. Human Sema4D-497P Mutation retains homo and heterodimerization ability but is improperly processed.
a Schematic of adenosine to cytosine base mutation giving rise to a glutamine ‘Q’ to proline ‘P’ substitution at codon 497 between SEMA and PSI domains. b Ribbon diagrams and zooms of human SEMA4D solved crystal structure (PDB ID: 1OLZ, top) with alphafold2 predictions of wildtype SEMA4D (middle) and SEMA4D with 497P mutation (bottom). Codon 497 is highlighted red, glycosylation residues magenta, phosphorylation residues yellow, and ubiquitination residues ochre. A beta sheet parallel to codon 497 (dotted ellipse) is not predicted to form following 497P mutation. c Co-immunoprecipitation of signal peptide -myc-tagged human SEMA4D (sp-myc-SEMA4D) and the 497P variant (sp-myc-SEMA4D-Q497P) confirms that the mutant form can still form homodimers with sp-flag-hSema4D and heterodimers with mouse HA-Sema7A. While SEMA4D produces bands at ~150 kDa and ~120 kDa, the SEMA4D-Q497P variant predominantly generates the 120 kDa band. d De-glycosylation assay of sp-myc-SEMA4D and sp-myc-SEMA4D-Q497P using O-Glycosidase, Endo H and PNGase F. The same blot is shown at short and long exposures.
Fig. 7
Fig. 7. 497 P Mutation abolishes localization of SEMA4D and Sema7A to the cell surface and growth cones and reduces neuronal migration and axon projection in vivo.
a Surface biotinylation followed by avidin pull down of human sp-myc-SEMA4D (abbr. hS4D) or human sp-myc-SEMA4D-497P (abbr. hS4D-497P) in the presence or absence of mouse HA-Sema7A (abbr. mS7A). Cell Surface to INtracellular (CS/IN) ratio of Sema4D was calculated by first normalizing each fraction to all Sema4D detected in whole cell lysate (WCL) where the complete calculation is CS/IN = (CS/WCL)/(IN/WCL). Plotted is mean+SD, using n = 3 separate experiments. Repeated measures ANOVA with Tukey’s multiple comparison’s. SEMA4D vs SEMA4D + Sema7A padjusted = 0.0061, SEMA4D+Sema7A vs SEMA4D-497P padjusted = 0.0008, SEMA4D + Sema7A vs SEMA4D-497P + Sema7A padjusted = 0.0007. b Proximity Ligation Assay (PLA) detecting interaction between mouse HA-Sema7A and human sp-myc-SEMA4D or human sp-myc-Sema4D-497P. Scalebar = 10μm. c Midline panoramas and quantifications of human SEMA4D + GFP and SEMA4D-497P + GFP in utero electroporations. Two-tailed t-test with Welch’s correction, SEMA4D vs SEMA4D-497P p = 0.0345. nbrains SEMA4D = 4, SEMA4D-497P = 4. Box and whisker plot whiskers as min-max with box bounds at lower and upper quartiles and center line at the median. Scale bar in panoramas is 500 μm, while scale bar in midline magnification is 100 μm. d Neuronal migration profiles following in utero electroporation with SEMA4D or SEMA4D-497P, presented in the same format described in Fig. 1. Scalebar at bottom of SEMA4D IUE is 100μm. Representative electroporations are shown adjacent to raw data points and half violin plots of the total distribution of neurons across all brains with mean of means±SD cortical position on the right. Two-tailed t test, SEMA4D vs SEMA4D-497P p < 0.0001. nbrains SEMA4D n = 6, SEMA4D-497P n = 7. e Graphical model depicting general findings that Sema7A expression is regulated by Satb2, which promotes surface localization of Sema4D:Sema7A heterodimers (left). Upon deletion of Satb2 (middle), decreased Sema7A expression means heterodimerization with Sema4D is less able to occur, which coincides with deficits in axon extension and neuronal migration. Similarly, the Sema4D 497P mutation (right), which affects normal glycosylation and trafficking of Sema4D to the plasma membrane, results in deficits in neuronal migration and axon extension. For simplicity, panels denote p < 0.05 as *; p < 0.01 as **; and p < 0.001 as ***. All source data are provided in the Source Data file.

References

    1. Stouffer, M. A., Golden, J. A. & Francis, F. Neuronal migration disorders: focus on the cytoskeleton and epilepsy. Neurobiol. Dis.92, 18–45 (2016). - PMC - PubMed
    1. Pan, Y.-H., Wu, N. & Yuan, X.-B. Toward a Better Understanding of neuronal migration deficits in autism spectrum disorders. Front. Cell Dev. Biol.7 (2019). - PMC - PubMed
    1. Barnes, A. P. & Polleux, F. Establishment of axon-dendrite polarity in developing neurons. Annu. Rev. Neurosci.32, 347–381 (2009). - PMC - PubMed
    1. Bradke, F. & Dotti, C. G. Establishment of neuronal polarity: lessons from cultured hippocampal neurons. Curr. Opin. Neurobiol.10, 574–581 (2000). 10.1016/S0959-4388(00)00124-0 - DOI - PubMed
    1. Epifanova, E. et al. Adhesion dynamics in the neocortex determine the start of migration and the post-migratory orientation of neurons. Sci. Adv.7, eabf1973 (2021). 10.1126/sciadv.abf1973 - DOI - PMC - PubMed

MeSH terms

LinkOut - more resources