. 2024 Aug 16;15(1):7069.
doi: 10.1038/s41467-024-50809-9.

Genome-wide variation study and inter-tissue communication analysis unveil regulatory mechanisms of egg-laying performance in chickens

Affiliations

Genome-wide variation study and inter-tissue communication analysis unveil regulatory mechanisms of egg-laying performance in chickens

Dandan Wang et al. Nat Commun. .

Abstract

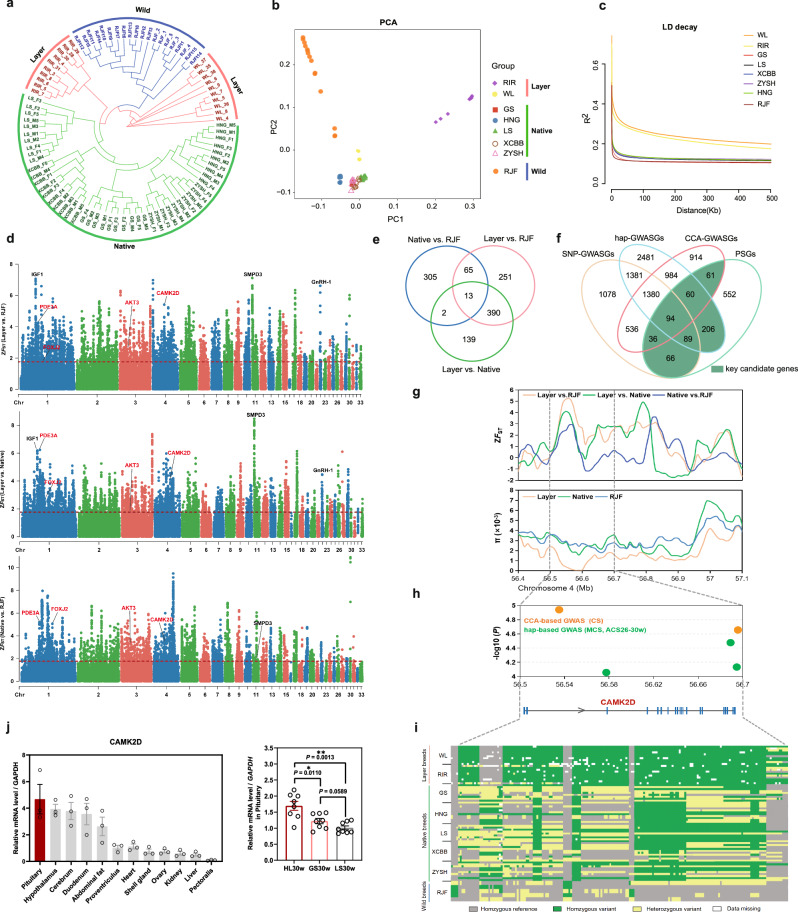
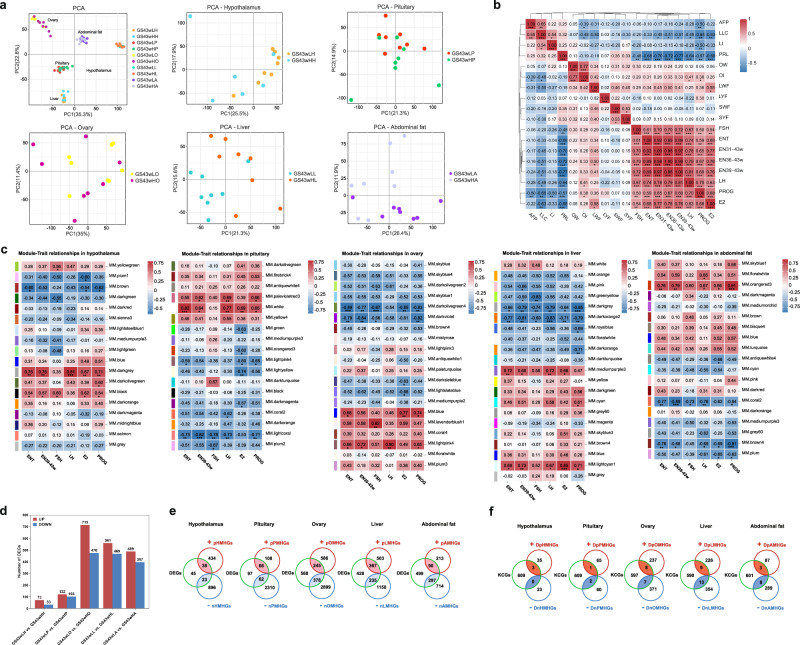
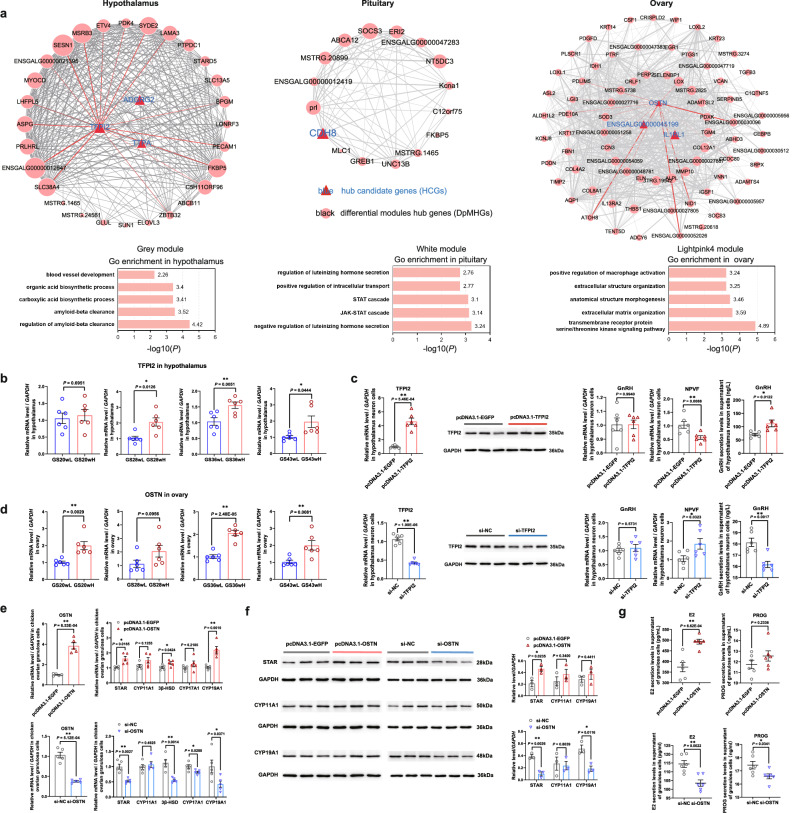
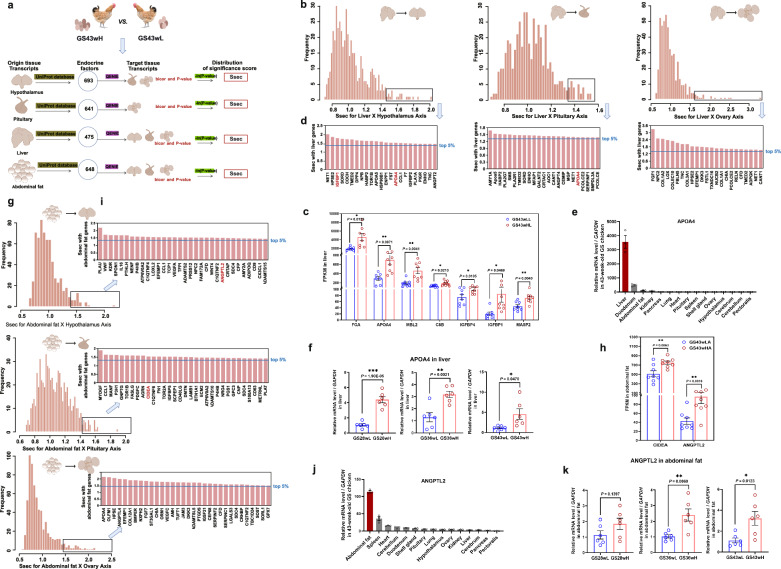
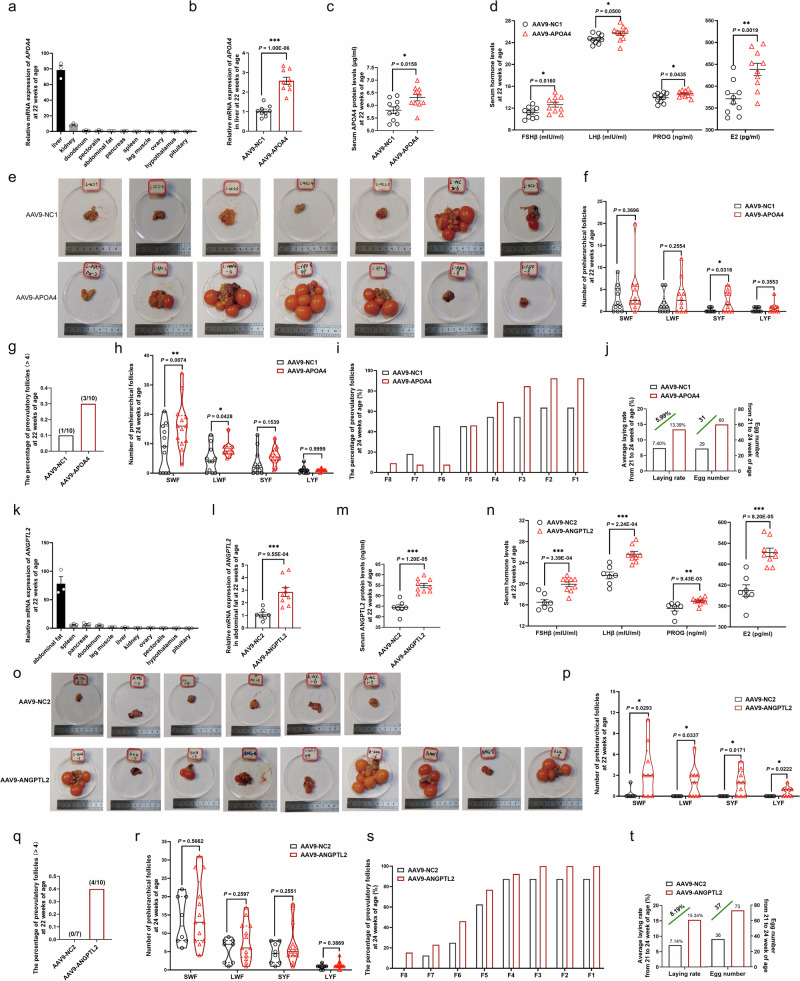
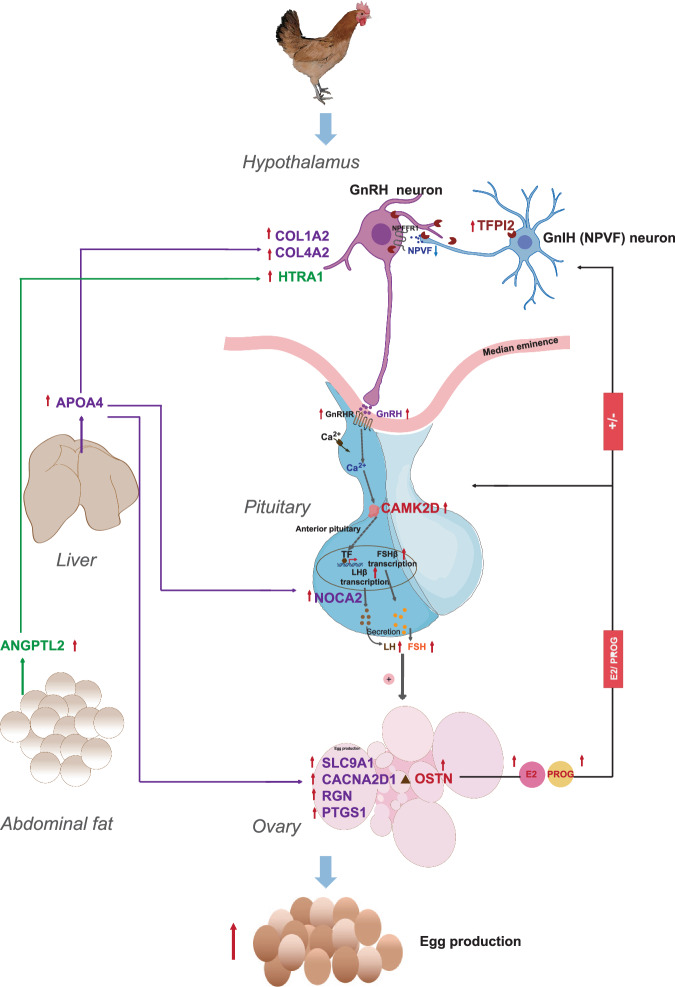
Egg-laying performance is of great economic importance in poultry, but the underlying genetic mechanisms are still elusive. In this work, we conduct a multi-omics and multi-tissue integrative study in hens with distinct egg production, to detect the hub candidate genes and construct hub molecular networks contributing to egg-laying phenotypic differences. We identifiy three hub candidate genes as egg-laying facilitators: TFPI2, which promotes the GnRH secretion in hypothalamic neuron cells; CAMK2D, which promotes the FSHβ and LHβ secretion in pituitary cells; and OSTN, which promotes granulosa cell proliferation and the synthesis of sex steroid hormones. We reveal key endocrine factors involving egg production by inter-tissue crosstalk analysis, and demonstrate that both a hepatokine, APOA4, and an adipokine, ANGPTL2, could increase egg production by inter-tissue communication with hypothalamic-pituitary-ovarian axis. Together, These results reveal the molecular mechanisms of multi-tissue coordinative regulation of chicken egg-laying performance and provide key insights to avian reproductive regulation.


Conflict of interest statement

The authors declare no competing interests.

Figures

Fig. 1
Fig. 1. Manhattan and quantile-quantile (Q-Q) plots of SNP-based whole-genome association signals for egg production traits in Gushi chicken.
Association testing was performed using linear mixed model. Association testing was performed using linear mixed model. The significance was corrected by a relaxed correction for multiple comparisons and was self-defined as the large effect significance threshold (P = 1/(SNP numbers); −log10(P) = 6; the horizontal solid line) or small effect significance threshold (−log10(P) = 4; the horizontal dashed line). N = 888 individuals. EN21-25w, EN26-30w, EN31-35w, EN36-43w, EN31-43w represent egg number at 21–25 weeks of age, 26–30 weeks of age, 31–35 weeks of age, 36–43 weeks of age, 31–43 weeks of age, respectively. ENT represents total egg number. MCS represents maximum clutch size. ACS21-25w, ACS26-30w, ACS31-35w, ACS36-43w, and ACS31-43w represent average clutch size in each of five stages consistent with the statistical stage division of egg number. ACST represents total average clutch size.
Fig. 2
Fig. 2. Comparative genomic analysis revealed selective regions and genes related to layer breed formation.
a Phylogenetic tree analysis of different breeds. b Principal component analysis of different breeds. c Linkage disequilibrium decay analysis of different breeds. d Selective signals of layer vs. RJF, layer vs. native and native vs. RJF based on ZFST analysis. The horizontal red dashed lines correspond to the top 5% threshold. e Venn diagram of potential selected genes (PSGs) in three comparison groups. f Venn diagram of the intersection of GWASGs and PSGs. g Selective signals of CAMK2D in the three comparison groups. h SNPs and haplotypes in CAMK2D significantly associated with egg production traits in Gushi chicken. Chi-square test and F-test were performed to access the association significance in CCA-based GWAS and haplotype-based GWAS, respectively. CS represents clutch size, MCS represents maximum clutch size, and ACS26-30w represents average clutch size from 31 to 43 weeks of age. i The genotype pattern of SNPs located in the promoter and intron regions of CAMK2D. j Tissue expression pattern of CAMK2D in 30-week-old Hy-line layers and native chickens (n = 3 for the expression in different tissues; n = 8 for the expression in different breeds). Layer: WL (White Leghorn) and RIR (Rhode Island Red). Native chicken breeds: Gushi (GS), Lushi (LS), Xichuan Black Bone (XCBB), Zhengyang San Huang (ZYSH) and Henan Gamecock (HNG) chickens. Wild breed: RJF (Red Jungle Fowl). The data for (j) are presented as the mean ± SEM, and the indicated P values (*P < 0.05, **P < 0.01) are based on two-tailed unpaired t-test. Source data are provided as a Source Data file.
Fig. 3
Fig. 3. Multi-tissue transcriptome analysis excavated hub candidate genes regulating egg production.
a Principal component analysis of sequencing samples from 5 tissues. GS43wLH and GS43wHH represent the low- and high-yield groups of 43-week-old Gushi chickens in hypothalamus, respectively. The classification of other tissues are similar to the hypothalamus. b Pearson correlation analysis of all phenotypes in 43-week-old Gushi chickens. AFP, LLC, LI, OW, and OI represent abdominal fat percentage, liver lipid content, liver index, ovarian weight and ovarian index, respectively. c Module-egg production traits relationships in five tissues. d Differentially expressed genes (DEGs) obtained by comparing high- and low-yield groups of different tissues. e The intersection of DEGs and module hub genes (MHGs). pHMHGs represent the MHGs positively correlated with egg production in hypothalamus. nHMHGs represent the MHGs negatively correlated with egg production in hypothalamus. The representation of MHGs in other tissues is similar to that in hypothalamus. f The intersection of key candidate genes (KCGs) and differential MHGs. The data in (b, c) are presented as the correlation coefficient, and the correlation significance (*P < 0.05; **P < 0.01 and ***P < 0.001) were performed by two-tailed unpaired t-test.
Fig. 4
Fig. 4. Functional validation of hub candidate genes in the HPO axis in vitro.
a Co-expression regulatory networks and functional enrichments of the hub candidate genes (HCGs) positively correlated with egg production in HPO axis tissues. Node size indicates the connectivity between genes. The larger the node, the higher the connectivity. The putative functions of module hub genes were investigated by gene ontology (GO) enrichment analysis with R package clusterProfiler. The statistical significance (P < 0.05) was performed by fisher’s precise test. b The expression difference of TFPI2 in hypothalamus between high- and low-yield groups at different laying stages (n = 6 for each group). c Effects of TFPI2 function gain or loss on reproductive hormone GnRH secretion in chicken primary hypothalamic neuron cells (n = 6 for each group in the mRNA level; n = 3 for each group in the protein level). d The expression difference of OSTN in ovary between high- and low-yield groups at different laying stages (n = 6 for each group). e, f Effects of OSTN function gain or loss on the mRNA levels and protein levels of key genes involved in steroid hormone synthesis pathway in chicken ovarian granulosa cells (n = 5 for each group in e; n = 3 for each group in (f)). g Effects of OSTN function gain or loss on E2 and PROG hormone levels in chicken ovarian granulosa cell supernatant (n = 6 for each group). Data for (bg) are presented as the mean ± SEM, and the indicated P values (*P < 0.05; **P < 0.01 and ***P < 0.001) are based on two-tailed unpaired t-test. Source data are provided as a Source Data file.
Fig. 5
Fig. 5. Multi-tissue systematic screening for key endocrine factors of inter-tissue crosstalk regulating egg production in chicken.
a Flow chart of inter-tissue crosstalk analysis. b Rank of all liver endocrine factors based on Ssec of liver-HPO axis crosstalk. c FPKM of liver-specific endocrine factors in the liver of 43-week-old Gushi chickens in high- (GS43wHL) and low-yield groups (GS43wLL) (n = 7–8 for each group). d Liver endocrine factors of top 5% Ssec. e Expression of APOA4 in different tissues of 43-week-old Gushi chickens (n = 3). f Expression difference of APOA4 in high- and low-yield groups at different laying stages (n = 6 for each group). g Rank of all abdominal fat endocrine factors based on Ssec of abdominal fat-HPO axis crosstalk. h FPKM of abdominal fat-specific endocrine factors in the abdominal fat of 43-week-old Gushi chickens in high- (GS43wHA) and low-yield groups (GS43wLA) (n = 8 for each group). i Abdominal fat endocrine factors of top 5% Ssec. j Expression of ANGPTL2 in different tissues of 43-week-old Gushi chickens (n = 3). k Expression difference of ANGPTL2 in high- and low-yield groups at different laying stages (n = 6 for each group). Ssec indicates the strength of cross-tissue predictions for endocrine circuits. GS28wL and GS28wH, GS36wL and GS36wH, GS43wL and GS43wH, represent the high- and low-yield groups of Gushi chickens at 28, 36, and 43 weeks of age, respectively. The data in (c, e, f, h, j, k) are presented as the mean ± SEM; groups with significant differences (*P < 0.05, **P < 0.01, and ***P < 0.001) were performed by two-tailed unpaired t-test. Source data for are provided as a Source Data file.
Fig. 6
Fig. 6. Peripheral tissue-HPO axis crosstalk improved early egg production in Gushi chicken.
a Tissue expression characteristics of APOA4 in AAV9-APOA4 group of 22-week-old Gushi hens (n = 3). b, c Liver-specific APOA4 overexpression significantly increased its mRNA level in liver and its protein levels in serum at 22 weeks of age (n = 9 for each group in (b); n = 10 for each group in (c)). dg Effects of liver-specific APOA4 overexpression on reproductive hormone levels, ovarian morphology, number of prehierarchical follicles and the percentage of preovulatory follicles at 22 weeks of age (n = 10 for each group in (d, f)). h, i Effects of liver-specific APOA4 overexpression on number of prehierarchical follicles and the percentage of preovulatory follicles at 24 weeks of age (n = 11 for AAV9-NC1, and n = 10 for AAV9-APOA4 in (h)). j Liver-specific APOA4 overexpression affected egg number and average egg-laying rate from 21 to 24 weeks of age. k Tissue expression characteristics of ANGPTL2 in AAV9-ANGPTL2 group of 22-week-old Gushi hens (n = 3). l, m Abdominal fat-specific ANGPTL2 overexpression significantly increased its mRNA level in liver and its protein levels in serum at 22 weeks of age (n = 7 for AAV9-NC2, and n = 9 for AAV9-ANGPTL2). nq Effects of abdominal fat-specific ANGPTL2 overexpression on reproductive hormone levels, ovarian morphology, number of prehierarchical follicles, and the percentage of preovulatory follicles at 22 weeks of age (n = 7 for AAV9-NC2, and n = 9 for AAV9-ANGPTL2 in (n, p)). r, s Effects of abdominal fat-specific ANGPTL2 overexpression on number of prehierarchical follicles and the percentage of preovulatory follicles at 24 weeks of age (n = 8 for AAV9-NC2, and n = 13 for AAV9-ANGPTL2 in (r)). t abdominal fat-specific ANGPTL2 overexpression affected egg number and average egg-laying rate from 21 to 24 weeks of age. Data are presented as the mean ± SEM, and the indicated P values (*P < 0.05, **P < 0.01, and ***P < 0.001) are based on two-tailed unpaired t-test. Source data are provided as a Source Data file.
Fig. 7
Fig. 7. Proposed mechanism of hub candidate genes and key endocrine factors regulating chicken egg-laying phenotypes.
GnRH represents gonadotropin-releasing hormone; GnIH gonadotropin-inhibiting hormone; FSH represents follicle-stimulating hormone; LH represents luteinizing hormone; E2 represents estrogen; and PROG represents progesterone. The red up arrow indicates up-regulated expression, and the blue down arrow indicates down-regulated expression.

Similar articles

Cited by

References

    1. Qanbari, S. et al. Genetics of adaptation in modern chicken. PLoS Genet.15, e1007989 (2019). 10.1371/journal.pgen.1007989 - DOI - PMC - PubMed
    1. Du, Y. et al. Endocrine and genetic factors affecting egg laying performance in chickens: a review. Br. Poult. Sci.61, 538–549 (2020). 10.1080/00071668.2020.1758299 - DOI - PubMed
    1. Wolc, A. et al. Investigating the genetic determination of clutch traits in laying hens. Poult. Sci.98, 39–45 (2019). 10.3382/ps/pey354 - DOI - PubMed
    1. Gao, J. et al. Genome-wide association study of egg-laying traits and egg quality in Lingkun chickens. Front. Vet. Sci.9, 877739 (2022). 10.3389/fvets.2022.877739 - DOI - PMC - PubMed
    1. Zhao, X. et al. Identification of candidate genomic regions for chicken egg number traits based on genome-wide association study. BMC Genom.22, 610 (2021).10.1186/s12864-021-07755-3 - DOI - PMC - PubMed

MeSH terms

Substances

LinkOut - more resources