. 2024 Aug 16;15(1):7076.
doi: 10.1038/s41467-024-51090-6.

The Fanconi anemia core complex promotes CtIP-dependent end resection to drive homologous recombination at DNA double-strand breaks

Affiliations

The Fanconi anemia core complex promotes CtIP-dependent end resection to drive homologous recombination at DNA double-strand breaks

Bert van de Kooij et al. Nat Commun. .

Abstract

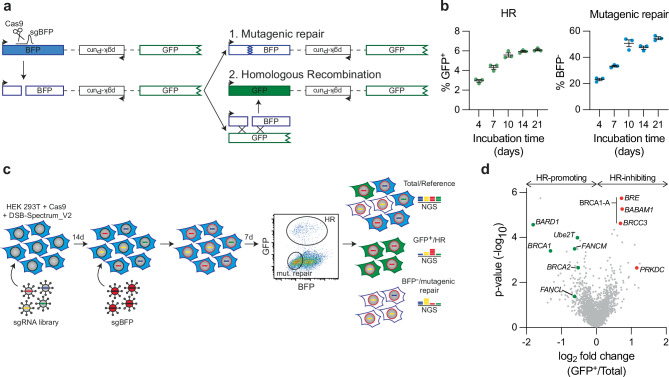
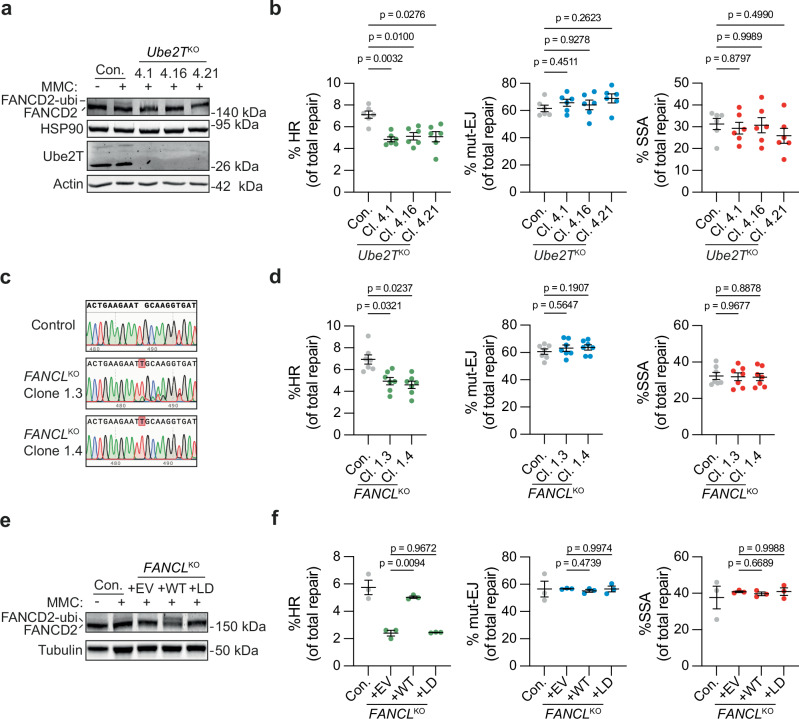
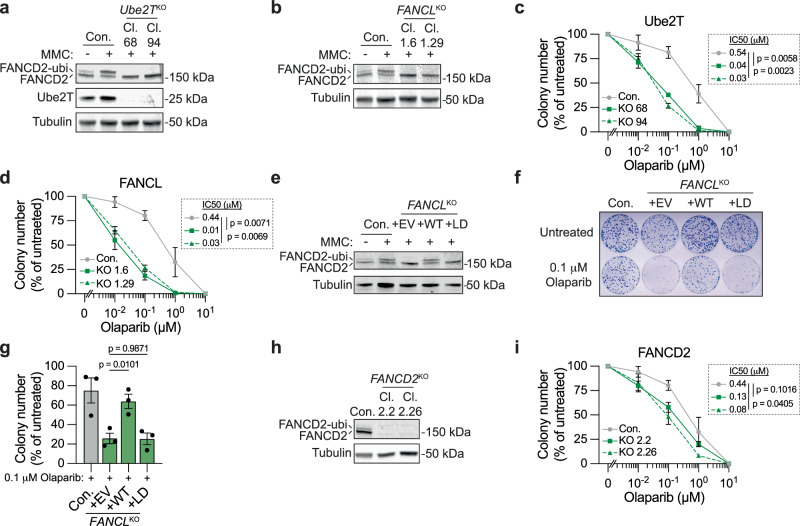
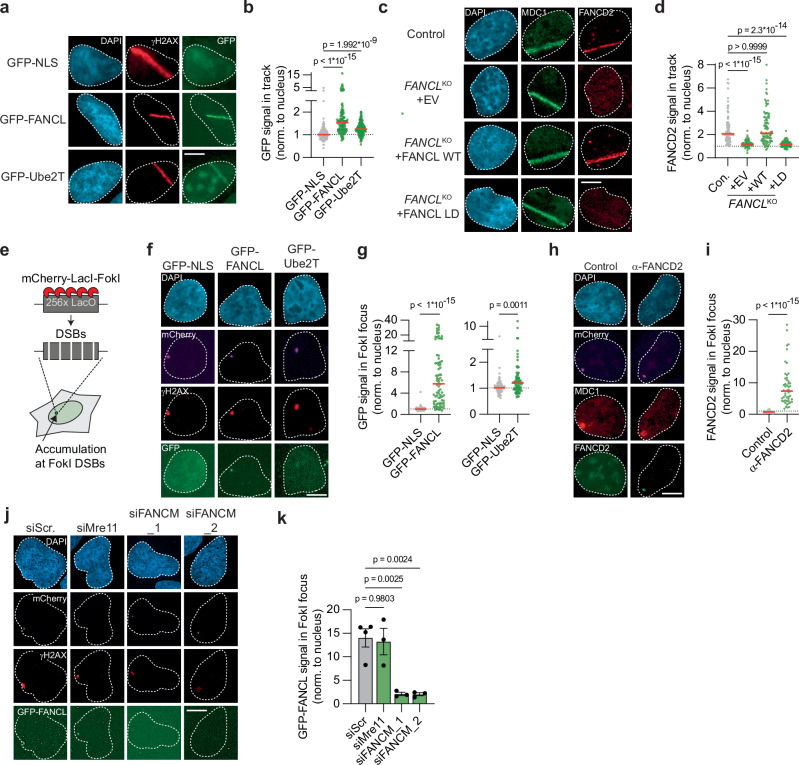
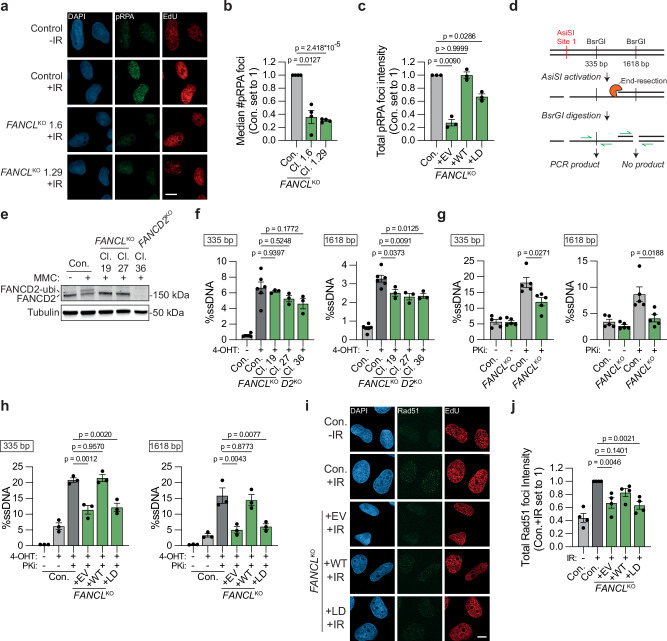
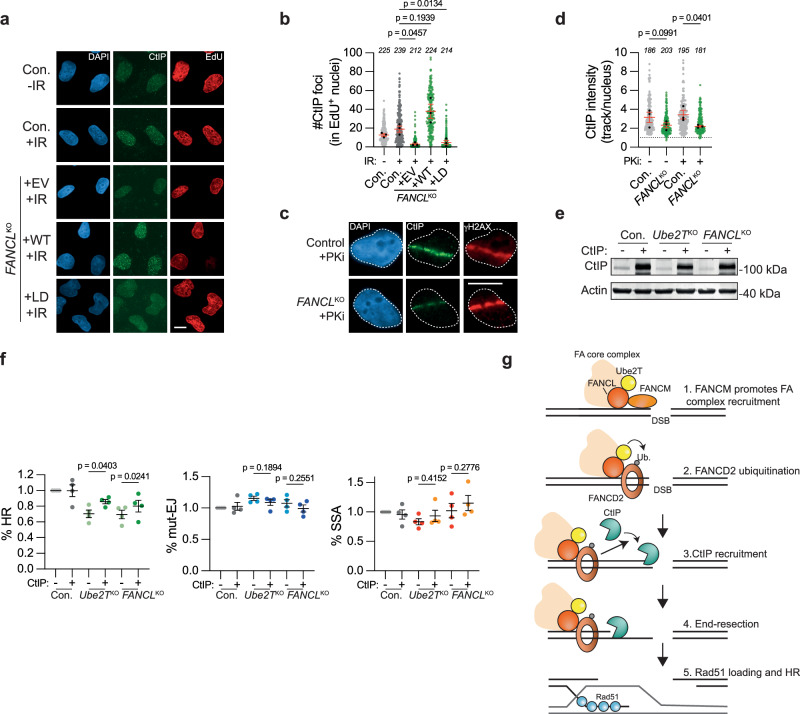
During the repair of interstrand crosslinks (ICLs) a DNA double-strand break (DSB) is generated. The Fanconi anemia (FA) core complex, which is recruited to ICLs, promotes high-fidelity repair of this DSB by homologous recombination (HR). However, whether the FA core complex also promotes HR at ICL-independent DSBs, for example induced by ionizing irradiation or nucleases, remains controversial. Here, we identified the FA core complex members FANCL and Ube2T as HR-promoting factors in a CRISPR/Cas9-based screen. Using isogenic cell line models, we further demonstrated an HR-promoting function of FANCL and Ube2T, and of their ubiquitination substrate FANCD2. We show that FANCL and Ube2T localize at DSBs in a FANCM-dependent manner, and are required for the DSB accumulation of FANCD2. Mechanistically, we demonstrate that FANCL ubiquitin ligase activity is required for the accumulation of CtIP at DSBs, thereby promoting end resection and Rad51 loading. Together, these data demonstrate a dual genome maintenance function of the FA core complex and FANCD2 in promoting repair of both ICLs and DSBs.


Conflict of interest statement

The authors declare no competing interests.

Figures

Fig. 1
Fig. 1. A targeted CRISPR screen in DSB-Spectrum reporter cells identifies FANCM, Ube2T and FANCL as HR-promoting factors.
a Schematic of the DSB-Spectrum_V2 reporter. Adapted from van de Kooij et al.. BFP=Blue Fluorescent Protein, GFP=Green Fluorescent Protein. b HEK 293T+ Cas9 + DSB-Spectrum_V2 cells were lentivirally infected to express mCherry and the BFP sgRNA targeting the DSB-Spectrum_V2 reporter locus. Next, at indicated time points, BFP and GFP expression were analyzed by flow cytometry. Depicted is the mean ± SEM of a technical triplicate. HR homologous recombination. c Schematic displaying the CRISPR screen layout in HEK 293T + Cas9 + DSB-Spectrum_V2 cells. NGS next-generation sequencing. d Volcano plot showing the gene targets of sgRNAs that were either enriched or depleted from the GFP+ HR population as compared to the reference population. BRCA1/BARD1, BRCA2, and Ube2T/FANCM/FANCL are indicated in green as HR-promoting factors. BRE/BABAM1/BRCC3, all members of the BRCA1-A complex, and PRKDC are indicated in red as HR-inhibiting factors. Enrichment and statistical values were determined by MAGeCK integrated into the BASDaS screening data analysis interface (n = 3 independent biological replicates),. Source data are provided as a Source Data file.
Fig. 2
Fig. 2. Ube2T and FANCL promote HR-mediated repair of Cas9-induced DSBs.
a HEK 293T + DSB-Spectrum_V3 Ube2TKO clones 4.1, 4.16, and 4.21, as well as the parental control (Con.) were treated with Mitomycin C (MMC, 300 nM) for 24 h. Next, Ube2T expression levels and FANCD2 ubiquitination status were analyzed by western blotting. b Indicated HEK 293T + DSB-Spectrum_V3 cell lines were transfected to express S. pyogenes Cas9 and either a control sgRNA or the sgRNA targeting the BFP gene in the reporter locus. Next, cells were analyzed by flow cytometry to determine the frequency of repair by each of the three indicated pathways (n = 6 independent biological replicates; mean ± SEM; one-way ANOVA with post-hoc Dunnett’s). HR homologous recombination, mut-EJ mutagenic end-joining, SSA single-strand annealing. c DNA sequence alignment of the FANCL sgRNA target site in unedited parental control cells and the HEK 293T + DSB-Spectrum_V3 FANCLKO clones. Depicted are representative sequence chromatograms, red shaded boxes indicate deviations in the DNA sequence of the FANCLKO clone compared to control. d As in panel (b), now analyzing FANCLKO cells (n = 7 independent biological replicates; mean ± SEM; one-way ANOVA with post-hoc Dunnett’s). e HEK 293T + DSB-Spectrum_V3 FANCLKO clones were transduced with an empty vector (EV), FANCL wild-type cDNA (WT), or FANCL Ligase-Dead cDNA (LD), and treated with Mitomycin C (MMC, 1 μM) for 24 h. Next, FANCD2 ubiquitination was analyzed by western blot. f As in panel b, now analyzing the HEK 293T + DSB-Spectrum_V3 FANCLKO cells described in panel (e) (n = 3 independent biological replicates; mean ± SEM; one-way ANOVA with post-hoc Dunnett’s). Source data are provided as a Source Data file.
Fig. 3
Fig. 3. Loss of Ube2T, FANCL and FANCD2 sensitizes cells to PARP inhibitor-induced toxicity.
a Indicated U2OS Ube2TKO clones (Cl.), as well as the parental control (Con.), were treated with Mitomycin C (MMC, 500 nM) for 24 h. Next, FANCD2 ubiquitination status and protein levels of Ube2T were analyzed by western blot. b As in panel (a), but now for U2OS FANCLKO clones. c, d U2OS cells, either wild-type control (Con.) or knock-out for Ube2T (panel c) or FANCL (panel d), were treated with olaparib for 14 days. Cell viability was assessed by clonogenic survival. Note that the 0 μM value was added manually to the X-axis. Inset shows mean IC50 and p-value (IC50 based on curve fitting of n = 3 independent biological replicates; Ratio paired t test, two-sided. For individual data points mean ± SEM is shown for n = 3 independent biological replicates, expect for the 0.1 μM and 10 μM concentration in panel (c) for which n = 2). e As in panel (b), now for FANCLKO cells that were transduced with an empty vector (EV), FANCL wild-type cDNA (WT), or FANCL ligase-dead cDNA (LD). f, g Indicated cell lines were treated with 0.1 μM olaparib, or left untreated, for 14 days. Cell viability was assessed by clonogenic survival. Panel (f) shows a representative picture of Methylene Blue-stained colonies in 10 cm plates, and panel (g) shows the quantification (n = 3 independent biological replicates; mean ± SEM; one-way ANOVA with post-hoc Dunnett’s). h As in panel (b), but now for untreated FANCD2KO clones. i As in panels (c) and (d), but for FANCD2KO cells (n = 3; mean ± SEM; Ratio paired t test, two-sided). Source data are provided as a Source Data file.
Fig. 4
Fig. 4. FANCL, Ube2T and FANCD2 are recruited to DNA double-strand breaks.
a, b U2OS cells expressing either GFP-NLS, GFP-FANCL, or GFP-Ube2T were exposed to UV-A laser micro-irradiation. Next, the GFP signal at γH2AX-positive laser-induced DNA damage tracks was analyzed by fluorescence microscopy. Shown are representative images (a) and quantification (b) of one of two independent biological replicates (scale bar = 10 μM). The dotted line is set at 1 (i.e., no recruitment to the track), red lines indicate median (n = 128, 116, 146 (NLS, FANCL, Ube2T); one-way ANOVA with post-hoc Kruskal-Wallis). c, d As in panels, but now analyzing recruitment of endogenous FANCD2 to MDC1-positive laser-induced DNA damage tracks in U2OS FANCLKO cell lines (EV = empty vector, WT = wild-type, LD = ligase-dead). Shown are representative images (c) and quantification (d) of one of two independent biological replicates (scale bar = 10 μM). Red lines indicate the median (n = 82, 56, 90, 84 (Con., + EV, + WT, + LD); one-way ANOVA with post-hoc Kruskal-Wallis). e Cartoon schematic of a DSB recruitment assay in U2OS 2-6-3 cells. f, g Accumulation of GFP-NLS, GFP-FANCL, or GFP-Ube2T at γH2AX-marked FokI-generated DSBs in U2OS 2-6-3 cells was assessed by fluorescence microscopy. Shown are representative images (f) and quantification (g) of one of two independent biological replicates (scale bar = 10 μM). GFP-FANCL and GFP-Ube2T signals are plotted in individual graphs to optimize the scaling of the Y-axis. Red lines indicate the median (n = 74, 82, 77 (NLS, FANCL, Ube2T); Mann-Whitney test, two-sided). h, i As in panels (f) and (g) but now analyzing endogenous FANCD2 recruitment to MDC1-marked FokI-induced DSBs. Primary α-FANCD2 antibody was omitted from the immuno-staining in the control sample. Shown are representative images (h) and quantification (i) of one of two independent biological replicates. Red lines indicate the median (n = 56, 50 (Control, a-FANCD2); Mann-Whitney test, two-sided). j, k As in panels (f) and (g), but including siRNA transfection. Panel (j) shows representative images (scale bar = 10 μM), and panel (k) shows the quantification of independent biological replicates (n = 4 for siScr, n = 3 for the other conditions; mean ± SEM; one-way ANOVA with post-hoc Dunnett’s). Source data are provided as a Source Data file.
Fig. 5
Fig. 5. FANCL promotes end resection at DNA double-strand breaks.
a, b U2OS FANCLKO clones (Cl.) and wild-type control cells (Con.) were exposed to 10 Gy ionizing radiation (IR), followed by IF microscopy to detect foci containing S4/8 phosphorylated RPA (pRPA) in S-phase (EdU + ) nuclei. Panel (a) shows representative images (scale bar = 10 μM), and panel (b) shows the quantification (n = 4 independent biological replicates; mean ± SEM; one-way ANOVA with post-hoc Dunnett’s). c As in panel (b), but now plotting total pRPA foci intensity per nucleus in FANCLKO cells reconstituted with FANCL WT or LD (n = 3 independent biological replicates; mean ± SEM; one-way ANOVA with post-hoc Dunnett’s). d Schematic of the qPCR-based quantification of end resection in AsiSI cells. e Western blot of MMC-treated (500 nM, 24 h) U2OS AsiSI cells. f Quantification by qPCR of single-strand DNA (ssDNA) at 335 bp or 1618 bp distance from a defined AsiSI-induced DSB (n = 6 for control cells, n = 3 for KO cells, all independent biological replicates; one-way ANOVA with post-hoc Dunnett’s). g As in panel (f), but now including treatment with the DNA-PKcs inhibitor NU7441 (PKi; 2 μM; n = 5 independent biological replicates; mean ± SEM; paired t-test, two-sided). h As in panel (g), now in FANCLKO cells that express either an empty vector (EV), FANCL wild-type (WT), or FANCL ligase-dead (LD; n = 3 independent biological replicates; mean ± SEM; one-way ANOVA with post-hoc Dunnett’s). i, j As in panels (a) and (b), respectively, but now analyzing total Rad51 foci intensity per S-phase nucleus (n = 4 independent biological replicates; mean ± SEM; one-way ANOVA with post-hoc Dunnett’s; scale bar = 10 μM). Source data are provided as a Source Data file.
Fig. 6
Fig. 6. FANCL promotes CtIP recruitment to DNA double-strand breaks.
a, b U2OS FANCLKO and wild-type control cells (Con.) were exposed to 10 Gy ionizing radiation (IR), followed by IF microscopy to detect CtIP foci in S-phase (EdU + ) nuclei. Panel (a) shows representative images and panel (b) shows the quantification (scale bar = 10 μM). Plotted are the data from all biological repeats. Each gray or green dot represents an individual nucleus, the total number of nuclei analyzed are indicated in italics, and black dots are the median for each biological repeat (n = 3 independent biological replicates; mean ± SEM; one-way ANOVA with post-hoc Dunnett’s). EV empty vector, WT wild-type, LD ligase-dead. c, d IF-microscopy of UV-A laser micro-irradiated cells. Panel (c) shows representative images, panel (d) shows the quantification (scale bar = 10 μM). Plotted are the data from all biological repeats. Each gray or green dot represents an individual track, the total number of tracks analyzed are indicated in italics, and black dots are the median for each biological repeat (n = 3 independent biological replicates; mean ± SEM; ratio paired t test, two-sided). PKi = DNA-PKcs inhibitor NU7441, 2 μM. e Western blot analysis of CtIP overexpression in the cells described in panel (f). f Indicated HEK 293T + DSB-Spectrum_V3 cell lines were transfected to express either CtIP or an empty vector control, together with Cas9 and the sgRNA targeting the BFP gene in the reporter locus. Next, cells were analyzed by flow cytometry to determine the frequency of repair by each of the three indicated pathways. Data were normalized to the Con.+ EV (n = 4 independent biological replicates; mean ± SEM; One-way ANOVA with post-hoc Dunnett’s). HR homologous recombination, mut-EJ mutagenic end-joining, SSA single-strand annealing. g Model depicting how FANCL/Ube2T promotes the repair of DSBs by homologous recombination. See main text for details. Source data are provided as a Source Data file.

Update of

References

    1. Scully, R., Panday, A., Elango, R. & Willis, N. A. DNA double-strand break repair-pathway choice in somatic mammalian cells. Nat. Rev. Mol. Cell Biol.20, 698–714 (2019). 10.1038/s41580-019-0152-0 - DOI - PMC - PubMed
    1. Cejka, P. & Symington, L. S. DNA End Resection: Mechanism and control. Annu. Rev. Genet.55, 285–307 (2021). 10.1146/annurev-genet-071719-020312 - DOI - PubMed
    1. Jasin, M. & Rothstein, R. Repair of strand breaks by homologous recombination. Cold Spring Harb. Perspect. Biol.5, a012740 (2013). - PMC - PubMed
    1. Anand, R., Ranjha, L., Cannavo, E. & Cejka, P. Phosphorylated CtIP functions as a Co-factor of the MRE11-RAD50-NBS1 endonuclease in DNA end resection. Mol. Cell64, 940–950 (2016). 10.1016/j.molcel.2016.10.017 - DOI - PubMed
    1. Sartori, A. A. et al. Human CtIP promotes DNA end resection. Nature450, 509–514 (2007). 10.1038/nature06337 - DOI - PMC - PubMed

MeSH terms

LinkOut - more resources