. 2024 Aug 17;15(1):7081.
doi: 10.1038/s41467-024-51557-6.

DSS1 restrains BRCA2's engagement with dsDNA for homologous recombination, replication fork protection, and R-loop homeostasis

Affiliations

DSS1 restrains BRCA2's engagement with dsDNA for homologous recombination, replication fork protection, and R-loop homeostasis

Yuxin Huang et al. Nat Commun. .

Abstract

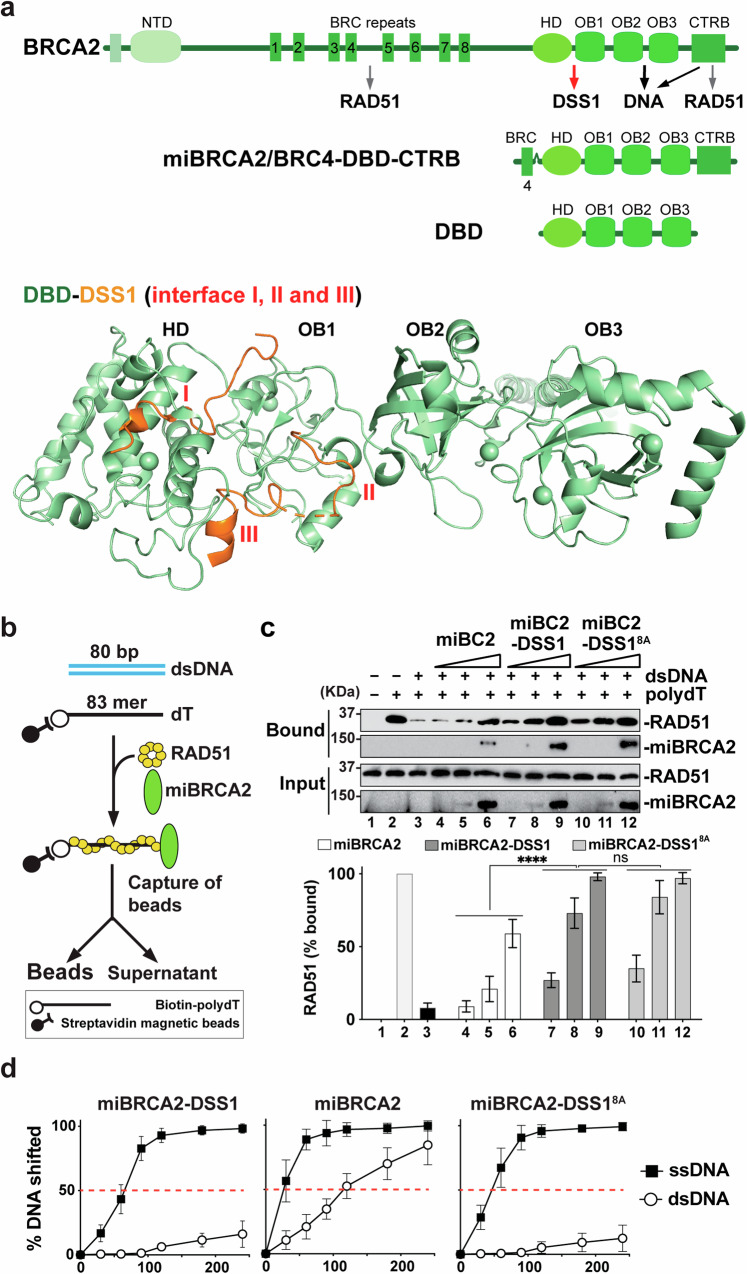
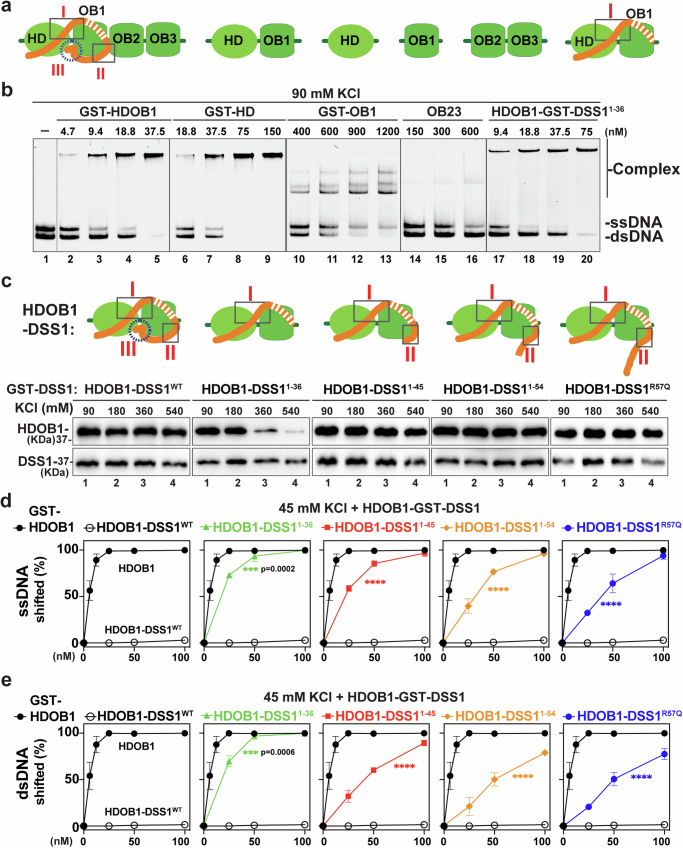
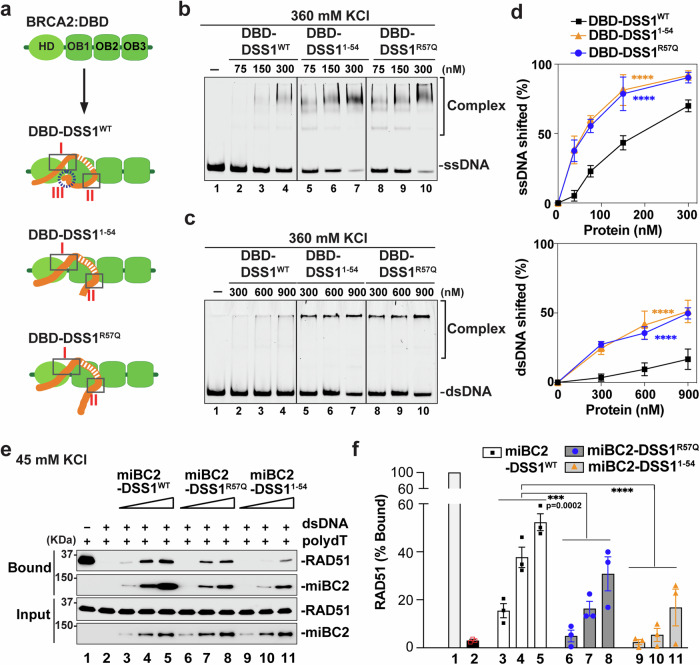
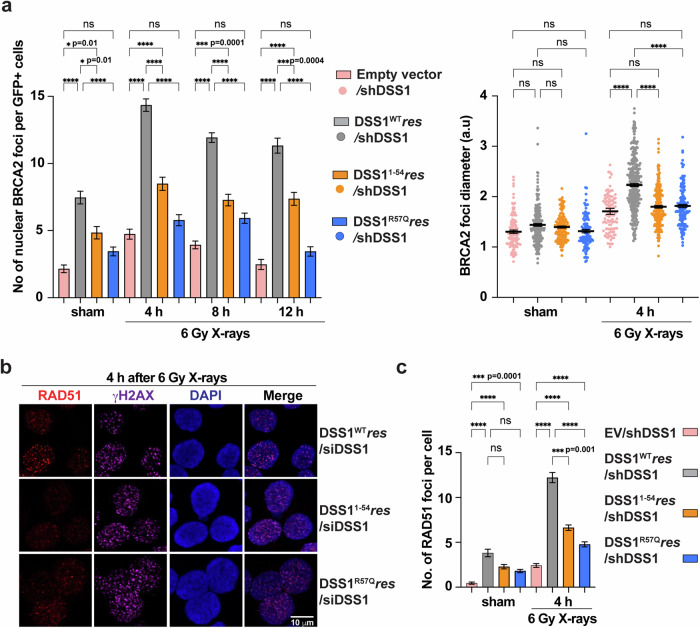
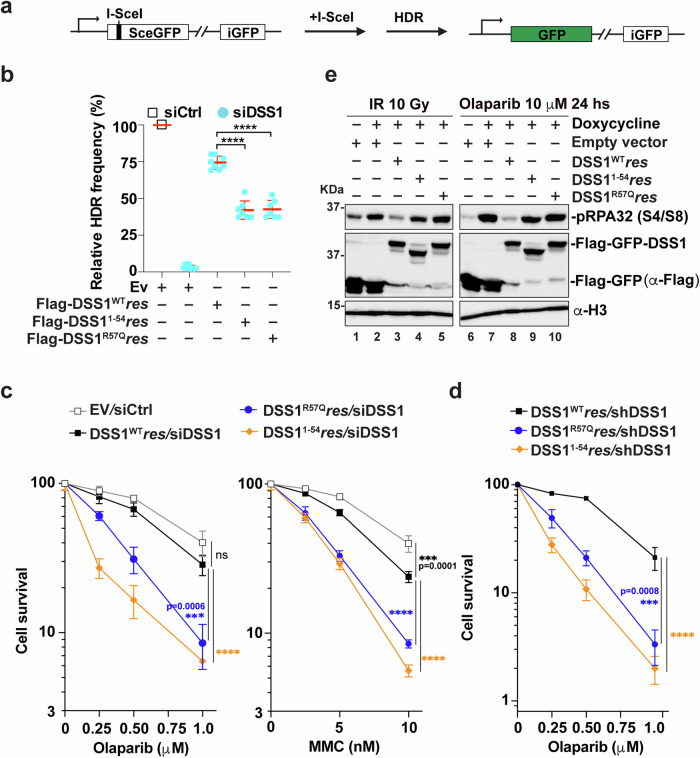
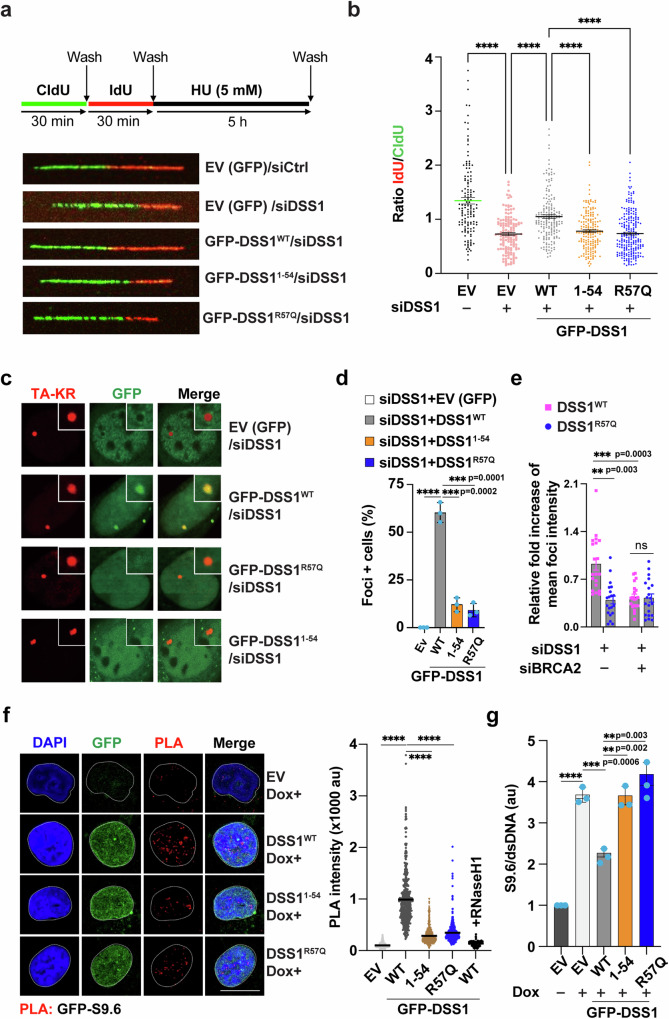
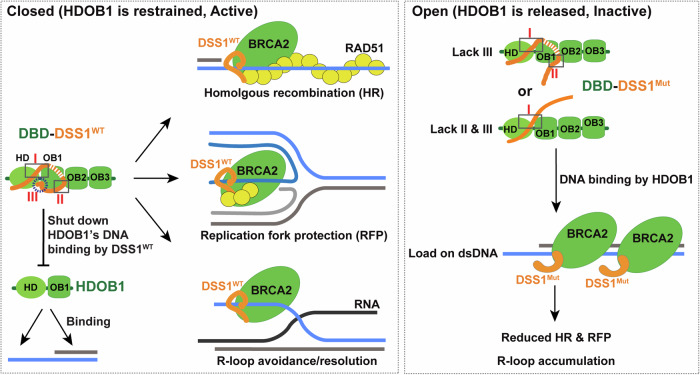
DSS1, essential for BRCA2-RAD51 dependent homologous recombination (HR), associates with the helical domain (HD) and OB fold 1 (OB1) of the BRCA2 DSS1/DNA-binding domain (DBD) which is frequently targeted by cancer-associated pathogenic variants. Herein, we reveal robust ss/dsDNA binding abilities in HD-OB1 subdomains and find that DSS1 shuts down HD-OB1's DNA binding to enable ssDNA targeting of the BRCA2-RAD51 complex. We show that C-terminal helix mutations of DSS1, including the cancer-associated R57Q mutation, disrupt this DSS1 regulation and permit dsDNA binding of HD-OB1/BRCA2-DBD. Importantly, these DSS1 mutations impair BRCA2/RAD51 ssDNA loading and focus formation and cause decreased HR efficiency, destabilization of stalled forks and R-loop accumulation, and hypersensitize cells to DNA-damaging agents. We propose that DSS1 restrains the intrinsic dsDNA binding of BRCA2-DBD to ensure BRCA2/RAD51 targeting to ssDNA, thereby promoting optimal execution of HR, and potentially replication fork protection and R-loop suppression.


Conflict of interest statement

The authors declare no competing interests.

Figures

Fig. 1
Fig. 1. Facilitation of BRCA2-mediated RAD51 Targeting onto ssDNA over dsDNA by DSS1.
(See also Supplementary Fig. 1). a Schematic representation of BRCA2, miBRCA2, and DBD with various functional domains and interaction partners (top). Overall view of the mouse BRCA2-DBD (light green) in complex with DSS1 (orange; PDB: 1MIU) with three potential interfaces (I, II, and III, bottom). b Schematic representation of the magnetic bead-based pulldown assay to investigate RAD51 loading onto biotin-labeled ssDNA (dT83) in the presence of excessive dsDNA. c Western blot analyses to monitor RAD51 loading by miBRCA2 (lanes 4–6), miBRCA2-DSS1 (lanes 7–9), and miBRCA2-SS18A (lanes 10–12) onto the ssDNA substrate at 45 mM KCl condition. Bead without dT83 conjugation (lane 1) and pulldown without dsDNA (lane 2) served as controls. The mean values (±SD) from three independent experiments were correspondingly plotted at the bottom panel. ns not significant; ****p ≤ 0.0001 (two-way ANOVA). d Quantification (mean ± SD) of dsDNA and ssDNA binding by miBRCA2, miBRCA2-DSS1, and miBRCA2-DSS18A from three independent experiments shown in Supplementary Fig. 1k at 90 mM KCl condition. miBRCA2 has significantly higher affinity to ssDNA and dsDNA than either miBRCA2-DSS1 or miBRCA2-DSS18A with ****P ≤ 0.0001 (two-way ANOVA). Source data are provided as a Source Data file.
Fig. 2
Fig. 2. DSS1 modulates BRCA2-HDOB1 DNA binding.
(See also Supplementary Figs. 2–7). a Schematic representation of DBD-DSS1 with three interfaces and various functional domains used in the study. b Representative gel of dsDNA (5 nM) and ssDNA (5 nM) binding by GST-HDOB1, GST-HD, GST-OB1, and OB23 and GST tagged DSS11–36-HDOB1 at 90 mM KCl condition from three independent experiments. c Schematic depicting HDOB1 with wild-type or various mutants of DSS1 (top), and the complex stability was tested under increasing amounts of salt (KCl) in the GST bead pull-down experiments (bottom). Representative Western blot analyses to monitor His (6)-HDOB1 and GST-DSS1 levels with anti-His or GST antibodies, respectively, from three independent experiments. d Quantification (mean ± SD) of ssDNA (5 nM) binding at 45 mM KCl condition by GST-HDOB1 and GST tagged complexes (HDOB1-DSS1, HDOB1-DSS11–36, HDOB1-DSS11–45, HDOB1-DSS11–54, and HDOB1-DSS1R57Q) from three independent experiments shown in Supplementary Fig. 4a, ****p ≤ 0.0001 (two-way ANOVA). e Quantification (mean ± SD) of dsDNA (5 nM) binding at 45 mM KCl condition by GST-HDOB1 and GST tagged complexes (HDOB1-DSS1, HDOB1-DSS11–36, HDOB1-DSS11–45, HDOB1-DSS11–54, and HDOB1-DSS1R57Q) from three independent experiments shown in Supplementary Fig. 4b, *p ≤ 0.05; ****p ≤ 0.0001 (two-way ANOVA). Source data are provided as a Source Data file.
Fig. 3
Fig. 3. Impact of DSS1 C-terminal Helix on DNA binding ability of DBD and targeting activity of miBRCA2-DSS1.
(See also Supplementary Figs. 8, 9). a Schematic representation of DBD-DSS1 complexes and their potential configurations. b Representative gel of ssDNA (5 nM) binding by DBD-DSS1WT, DBD-DSS11–54, and DBD-DSS1R57Q at 360 mM KCl condition. c Representative gel of dsDNA (5 nM) binding by DBD-DSS1WT, DBD-DSS11–54, and DBD-DSS1R57Q at 360 mM KCl condition. d Quantification (mean ± SD) of ssDNA (top) and dsDNA (bottom) binding from at least three independent experiments shown in b, c, ****p ≤ 0.0001 (two-way ANOVA). e Western blot analyses to monitor RAD51 loading by miBRCA2-DSS1WT (lanes 3–5; 3.75 nM, 7.5 nM, and 15 nM), miBRCA2-DSS1R57Q (lanes 6–8; 3.75 nM, 7.5 nM, and 15 nM), and miBRCA2-SS11–54 (lanes 9–11; 3.75 nM, 7.5 nM, and 15 nM) onto the ssDNA substrate at 45 mM KCl condition. Bead-biotin dT83 without dsDNA (lane 1) were served as a control. f Quantification of (e). The mean values (±SD) from three independent experiments were plotted, ***p ≤ 0.001, ****p ≤ 0.0001 (two-way ANOVA). Source data are provided as a Source Data file.
Fig. 4
Fig. 4. Influence of DSS1 C-terminal Helix on BRCA2 and RAD51 Foci Formation.
(See also Supplementary Fig. 10). a Quantification of BRCA2 foci number per GFP-positive cell (left) and the foci diameter (right) at various time points after exposure to 6 Gy X-rays or sham irradiation. The mean values ± SEM of at least three independent experiments is shown. ns not significant; *p ≤ 0.05; ***p ≤ 0.001; and ****p ≤ 0.0001 (ANOVA with the Kruskal–Wallis test). P values were calculated using two-way ANOVA for group comparison: Ev/shDSS1 vs DSS1WT/shDSS1, ****p ≤ 0.0001; DSS1WT/shDSS1 vs DSS11–54/shDSS1, **p ≤ 0.01; DSS1WT/shDSS1 vs DSS1R57Q/shDSS1, ****p ≤ 0.0001. b Representative micrographs of RAD51 foci (red) and γH2AX (magenta) in HeLa cell nuclei at 4 h after exposure to 6 Gy X-rays. Endogenous DSS1 was depleted by siRNA against DSS1. Blue: DAPI. c Quantification of RAD51 foci number per cell at 4 h after exposure to 6 Gy X-rays or sham irradiation. Endogenous DSS1 was depleted by doxycycline-induced shDSS1 expression. The mean values ± SEM of at least three independent experiments is shown. ns not significant; ***p < 0.001; and ****p ≤ 0.0001 (ANOVA with the Kruskal–Wallis test). P values were calculated using two-way ANOVA for group comparisons: Ev/shDSS1 vs DSS1WT/shDSS1, ****p ≤ 0.0001; DSS1WT/shDSS1 vs DSS11–54/shDSS1, ****p ≤ 0.0001; DSS1WT/shDSS1 vs DSS1R57Q/shDSS1, ****p ≤ 0.0001. Source data are provided as a Source Data file.
Fig. 5
Fig. 5. Impact of DSS1 C-terminal Helix on HR Efficiency and Cell Survival.
(See also Supplementary Fig. 11). a Outline of the HR assay with the DR-GFP reporter in U2OS cells. b Quantification of results from HR assays in DR-U2OS cells with transient expression of empty vector, Flag-DSS1WTres, Flag-DSS11-54res, or Flag-DSS1R57Qres after DSS1 knockdown and I-SceI expression. GFP-positive cells indicate the fraction of successfully completed HR events. The mean values (±SD) from 3–4 independent experiments were plotted, ****p ≤ 0.0001. c, d Survival curves of HeLa cells with stable expression of GFP-DSS1WTres, GFP-DSS11-54res, or GFP-DSS1R57Qres after the treatment with increasing concentrations of Olaparib or MMC. Endogenous DSS1 was depleted by doxycycline-induced shDSS1 expression or by siRNA against DSS1. The mean values (±SD) from three independent experiments were plotted, ns not significant; **p ≤ 0.01; ***p ≤ 0.001; and ****p ≤ 0.0001 (two-way ANOVA). e Representative Western blot from three independent experiments to show pRPA(S4/S8) levels at 6 h after exposure to 10 Gy X-rays or 10 μM Olaparib 24 h treatment. Histone H3 serves as the loading control. Endogenous DSS1 was depleted by doxycycline-induced shDSS1 expression. Source data are provided as a Source Data file.
Fig. 6
Fig. 6. Requirement of DSS1 C-terminal Helix in Replication Fork Protection and R-loop Resolution.
(See also Supplementary Figs. 11, 12). a Schematic of replication fork stability assay with CldU and IdU labeling (top) and representative micrographs of fiber events in HeLa cells with stable expression of EV (GFP), GFP-DSS1WTres, GFP-DSS11-54res, or GFP-DSS1R57Qres (bottom). Endogenous DSS1 was depleted by siRNA against DSS1. b Dot plots of IdU to CldU tract length ratios for individual replication forks in HU-treated cells. The median value of 130–220 CldU and IdU tracts from three independent experiments. Data represent mean ± SEM. Statistical analysis was performed using the two-sided student's t-test with ****p < 0.0001. c U2OS-TRE cells transfected with pBROAD3 TA-KR and the expression vector of EV(GFP), GFP-DSS1WT, GFP-DSS11–54, or GFP-DSS1R57Q were light-activated and recovered 20 min before fixation. Representative images of GFP foci recruitment at sites of KR in each group were shown. d Foci-positive cells in each indicated group in Fig. 6c at sites of TA-KR were quantified (n = 30). The mean values ± SD of three independent experiments is shown, ****p ≤ 0.0001 (two-sided students t-test). e Fold increase of GFP-DSS1WT and GFP-DSS1R57Q foci intensity at sites of TA-KR compared to background was quantified (n = 10, mean ± SD) under the treatment of siDSS1 and siBRCA2. Statistical analysis was done with the two-sided students t-test, ns not significant. f Representative micrographs of PLA foci (red) of DSS1 (α-GFP) and R-loop (S9.6) in the nuclei of HeLa-shDSS1 cells stably expressing GFP-DSS1WTres, GFP-DSS11-54res or GFP-DSS1R57Qres after the treatment of CPT (10 μM; 2 h) (left). Blue: DAPI. Green: GFP-DSS1. The foci formation was analyzed over 200 cells using ImageJ. Symbol: EV empty vector with GFP. au arbitrary unit. Scale bar: 10 μm. Average values (±SEM) of PLA intensity for 500 nuclei from three independent experiments (right) were plotted. Statistical analysis was done with the two-sided student's t-test, ****P ≤ 0.0001. g Quantification (mean ± SEM) of enrichment of R-loop (detected by S9.6 antibody) into genomic DNA of HeLa-shDSS1 cells stably expressing GFP-DSS1WTres, GFP-DSS11-54res, or GFP-DSS1R57Qres after the treatment of CPT (10 μM; 2 h). au arbitrary unit. Statistical analysis was done from three independent experiments with the two-sided student's t-test, ****p ≤ 0.0001. Source data are provided as a Source Data file.
Fig. 7
Fig. 7. Model for DSS1 in shutting down DNA binding ability of HDOB1 to promote BRCA2’s functions.
In this model, DSS1, in an encircling arrangement around the HD and OB1 domains of BRCA2 DBD, locks the DBD-DSS1 complex in a closed conformation and shuts down the ds/ssDNA binding ability of HDOB1. Our work demonstrates that this conformation restrains the ability of BRCA2 DBD to engage with dsDNA, thereby facilitating BRCA2/RAD51 loading on ssDNA to promote HR and RFP and also suppress the accumulation of R-loops. Conversely, mutations within the DSS1 C-terminal helix led to an open conformation of BRCA2-DSS1 and released its undesired dsDNA binding capability in BRCA2 DBD, consequently diminishing the effectiveness of BRCA2-DSS1 in promoting HR and RFP, and in R-loop suppression.

References

    1. Wooster, R. et al. Identification of the breast cancer susceptibility gene BRCA2. Nature378, 789–792 (1995). 10.1038/378789a0 - DOI - PubMed
    1. Gayther, S. A. et al. Variation of risks of breast and ovarian cancer associated with different germline mutations of the BRCA2 gene. Nat. Genet.15, 103–105 (1997). 10.1038/ng0197-103 - DOI - PubMed
    1. Wong, A. K., Pero, R., Ormonde, P. A., Tavtigian, S. V. & Bartel, P. L. RAD51 interacts with the evolutionarily conserved BRC motifs in the human breast cancer susceptibility gene brca2. J. Biol. Chem.272, 31941–31944 (1997). 10.1074/jbc.272.51.31941 - DOI - PubMed
    1. Esashi, F. et al. CDK-dependent phosphorylation of BRCA2 as a regulatory mechanism for recombinational repair. Nature434, 598–604 (2005). 10.1038/nature03404 - DOI - PubMed
    1. San Filippo, J., Sung, P. & Klein, H. Mechanism of eukaryotic homologous recombination. Annu. Rev. Biochem.77, 229–257 (2008). 10.1146/annurev.biochem.77.061306.125255 - DOI - PubMed

MeSH terms

LinkOut - more resources