

Comparative analysis of delivered and planned doses in target volumes for lung stereotactic ablative radiotherapy
- PMID: 39152502
- PMCID: PMC11330152
- DOI: 10.1186/s13014-024-02505-7
Comparative analysis of delivered and planned doses in target volumes for lung stereotactic ablative radiotherapy
Abstract
Background: Adaptive therapy has been enormously improved based on the art of generating adaptive computed tomography (ACT) from planning CT (PCT) and the on-board image used for the patient setup. Exploiting the ACT, this study evaluated the dose delivered to patients with non-small-cell lung cancer (NSCLC) patients treated with stereotactic ablative radiotherapy (SABR) and derived relationship between the delivered dose and the parameters obtained through the evaluation procedure.
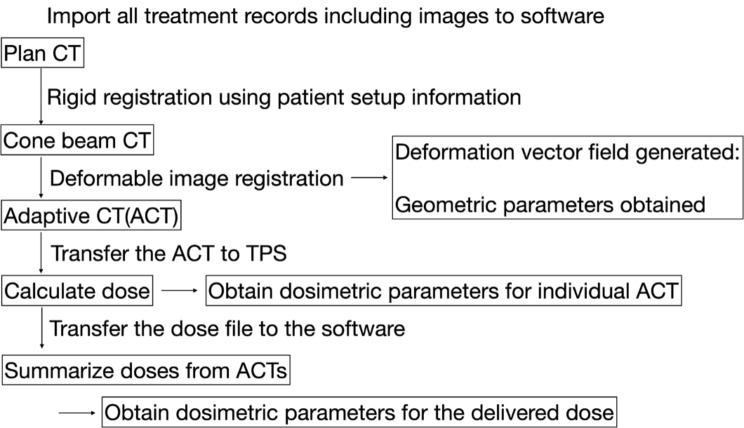
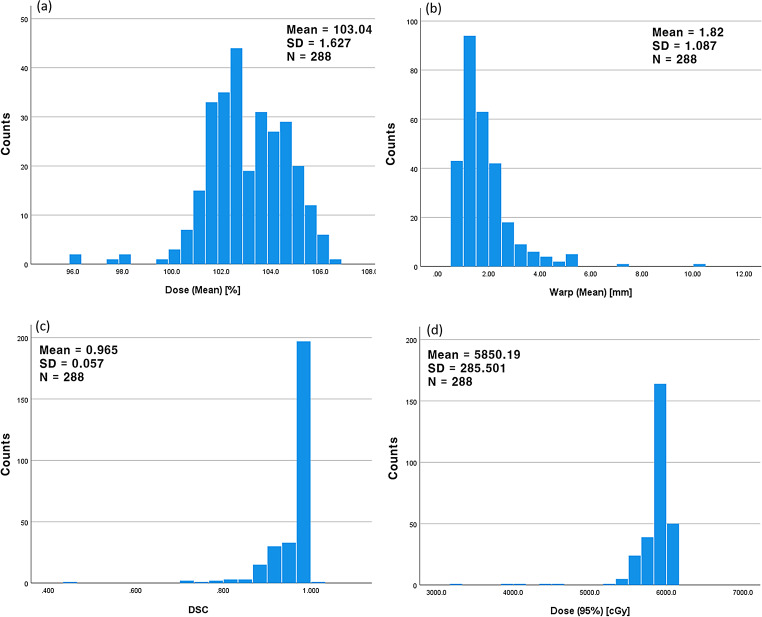
Methods: SABR treatment records of 72 patients with NSCLC who were prescribed a dose of 60 Gy (Dprescribed) to the 95% volume of the planning target volume (PTV) in four fractions were analysed in this retrospective study; 288 ACTs were generated by rigid and deformable registration of a PCT to a cone-beam computed tomography (CBCT) per fraction. Each ACT was sent to the treatment planning system (TPS) and treated as an individual PCT to calculate the dose. Delivered dose to a patient was estimated by averaging four doses calculated from four ACTs per treatment. Through the process, each ACT provided the geometric parameters, such as mean displacement of the deformed PTV voxels (Warpmean) and Dice similarity coefficient (DSC) from deformation vector field, and dosimetric parameters, e.g. difference of homogeneity index (ΔHI, HI defined as (D2%-D98%)/Dprescribed*100) and mean delivered dose to the PTV (Dmean), obtained from the dose statistics in the TPS. Those parameters were analyzed using multiple linear regression and one-way-ANOVA of SPSS® (version 27).
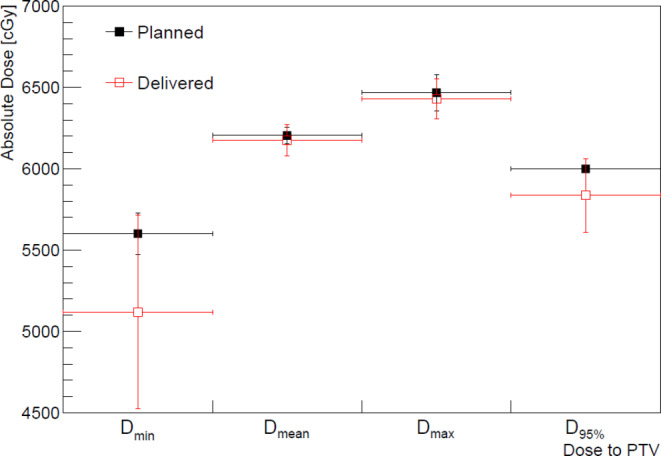
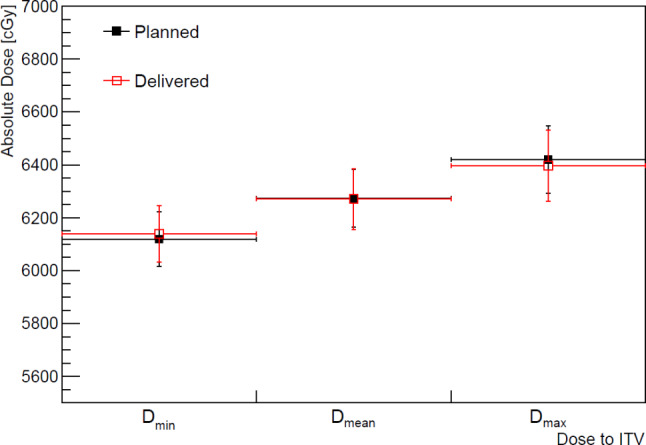
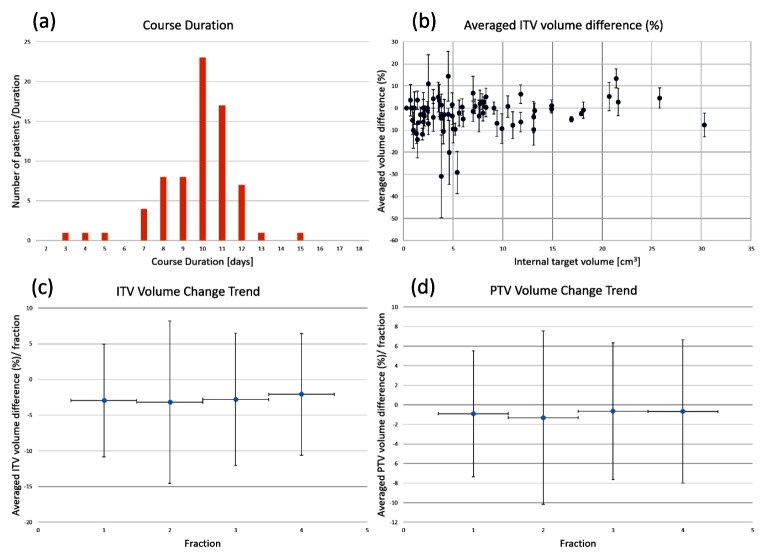
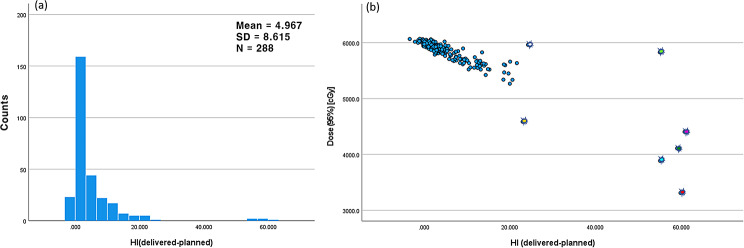
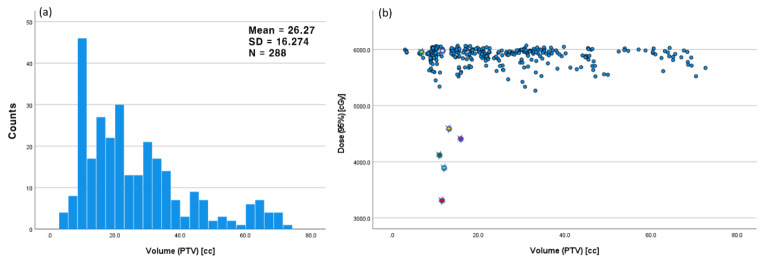
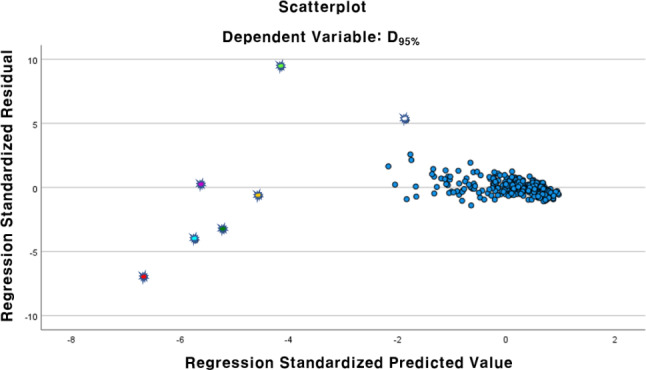
Results: The prescribed dose was confirmed to be fully delivered to internal target volume (ITV) within maximum difference of 1%, and the difference between the planned and delivered doses to the PTV was agreed within 6% for more than 95% of the ACT cases. Volume changes of the ITV during the treatment course were observed to be minor in comparison of their standard deviations. Multiple linear regression analysis between the obtained parameters and the dose delivered to 95% volume of the PTV (D95%) revealed four PTV parameters [Warpmean, DSC, ΔHI between the PCT and ACT, Dmean] and the PTV D95% to be significantly related with P-values < 0.05. The ACT cases of high ΔHI were caused by higher values of the Warpmean and DSC from the deformable image registration, resulting in lower PTV D95% delivered. The mean values of PTV D95% and Warpmean showed significant differences depending on the lung lobe where the tumour was located.
Conclusions: Evaluation of the dose delivered to patients with NSCLC treated with SABR using ACTs confirmed that the prescribed dose was accurately delivered to the ITV. However, for the PTV, certain ACT cases characterised by high HI deviations from the original plan demonstrated variations in the delivered dose. These variations may potentially arise from factors such as patient setup during treatment, as suggested by the statistical analyses of the parameters obtained from the dose evaluation process.
Keywords: Adaptive CT; Deformable image registration; Dose evaluation; Lung SABR.
© 2024. The Author(s).
Conflict of interest statement
The authors declare no competing interests.
Figures
Similar articles
-
Technical Note: Dosimetric evaluation of Monte Carlo algorithm in iPlan for stereotactic ablative body radiotherapy (SABR) for lung cancer patients using RTOG 0813 parameters.J Appl Clin Med Phys. 2015 Jan 8;16(1):5058. doi: 10.1120/jacmp.v16i1.5058. J Appl Clin Med Phys. 2015. PMID: 25679161 Free PMC article.
-
Assessment of Monte Carlo algorithm for compliance with RTOG 0915 dosimetric criteria in peripheral lung cancer patients treated with stereotactic body radiotherapy.J Appl Clin Med Phys. 2016 May 8;17(3):277-293. doi: 10.1120/jacmp.v17i3.6077. J Appl Clin Med Phys. 2016. PMID: 27167284 Free PMC article.
-
Accumulation of the delivered dose based on cone-beam CT and deformable image registration for non-small cell lung cancer treated with hypofractionated radiotherapy.BMC Cancer. 2020 Nov 16;20(1):1112. doi: 10.1186/s12885-020-07617-3. BMC Cancer. 2020. PMID: 33198676 Free PMC article.
-
Robust optimization in lung treatment plans accounting for geometric uncertainty.J Appl Clin Med Phys. 2018 May;19(3):19-26. doi: 10.1002/acm2.12291. Epub 2018 Mar 10. J Appl Clin Med Phys. 2018. PMID: 29524301 Free PMC article. Review.
-
Exposure of the heart in lung cancer radiation therapy: A systematic review of heart doses published during 2013 to 2020.Radiother Oncol. 2022 Jul;172:118-125. doi: 10.1016/j.radonc.2022.05.007. Epub 2022 May 13. Radiother Oncol. 2022. PMID: 35577022
References
Publication types
MeSH terms
Grants and funding
LinkOut - more resources
Full Text Sources
Medical
