. 2024 Nov;99(11):2096-2107.
doi: 10.1002/ajh.27459. Epub 2024 Aug 17.

Intra-tumoral and peripheral blood TIGIT and PD-1 as immune biomarkers in nodular lymphocyte predominant Hodgkin lymphoma

Affiliations

Intra-tumoral and peripheral blood TIGIT and PD-1 as immune biomarkers in nodular lymphocyte predominant Hodgkin lymphoma

Jay Gunawardana et al. Am J Hematol. 2024 Nov.

Abstract

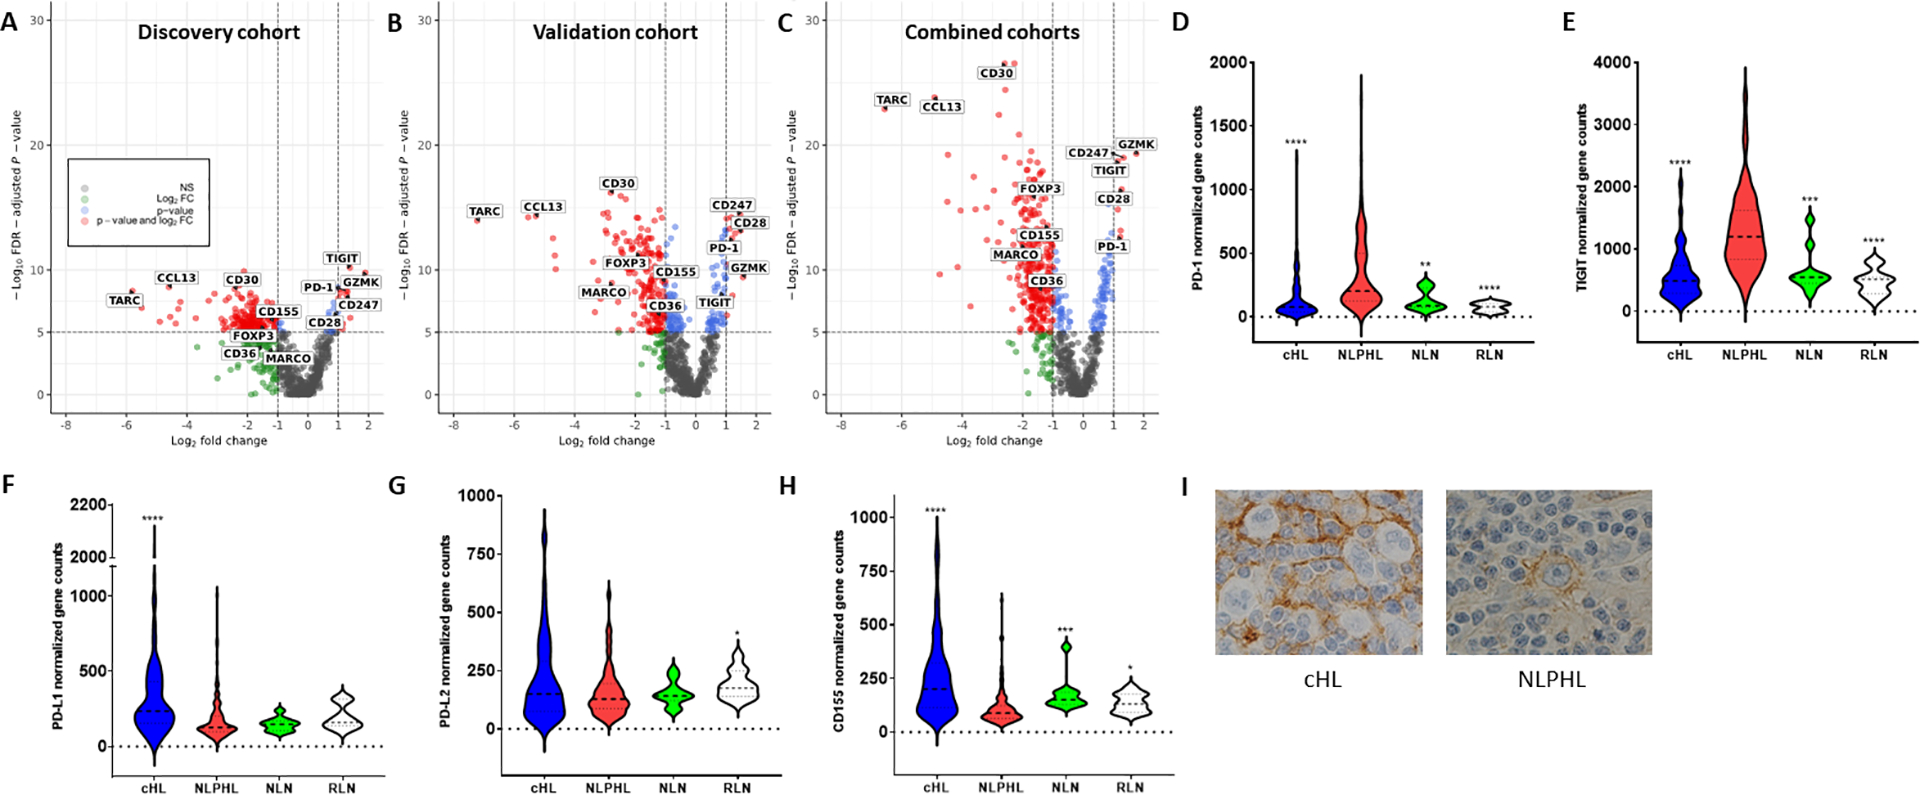
In classical Hodgkin lymphoma (cHL), responsiveness to immune-checkpoint blockade (ICB) is associated with specific tumor microenvironment (TME) and peripheral blood features. The role of ICB in nodular lymphocyte predominant Hodgkin lymphoma (NLPHL) is not established. To gain insights into its potential in NLPHL, we compared TME and peripheral blood signatures between HLs using an integrative multiomic analysis. A discovery/validation approach in 121 NLPHL and 114 cHL patients highlighted >2-fold enrichment in programmed cell death-1 (PD-1) and T-cell Ig and ITIM domain (TIGIT) gene expression for NLPHL versus cHL. Multiplex imaging showed marked increase in intra-tumoral protein expression of PD-1+ (and/or TIGIT+) CD4+ T-cells and PD-1+CD8+ T-cells in NLPHL compared to cHL. This included T-cells that rosetted with lymphocyte predominant (LP) and Hodgkin Reed-Sternberg (HRS) cells. In NLPHL, intra-tumoral PD-1+CD4+ T-cells frequently expressed TCF-1, a marker of heightened T-cell response to ICB. The peripheral blood signatures between HLs were also distinct, with higher levels of PD-1+TIGIT+ in TH1, TH2, and regulatory CD4+ T-cells in NLPHL versus cHL. Circulating PD-1+CD4+ had high levels of TCF-1. Notably, in both lymphomas, highly expanded populations of clonal TIGIT+PD-1+CD4+ and TIGIT+PD-1+CD8+ T-cells in the blood were also present in the TME, indicating that immune-checkpoint expressing T-cells circulated between intra-tumoral and blood compartments. In in vitro assays, ICB was capable of reducing rosette formation around LP and HRS cells, suggesting that disruption of rosetting may be a mechanism of action of ICB in HL. Overall, results indicate that further evaluation of ICB is warranted in NLPHL.


Conflict of interest statement

E.A.H: Research funding to institution; Bristol Myers Squibb, Merck KgA, Astra Zeneca, Roche, Advisory board: Roche*, Antigene*, Bristol Myers Squibb, Astra Zeneca, Novartis*, Merck Sharpe Dohme*, Gilead*, Beigene* (*paid to institution) Speakers fees: Roche*, Astra Zeneca*, Abbvie*, Janssen, Regeneron, (*paid to institution) Consultancy: Regeneron, Bristol Myers Squibb, Specialized therapeutics. D.T: research funding from Roche, Janssen and Beigene, and honoraria from CSL, Antengene, Roche, Beigene, Amgen, and EUSA Pharma. M.K.G.: honoraria from Novartis, Gilead. F.V. receives research funding from Caribou, Allogene, Geron corporation and received in the last 3 years honoraria from Oakstone Medical Publishing, i3Health, Elsevier, America Registry of Pathology, Congressionally Directed Medical Research Program, Society of Hematology Oncology and National Research Foundation of Singapore (28th Competitive Research Program Whitepapers). E.B: consultancy Abbvie, Astellas, Gilead, IQVIA, MSD, Novartis and Bastion Brands, Research funding MSD. MRG: research funding from Sanofi, Kite/Gilead, Abbvie and Allogene; consulting for Abbvie, Allogene and Bristol Myers Squibb; honoraria from BMS, Daiichi Sankyo and DAVA Oncology; and stock ownership of KDAc Therapeutics.

Figures

Figure 1.
Figure 1.. Transcriptome expression of PanCancer immune-related genes in NLPHL and cHL.
Volcano plots (corrected for false discovery rate adjusted Wilcoxon tests) were used to calculate statistical significance between genes showing differentially expressed genes in NLPHL in comparison to cHL (A) Discovery cohort (NLPHL n=56 and cHL n=54); (B) Validation cohort (NLPHL n=65 and cHL n=60); (C) Combined (discovery and validation; NLPHL n=121 and cHL n=114) cohort. Violin plots showing the distribution of normalized gene counts of the immune-checkpoints in the combined cohorts (NLPHL n=121 and cHL n=114) (D) PD-1 and (E) TIGIT, and their respective immune-checkpoint ligands (F) PD-L1, (G) PD-L2, (H) CD155 in cHL, NLPHL, NLN and RLN. (I) Representative IHC images (100x resolution) showing CD155 expression on malignant cells. Asterisks denote significance: *P < 0.05; **P < 0.01; ***P < 0.001; ****P < 0.0001 using a Mann-Whitney rank sum test. Error bars, mean with SE.
Figure 2.
Figure 2.. Multispectral microscopy and multiplex tissue micro-array.
Multispectral microscopy in cHL and NLPHL tissues with (A) Representative images of malignant HL cells with PD-1+ and TIGIT+ T-cells. Nucleated cells are stained with 4′,6-diamidino-2-phenylindole (DAPI) in dark blue. In 12 cHL and 19 NLPHL tissues, histograms show: (B) Total numbers of CD4+ and CD8+ T-cells. (C) Proportion of rosetting CD4+ and CD8+ PD-1+ and TIGIT+ T-cells. (D) Proportion of interspersed CD4+ and CD8+ PD-1+ and TIGIT+ T-cells. Multiplex tissue micro-array in NLPHL with (E) Representative images of LP cells with PD-1+, ICOS+ and TCF-1+ T-cells. Nucleated cells are stained with DAPI in dark blue. (F) Proportion of rosetting CD4+ T-cells expressing ICOS and PD-1. (G) Proportion of TFH CD4+ T-cells amongst rosetting and interspersed CD4+ T-cells expressing CD57. (H) Proportion of PD-1+ rosetting and interspersed CD8+ T-cells expressing TCF-1. Mann–Whitney test was used to determine differences between two independent groups.
Figure 3.
Figure 3.. Proportion of T-cell subsets expressing PD-1 and/or TIGIT.
PBMC obtained from 10 healthy participants and pre-therapy PBMC from 12 cHL and 14 NLPHL patients were analyzed by flow cytometry for the expression of PD-1 and TIGIT in (A) CD8+ T-cells, (B) TH1, (C) TH2, and (D) Treg. Asterisks denote significance: *P < 0.05, **P < 0.01, ***P < 0.001. HC; healthy control, NS; not significant.
Figure 4.
Figure 4.. T-cell clonal analysis in intra-tumoral and peripheral blood compartments, and functional assays in response to PD-1 and/or TIGIT immune-checkpoint blockade.
Ten NLPHL and 8 cHL FFPE tumors with matched pre-therapy PBMCs were FACS sorted into CD4+ and CD8+ T-cell subsets based on PD-1 and TIGIT expression. Extracted DNA from all samples was subjected to TCRβ-chain sequencing. The mean proportion of intra-tumoral T-cell clones (i.e. present within the TME) that were shared with the PBMC were: 10.2% (SE 3.5%) and 8.9% (SE 1.3%) for cHL and NLPHL respectively (p>0.9). (A) Phenotyping of the FACS sorted PBMC. (B) In each subset, the mean number of T-cell clones that were shared with matched tumors (i.e. intra-tumoral T-cells) were assessed. (C) The percentage of top 100 (CumFreq-100) shared T-cell clones within FACS sorted subsets. Rosettes were quantified after treatment with immune-checkpoint blockade (ICB): either anti-PD-1 alone, anti-TIGIT alone or dual anti-PD-1/TIGIT neutralizing antibodies with either (D) DEV (NLPHL) or (E) KM-H2 (cHL) used as the malignant cell-line. As KM-H2 expresses HLA-II, PBMC was HLA-II matched (whereas DEV does not express HLA-I/II at the cell surface). Each value represents the average of 5 unmatched (DEV) and 3 HLA-II matched (KM-H2) healthy donors used in the co-culture assay. (F) A representative immunofluorescent image (40x magnification) showing lymphocytes (stained with DAPI) that are in contact with DEV (stained with deep red cell tracer) include TFH cells (CD57+). *denotes significance compared to isotype control: *P < 0.05. (G) T-cell receptor and CD155/CD226-induced T-cell activation measured by bioluminescence after treatment with either anti-PD-1 alone, anti-TIGIT alone or dual anti-PD-1/TIGIT neutralizing antibodies. PD-L1/CD155-expressing CHO-K1 cells were used as the test, the PD-L1-/CD155- Raji cell line as the negative control, and CD4 Jurkats alone as the T-cell effector line. The fold change difference in T-cell activity is shown compared to relevant isotype negative controls. Each value represents the average of two independent experiments run in triplicate. * denotes significance compared to isotype control, # denotes significance between relevant histograms: **## P < 0.01; ****#### P < 0.0001. Error bars, mean with SE.

References

    1. Alaggio R, Amador C, Anagnostopoulos I, et al. The 5th edition of the World Health Organization Classification of Haematolymphoid Tumours: Lymphoid Neoplasms. Leukemia. 2022;36(7):1720–1748. - PMC - PubMed
    1. Eichenauer DA, Engert A. Nodular lymphocyte-predominant Hodgkin lymphoma: a unique disease deserving unique management. Hematology Am Soc Hematol Educ Program. 2017;2017(1):324–328. - PMC - PubMed
    1. Hartmann S, Eichenauer DA, Plutschow A, et al. The prognostic impact of variant histology in nodular lymphocyte-predominant Hodgkin lymphoma: a report from the German Hodgkin Study Group (GHSG). Blood. 2013;122(26):4246–4252; quiz 4292. - PubMed
    1. Campo E, Jaffe ES, Cook JR, et al. The International Consensus Classification of Mature Lymphoid Neoplasms: a report from the Clinical Advisory Committee. Blood. 2022;140(11):1229–1253. - PMC - PubMed
    1. Savage KJ, Mottok A, Fanale M. Nodular lymphocyte-predominant Hodgkin lymphoma. Semin Hematol. 2016;53(3):190–202. - PubMed