. 2024 Aug 17;96(34):13888-13896.
doi: 10.1021/acs.analchem.4c01958. Online ahead of print.

Modular Chip-Based nanoSFC-MS for Ultrafast Separations

Affiliations

Modular Chip-Based nanoSFC-MS for Ultrafast Separations

Chris Weise et al. Anal Chem. .

Abstract

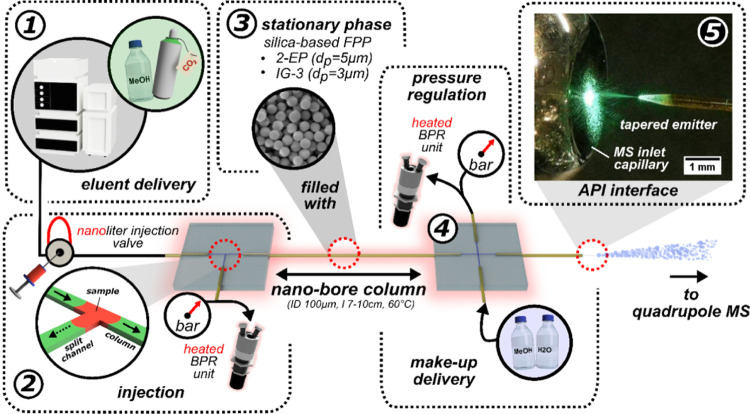
This study presents the development of a miniaturized device for supercritical fluid chromatography coupled with mass spectrometry. The chip-based, modular nanoSFC approach utilizes a particle-packed nanobore column embedded between two monolithically structured glass chips. A microtee in the pre-column section ensures picoliter sample loads onto the column, while a microcross chip structure fluidically controls the column backpressure. The restrictive emitter and the minimal post-column volume of 16 nL prevent mobile phase decompression and analyte dilution, maintaining chromatographic integrity during transfer to the atmospheric pressure MS interface. This facilitates high-speed chiral separations in less than 80 s with high reproducibility.


Conflict of interest statement

The authors declare no competing financial interest.

Figures

Figure 1
Figure 1
Photographic images of the SLE-manufactured glass-based chip modules used in this contribution. (A, C) Macroscopic view of chip modules with a microscopic insight view of (B) microcross structure. Insights of outgoing channel of microcross structure with (D) straight channel and (E) tapered channel design. All images were taken without the fused silica capillaries connected to the modules.
Figure 2
Figure 2
Schematic representation of the modular chip-based nanoSFC–MS setup. (1) SFC pump for eluent delivery, (2) chip module with microtee structure for sample injection, (3) packed nanobore column for separation, (4) chip module with microcross structure in the post-column section for pressure regulation and make-up delivery, and (5) restrictive emitter with a tapered tip for atmospheric pressure coupling to single quadrupole MS. Pressure sensors in the pre- and post-column sections monitor the pressure drop across the nanobore column. Detailed capillary dimensions are provided in Figures S3 and S4.
Figure 3
Figure 3
Visual and fluorescence examination of the microcross chip module (A) Microscopic images of the microcross chip module showing the phase boundary between the incoming primary (eluent) stream (F = 1 mL/min, inlet pressure = 120 bar, 50:50 v/v CO2:MeOH, room temperature) and the make-up stream (F = 8 μL/min, 90:10 v/v MeOH:H2O, 0.1% FA). Injections of a fluorescent sample plug (7-amino-4-methyl-coumarin (c120), c = 500 μM dissolved in MeOH) (B) into the make-up stream and (C) into the primary (eluent) stream to visualize the mass transfer within the microcross chip module. Cross configuration: eluent 90° to make-up, eluent 180° to split channel, SP stands for split channel.
Figure 4
Figure 4
Inspecting the split behavior of the microcross chip module. Microscopic view of the microcross under different make-up flow conditions: (A) 1.5 μL/min, split channel open, split ratio 1:0.9 and (B) 12 μL/min, split channel temporarily closed, split ratio 1:63. Numeric labels indicate the positions for the fluorescence detection during signal tracing (7-amino-4-methyl-coumarine (c120), c = 100 μM dissolved in MeOH). (C) FLD chromatograms acquired at the inlet (A1/B1), emitter (A2/B2), and split channel (A3/B3) illustrate the differences in signal integrity at the emitter channel. Instrumental parameter: primary flow: 50:50 v/v CO2:MeOH eluent, 120 bar, make-up: 90:10 v/v MeOH:H2O, restrictor: ID 20 μm, length 80 cm, no column.
Figure 5
Figure 5
MS sensitivity of the microcross chip module. The MS performance of three different fluidic configurations: (A) eluent 90° to the emitter, (B) eluent 180° to the make-up, and (C) eluent 180° to the emitter are compared in (D). MS sensitivities were based on the signal recovery of three consecutive dl-α-tocopherol injections (c = 100 μM, including 1 mM ergocalciferol as an internal standard). The relative signal recovery [%] was calculated from the ratio of the peak area of both mixture compounds. The corresponding calibration curve is shown in the Figure S10). Results of an unpaired t test are shown for all combinations. Instrumental parameter: mobile phase 90:10 v/v CO2:MeOH, inlet p = 120 bar, no column was used. MS parameter: positive ion mode, SIM scans recorded at 473m/z (for dl-α-tocopherol as [M + H]+) and 397.5m/z (for ergocalciferol as [M + H]+).
Figure 6
Figure 6
Assessment of the MS sensitivity of the microcross chip module under different mass flow conditions. The geometry of the given capillary restrictor was adjusted to set different mass flows. (A) Impact of restrictor length and inner diameter on MS response of dl-α-tocopherol [M + H]+ 473 m/z. (B) Overlay of SIM chromatograms of dl-α-tocopherol [M + H]+ 473 m/z for different lengths of an ID 10 μm restrictor. Mobile phase 90:10 v/v CO2:MeOH, inlet p = 120 bar, no column was used, make-up: 1.5 μL/min 90:10 v/v MeOH:H2O, 0.1% FA, microcross configuration eluent 180° to the emitter (Figure 5C).
Figure 7
Figure 7
nanoSFC of fat- and water-soluble vitamins, sample: (1) dl-α-tocopherol (α-TOCO, 473 m/z, fragmentor: 300 V), (2) ergocalciferol (ERGO, 397.5 m/z, 275 V), (3) nicotinamide (NICO, 123 m/z, 200 V), and (4) pyridoxine (PYR, 170 m/z, 200 V) dissolved in MeOH, eluent: 90:10 v/v CO2:MeOH, column: 8 cm, 2-EP, dp = 5 μm, t = 60 °C, inlet p = 200 bar, outlet p = 110 bar, cross configuration: eluent 180° to the emitter, make-up: 1.5 μL/min 90:10 v/v MeOH:H2O, 0.1%FA, emitter: tapered, 7 cm, ID = 10 μm, MS parameter: BPC of all for [M + H]+ at 4 Hz, separation efficiency (N) was calculated based on pyridine, peak smoothing was applied, chromatograms generated during modifier optimization are found in Figure S11E.
Figure 8
Figure 8
Chiral separation of racemic mixture of warfarin, sample: 500 μM warfarin dissolved in MeOH, eluent: 65:35 v/v CO2:MeOH, column: 10 cm, IG-3, dp = 3 μm, t = 60 °C, inlet p = 220 bar, outlet p = 85 bar, make-up: 1.5 μL/min 80:20 MeOH:H2O, 0.1%FA, emitter: tapered, length 7 cm, ID = 10 μm, MS parameter: SIM scan of 309 m/z, [M + H]+, fragmentor 200 V, 8 Hz, peak smoothing was applied.

References

    1. Riley N. M.; Hebert A. S.; Coon J. J. Cell Syst. 2016, 2, 142.10.1016/j.cels.2016.03.002. - DOI - PubMed
    1. Vervoort N.; Goossens K.; Baeten M.; Chen Q. ASA 2021, 2, 109.10.1002/ansa.202000155. - DOI - PMC - PubMed
    1. Welch C. J. React. Chem. Eng. 2019, 4, 1895.10.1039/C9RE00234K. - DOI
    1. Patel D. C.; Breitbach Z. S.; Wahab M. F.; Barhate C. L.; Armstrong D. W. Anal. Chem. 2015, 87, 9137.10.1021/acs.analchem.5b00715. - DOI - PubMed
    1. Patel D. C.; Wahab M. F.; O’Haver T. C.; Armstrong D. W. Anal. Chem. 2018, 90, 3349.10.1021/acs.analchem.7b04944. - DOI - PubMed

LinkOut - more resources