DIY adapting SEM for low-voltage TEM imaging
- PMID: 39153006
- PMCID: PMC11652795
- DOI: 10.1002/jemt.24679
DIY adapting SEM for low-voltage TEM imaging
Abstract
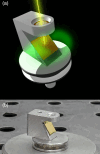
Electron microscopy is essential for examining materials and biological samples at microscopic levels, providing detailed insights. Achieving high-quality imaging is often challenged by the potential damage high-energy beams can cause to sensitive samples. This study compares scanning electron microscopy (SEM) and transmission electron microscopy (TEM) to evaluate image quality, noise levels, and the ability to preserve delicate specimens. We used a modified SEM system with a transmitted electrons conversion accessory, allowing it to operate like a TEM but at lower voltages, thereby reducing sample damage. Our analysis included quantitative assessments of noise levels and texture characteristics such as entropy, contrast, dissimilarity, homogeneity, energy, and correlation. This comprehensive evaluation directly compared traditional TEM and the adapted SEM system across various images. The results showed that TEM provided images with higher clarity and significantly lower noise levels, reinforcing its status as the preferred method for detailed studies. However, the modified SEM system also produced high-quality images at very low acceleration voltages, which is crucial for imaging samples sensitive to high-energy exposure. The texture metrics analysis highlighted the strengths and limitations of each method, with TEM images exhibiting lower entropy and higher homogeneity, indicating smoother and more uniform textures. This study emphasizes the importance of selecting the appropriate electron microscopy method based on research needs, such as sample sensitivity and required detail level. With its conversion accessory, the modified SEM system is a versatile and valuable tool, offering a practical alternative to TEM for various applications. This research enhances our understanding of the capabilities and limitations of SEM and TEM. It paves the way for further innovations in electron microscopy techniques, improving their applicability for studying sensitive materials. RESEARCH HIGHLIGHTS: Our study introduces a modified SEM adapter enabling TEM-like imaging at reduced voltages, effectively minimizing sample damage without compromising image resolution. Through comparative analysis, we found that images from the modified SEM closely match the quality of traditional TEM, showcasing significantly lower noise levels. This advancement underscores the SEM's enhanced capability for detailed structural analysis of sensitive materials, broadening its utility across materials science and biology.
Keywords: SEM vs. TEM; electron microscopy; image quality; low‐voltage imaging; noise analysis; sample sensitivity.
© 2024 The Author(s). Microscopy Research and Technique published by Wiley Periodicals LLC.
Figures


References
-
- Brostrom, A. , & Molhave, K. (2022). Spatial image resolution assessment by Fourier analysis (SIRAF). Microscopy and Microanalysis, 3, 1–9. - PubMed
-
- de Chaumont, F. , Dallongeville, S. , Chenouard, N. , Herve, N. , Pop, S. , Provoost, T. , Meas‐Yedid, V. , Pankajakshan, P. , Lecomte, T. , Le Montagner, Y. , Lagache, T. , Dufour, A. , & Olivo‐Marin, J. C. (2012). Icy: An open bioimage informatics platform for extended reproducible research. Nature Methods, 9(7), 690–696. - PubMed
-
- Eisaku Oho, T. S. , Adachi, K. , Muranaka, Y. , & Kanaya, K. (1987). An inexpensive and highly efficient device for observing a transmitted electron image in SEM. Journal of Electron Microscopytechnique, 5, 8.
-
- Haoran Wang, S. L. , Ding, J. , Li, S. , Dong, L. , & Zhaolin, L. (2022). SEM image quality assessment based on intuitive morphology and deep semantic features. IEEE Access, 10, 11.
-
- Harris, C. R. , Millman, K. J. , van der Walt, S. J. , Gommers, R. , Virtanen, P. , Cournapeau, D. , Wieser, E. , Taylor, J. , Berg, S. , Smith, N. J. , Kern, R. , Picus, M. , Hoyer, S. , van Kerkwijk, M. H. , Brett, M. , Haldane, A. , Del Rio, J. F. , Wiebe, M. , Peterson, P. , … Oliphant, T. E. (2020). Array programming with NumPy. Nature, 585(7825), 357–362. - PMC - PubMed
Publication types
MeSH terms
LinkOut - more resources
Full Text Sources

