. 2024 Sep:107:105285.
doi: 10.1016/j.ebiom.2024.105285. Epub 2024 Aug 16.

Exploring antidiabetic drug targets as potential disease-modifying agents in osteoarthritis

Affiliations

Exploring antidiabetic drug targets as potential disease-modifying agents in osteoarthritis

Kai Fu et al. EBioMedicine. 2024 Sep.

Abstract

Background: Osteoarthritis is a leading cause of disability, and disease-modifying osteoarthritis drugs (DMOADs) could represent a pivotal advancement in treatment. Identifying the potential of antidiabetic medications as DMOADs could impact patient care significantly.

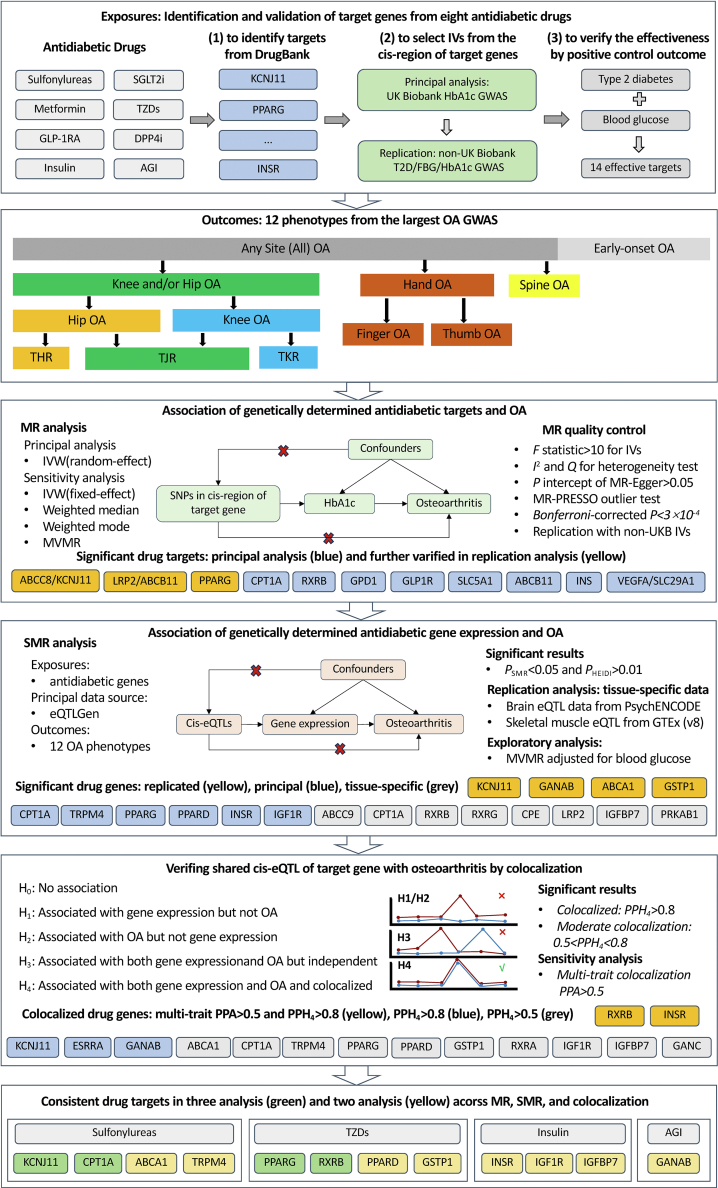
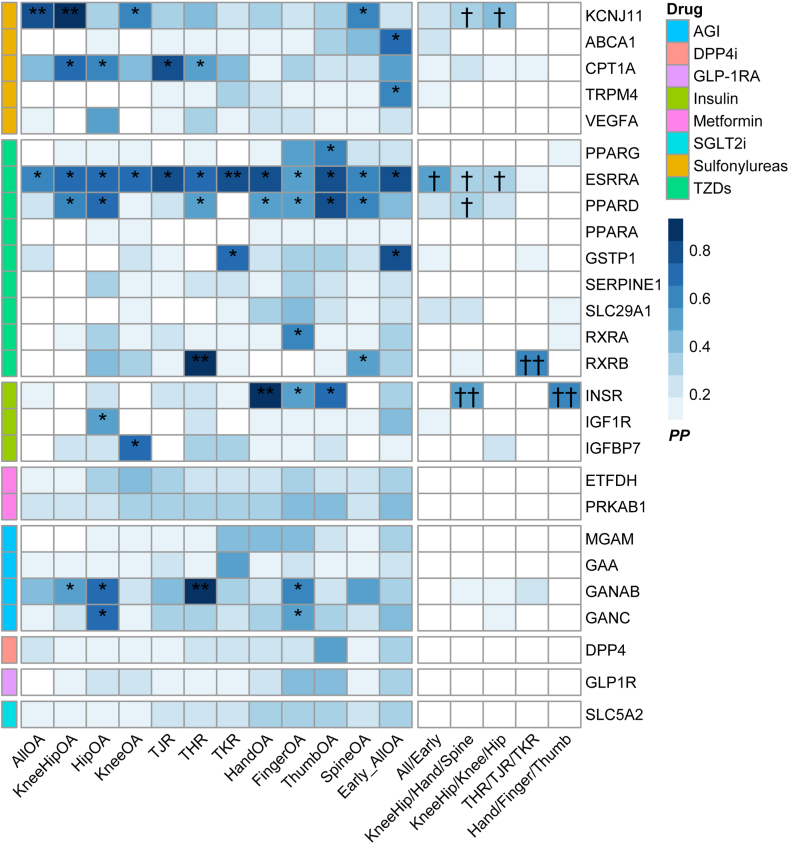
Methods: We designed a comprehensive analysis pipeline involving two-sample Mendelian Randomization (MR) (genetic proxies for antidiabetic drug targets), summary-based MR (SMR) (for mRNA), and colocalisation (for drug-target genes) to assess their causal relationship with 12 osteoarthritis phenotypes. Summary statistics from the largest genome-wide association meta-analysis (GWAS) of osteoarthritis and gene expression data from the eQTLGen consortium were utilised.

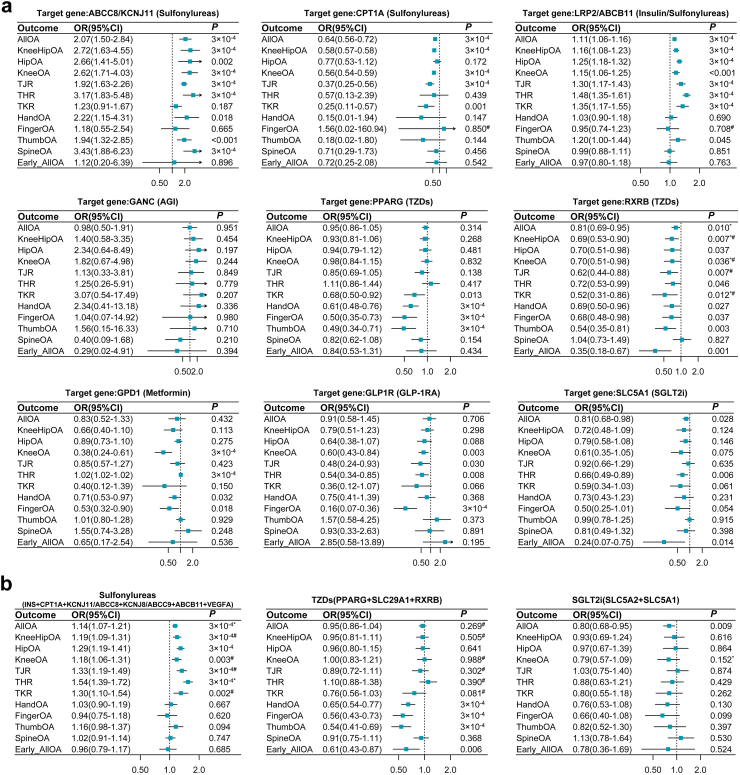
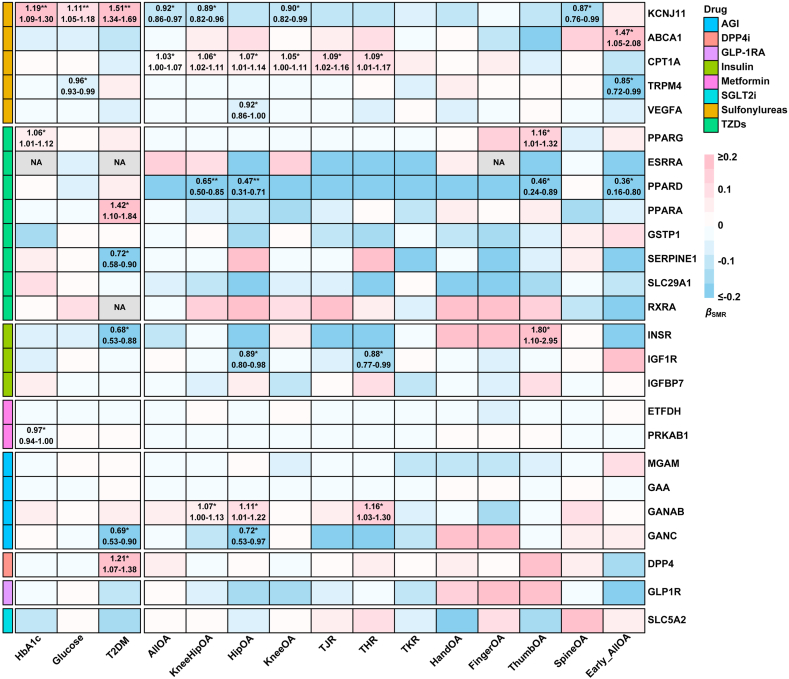
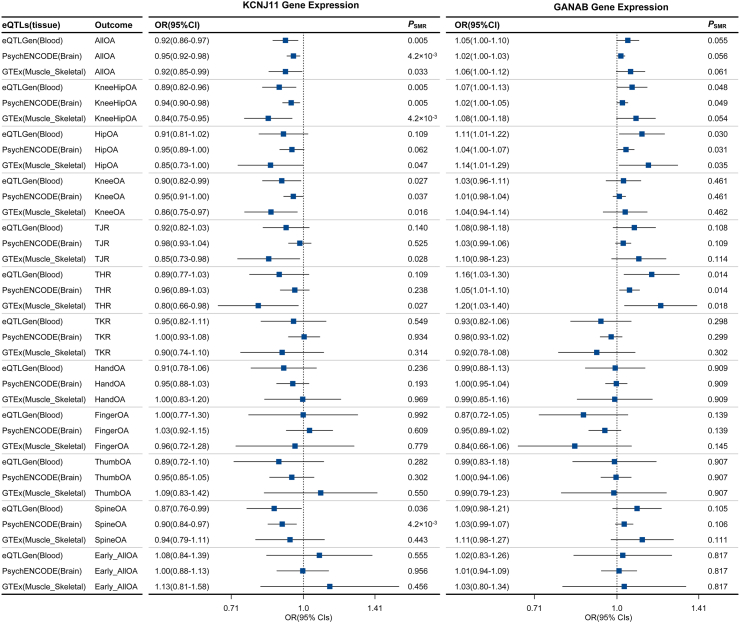
Findings: Seven out of eight major types of clinical antidiabetic medications were identified, resulting in fourteen potential drug targets. Sulfonylurea targets ABCC8/KCNJ11 were associated with increased osteoarthritis risk at any site (odds ratio (OR): 2.07, 95% confidence interval (CI): 1.50-2.84, P < 3 × 10⁻⁴), while PPARG, influenced by thiazolidinediones (TZDs), was associated with decreased risk of hand (OR: 0.61, 95% CI: 0.48-0.76, P < 3 × 10⁻⁴), finger (OR: 0.50, 95% CI: 0.35-0.73, P < 3 × 10⁻⁴), and thumb (OR: 0.49, 95% CI: 0.34-0.71, P < 3 × 10⁻⁴) osteoarthritis. Metformin and GLP1-RA, targeting GPD1 and GLP1R respectively, were associated with reduced risk of knee and finger osteoarthritis. In the SMR analyses, gene expression of KCNJ11, GANAB, ABCA1, and GSTP1, targeted by antidiabetic drugs, was significantly linked to at least one osteoarthritis phenotype and was replicated across at least two gene expression datasets. Additionally, increased KCNJ11 expression was related to decreased osteoarthritis risk and co-localised with at least one osteoarthritis phenotype.

Interpretation: Our findings suggest a potential therapeutic role for antidiabetic drugs in treating osteoarthritis. The results indicate that certain antidiabetic drug targets may modify disease progression, with implications for developing targeted DMOADs.

Funding: This study was funded by the Shanghai Municipal Education Commission-Gaofeng Clinical Medicine Grant (2022), the Shanghai Municipal Health Commission Health Industry Clinical Research Project (Grant No. 20224Y0139), Beijing Natural Science Foundation (Grant No. 7244458), and the Postdoctoral Fellowship Program (Grade C) of China Postdoctoral Science Foundation (Grant No. GZC20230130).

Keywords: Antidiabetic drugs; Drug targets; Gene expression; Mendelian randomization; Osteoarthritis.


Conflict of interest statement

Declaration of interests Professor David J. Hunter provides consulting advice to Merck Serono, Pfizer, Lilly, TLCBio, and Novartis, outside the submitted work.

Figures

Fig. 1
Fig. 1
Flowchart illustrating the systematic approach for identifying the association between antidiabetic drug targets and osteoarthritis phenotypes. This flowchart delineates the Mendelian Randomization framework used to assess the causal impact of antidiabetic drug targets on 12 osteoarthritis phenotypes identified from the largest osteoarthritis genome-wide association studies. If two neighbouring target genes shared the same IVs due to being located in the overlapped cis-region, these genes were combined and marked with a slash, as in “ABCC8/KCNJ11.” Abbreviations: OA, Osteoarthritis; MR, Mendelian randomisation; MVMR, multivariable Mendelian randomisation; SMR, summary-based Mendelian randomisation; IVs, instrumental variables; GWAS, genome-wide association studies; IVW, inverse variance weighted; T2DM, type 2 diabetes mellitus; HbA1c, haemoglobin A1C; FBG, fasting blood glucose; SNPs, single nucleotide polymorphisms; PSMR, P-value for SMR analysis; PHEIDI, P-value for heterogeneity in dependent instruments; eQTLs, expression quantitative trait loci; H0–H4, Hypotheses 0–4; PPA, posterior probability; THR, total hip replacement; TJR, total joint replacement; TKR, total knee replacement.
Fig. 2
Fig. 2
Forest plots of the effects of the five antidiabetic drug targets on 12 osteoarthritis phenotypes. All results were derived from the random-effects inverse variance weighted Mendelian Randomization (MR). The effects (ORs) were adjusted to reflect a per-SD decrease in genetically predicted levels of HbA1c when targeting the specific gene with the corresponding drug on the risk of osteoarthritis. Each subtitle identifies the target gene and its associated drug class. Panel a) displays results for individual drug targets, and Panel b) presents results for combined multiple drug targets within a specific drug class. Additional results for other single drug targets are presented in Figure S2. ∗denotes the P < 0.05 for the test of intercept by the MR Egger method. #denotes the P < 0.05 of the Q test for heterogeneity. Abbreviations: OA, Osteoarthritis; THR, total hip replacement; TJR, total joint replacement; TKR, total knee replacement; OR, odds ratio; CI: confidence interval.
Fig. 3
Fig. 3
Gene expression analysis of antidiabetic drug targets and osteoarthritis. The heatmap illustrates the association between the expression of drug target genes in the blood (from eQTLGen) and 12 osteoarthritis phenotypes, with serum HbA1c, glucose levels, and T2DM as outcomes to confirm the direction of the results. A red region indicates a positive association, a blue region indicates a negative association, and the ORs (95% CIs) are displayed if the results are significant and pass the HEIDI test. Asterisks denote the level of significance (∗P < 0.05, ∗∗P < 0.05/25 for multiple corrections). Abbreviations: OA, Osteoarthritis; SMR, summary-based Mendelian randomisation; HbA1c, Hemoglobin A1C; T2DM, Type 2 Diabetes Mellitus; THR, Total Hip Replacement; TKR, Total Knee Replacement; AGI, alpha glucosidase inhibitors; DPP4i, dipeptidyl peptidase-4 inhibitors; GLP-1RA, glucagon-like peptide-1 receptor agonists; SGLT2i, sodium-glucose cotransporter 2 inhibitors; TZDs, Thiazolidinediones.
Fig. 4
Fig. 4
Results of the SMR analysis for the associations of KCNJ11 and GANAB gene expression in the blood (sourced from eQTLGen), brain (from PsychENCODE), and skeletal muscle (from GTEx) with 12 osteoarthritis phenotypes. The forest plot visualises the effect sizes, with the vertical dashed line representing an odds ratio (OR) of 1. Values to the left indicate a protective effect, and values to the right suggest a risk effect. The PSMR values indicate the significance levels, with lower values providing stronger evidence against the null hypothesis of no association. A P-value of <4.2 × 10−3 indicates a statistically significant level, adjusted for multiple testing across 12 osteoarthritis phenotypes. All results passed the HEIDI test of the SMR method. For detailed eQTL results, please refer to Table S10. Abbreviations: OA, Osteoarthritis; SMR, summary-based Mendelian randomisation; eQTLs, expression quantitative trait loci; HEIDI, heterogeneity in dependent instruments; OR, odds ratio; CI, confidence interval.
Fig. 5
Fig. 5
Colocalisation results of antidiabetic drug gene expression and osteoarthritis. The heatmap depicts the two-trait colocalisation analysis of putative targets with 12 osteoarthritis phenotypes (left) and the multiple-trait colocalisation analysis with specific osteoarthritis phenotype groups (right), where darker blue shading and asterisks indicate stronger evidence of colocalisation. ∗∗indicates PPH4 >0.8 in coloc analysis. ∗indicates 0.5 <PPH4 <0.8 in coloc analysis. ††indicates PPA >0.5 in moloc analysis. †indicates PPA >0.3 in moloc analysis. Abbreviations: OA, Osteoarthritis; THR, Total Hip Replacement; TKR, Total Knee Replacement; AGI, alpha glucosidase inhibitors; DPP4i, dipeptidyl peptidase-4 inhibitors; GLP-1RA, glucagon-like peptide-1 receptor agonists; SGLT2i, sodium-glucose cotransporter 2 inhibitors; TZDs, Thiazolidinediones.

References

    1. Hunter D.J., Bierma-Zeinstra S. Osteoarthritis. Lancet. 2019;393(10182):1745–1759. - PubMed
    1. Mobasheri A., Batt M. An update on the pathophysiology of osteoarthritis. Ann Phys Rehabil Med. 2016;59(5-6):333–339. - PubMed
    1. Oo W.M., Hunter D.J. Repurposed and investigational disease-modifying drugs in osteoarthritis (DMOADs) Ther Adv Musculoskelet Dis. 2022;14 - PMC - PubMed
    1. Oo W.M., Little C., Duong V., Hunter D.J. The development of disease-modifying therapies for osteoarthritis (DMOADs): the evidence to date. Drug Des Devel Ther. 2021;15:2921–2945. - PMC - PubMed
    1. Mobasheri A., Rayman M.P., Gualillo O., Sellam J., van der Kraan P., Fearon U. The role of metabolism in the pathogenesis of osteoarthritis. Nat Rev Rheumatol. 2017;13(5):302–311. - PubMed

MeSH terms

Substances