. 2024 Oct 3;84(19):3775-3789.e6.
doi: 10.1016/j.molcel.2024.07.025. Epub 2024 Aug 16.

Nuclear PKM2 binds pre-mRNA at folded G-quadruplexes and reveals their gene regulatory role

Affiliations

Nuclear PKM2 binds pre-mRNA at folded G-quadruplexes and reveals their gene regulatory role

Dimitrios G Anastasakis et al. Mol Cell. .

Abstract

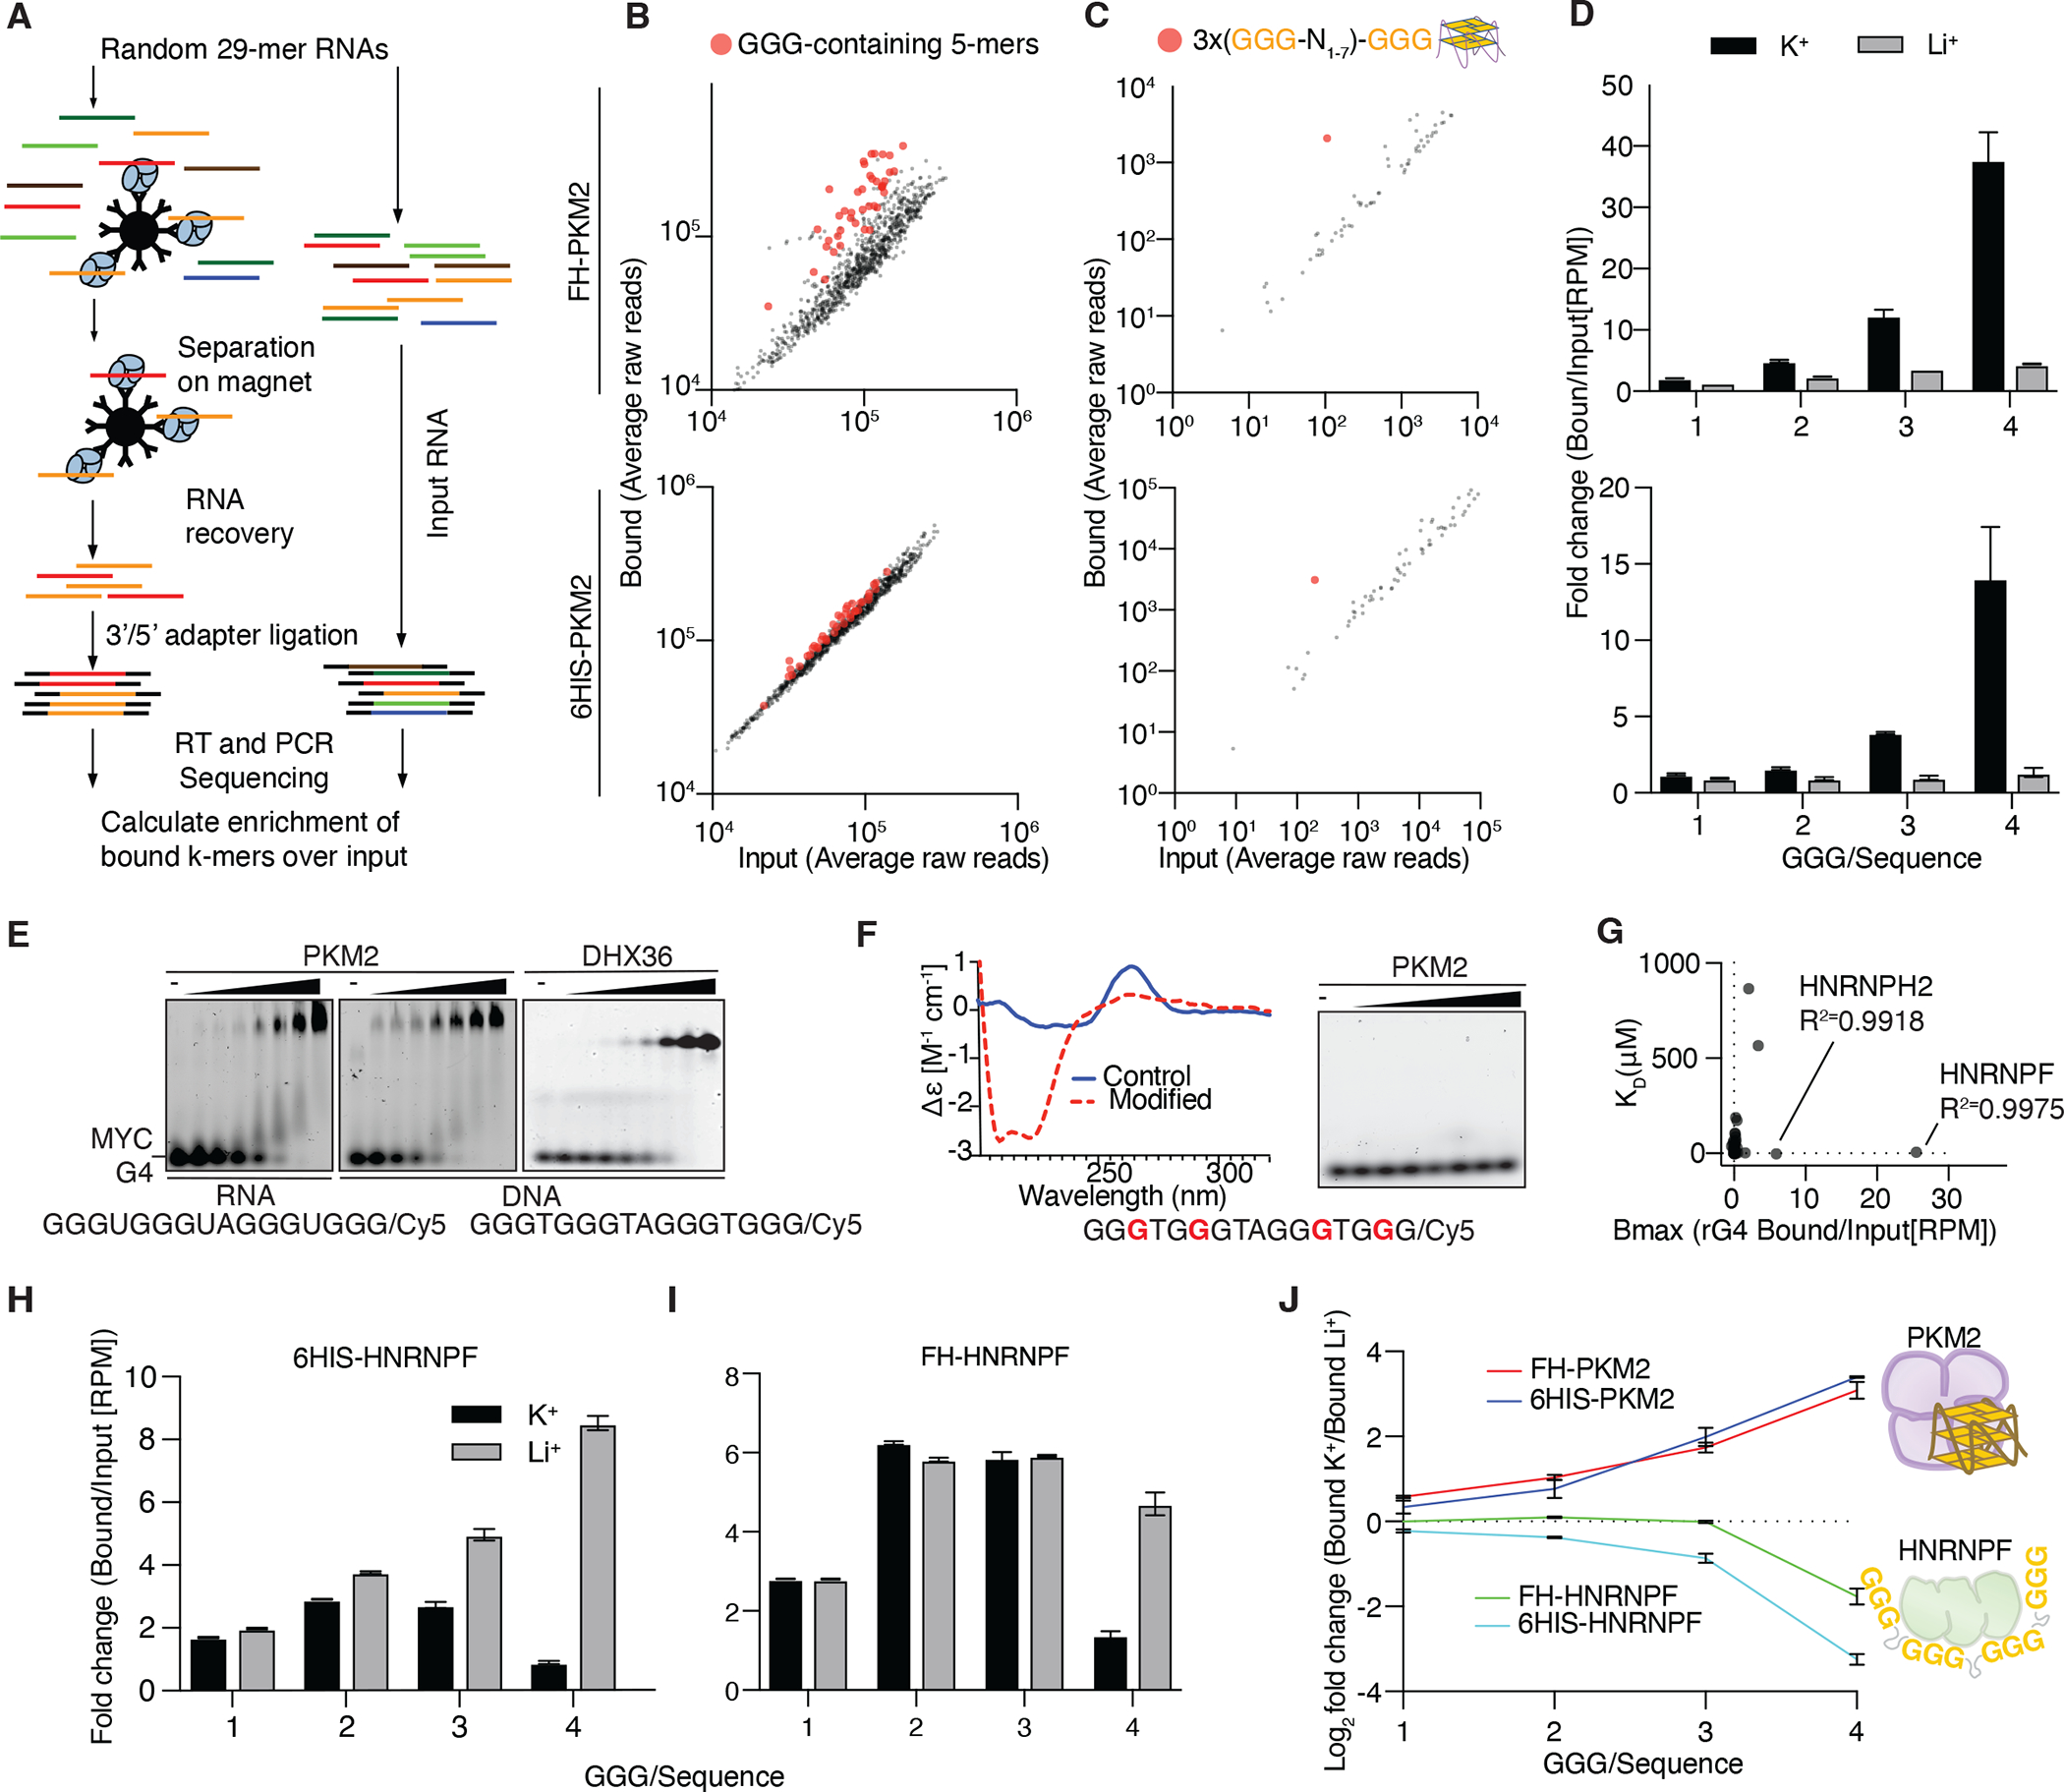
Nuclear localization of the metabolic enzyme PKM2 is widely observed in various cancer types. We identify nuclear PKM2 as a non-canonical RNA-binding protein (RBP) that specifically interacts with folded RNA G-quadruplex (rG4) structures in precursor mRNAs (pre-mRNAs). PKM2 occupancy at rG4s prevents the binding of repressive RBPs, such as HNRNPF, and promotes the expression of rG4-containing pre-mRNAs (the "rG4ome"). We observe an upregulation of the rG4ome during epithelial-to-mesenchymal transition and a negative correlation of rG4 abundance with patient survival in different cancer types. By preventing the nuclear accumulation of PKM2, we could repress the rG4ome in triple-negative breast cancer cells and reduce migration and invasion of cancer cells in vitro and in xenograft mouse models. Our data suggest that the balance of folded and unfolded rG4s controlled by RBPs impacts gene expression during tumor progression.

Keywords: G-quadruplex; G4; PAR-CLIP; PKM2; RNA-binding proteins; crosslinking and immunoprecipitation; posttranscriptional gene regulation.


Conflict of interest statement

Declaration of interests J.R. is on the scientific advisory board and has an equity interest in Pearl Bio. J.R. is a co-founder and has an equity interest in Kapis Biosciences.

Figures

Figure 1.
Figure 1.. PKM2 binds folded and HNRNPF binds unfolded RNA G-quadruplexes (rG4s) in vitro
(A) Schematic of the RBNS approach. (B,C) Scatter plot of relative abundance of 5-mers (B) or four repeats of any nucleotide triplet separated by any 1–7 nucleotides (XYZ(N1–7)3XYZ) in (C) input and PKM2-bound RBNS libraries. (D) Enrichment of sequences containing 1–4 G-triplets in RBNS performed in the presence of K+ or Li+. (E) EMSA using 6HIS-PKM2 or DHX36 with the G4 forming RNA or DNA 16-mer derived from the MYC promoter. (F) Circular Dichroism (CD) spectrum of the oligonucleotide from (D) containing 8-Aza-7-deazaguanine (left panel). Modified bases are indicated in red (lower panel). EMSA using 6HIS-PKM2 and the modified sequence (right panel). (G) Affinity (KD) versus maximal enrichment (Bmax) of reanalyzed, publicly available RBNS data. R2 from fit to Y=Bmax*X/(Kd+X). (H,I) Enrichment of sequences containing 1–4 G-triplets in 6HIS-HNRNPF (H) or FH-HNRNPF (I) RBNS performed in the presence of K+ or Li+. (J) PKM2 prefers binding to folded rG4 elements, while HNRNPF binds linear sequences. Ratio of enrichment (log2 bound over input) of sequences containing 1–4 G-triplets from RBNS experiments in the presence of K+ over Li+ for FH and 6HIS tagged PKM2 and HNRNPF.
Figure 2.
Figure 2.. PKM2 and HNRNPF bind to putative G-quadruplex forming sequences (PRG4Ss) in vivo
(A) Correlation heatmap across all PKM2 and HNRNPF fPAR-CLIP experiments, separated by cell line. Spearman correlation coefficient indicated. (B) Average distribution of PKM2 or HNRNPF binding sites across different mRNA annotation categories in the cytoplasm or the nucleus of HEK293 and MDA-MB-231. (C) MEME motif in nuclear PKM2 and HNRNPF binding sites. (D) Metagene plot of crosslinked footprints from representative fPAR-CLIP experiments centered on PRG4Ss. (E) (Upper panel) Alignment of nuclear FH-PKM2 fPAR-CLIP reads around a PRG4S in the 3’UTR of POLD1 mRNA. (Lower panel) EMSA using 6HIS-PKM1, 6HIS-PKM2, or 6HIS-PKM2pS37 the rG4 forming oligoribonucleotide corresponding to PKM2 binding site on POLD1. (F,G) Reanalysis of 233 PAR-CLIP experiments showing the percentage of binding sites per experiment containing PRG4Ss. Panel (G) summarizes replicate experiments as boxplots.
Figure 3.
Figure 3.. PKM2 and HNRNPF compete for access to PRG4Ss in vivo
(A) PKM2 and HNRNPF bind similar sites, shown by metagene analysis of crosslinked sequence read coverage from PKM2 PAR-CLIP around HNRNPF binding sites (left panel) or from HNRNPF PAR-CLIPs around PKM2 binding sites. (B) Coverage of HNRNPF and PKM2 binding sites on MALAT1. (C) Venn diagram of binding site overlap for endogenous PKM2 and HNRNPF. (D) Proportion of sequence reads containing the canonical PRG4S in four biological replicates of HNRNPF fPAR-CLIP in MDA-MB231 expressing wild-type (WT) PKM or PKM fused to a nuclear export signal (PKMNES).
Figure 4.
Figure 4.. PKM2 and HNRNPF competitively regulate rG4-containing transcripts in vivo
(A) (Left panel) Quantification of nuclear FLAG signal in cells expressing FH-PKM2 and FH-PKM2-NES. (Right panel) Immunoblot confirming silencing of endogenous PKM and expression of FH-PKM2-NES. (B) mRNA expression changes after silencing of endogenous PKM2 in cells expressing FH-PKM2-NES. The empirical cumulative distribution function (CDF) of nuclear PKM2 targets binned according to the number of canonical rG4s crosslinked to PKM2 (GGG(N1–7)3-GGG) in their exons (left panel), in introns within 200 nt from splice sites (middle panel) or greater than 200 nt (right panel). (C) (Upper panel) Immunoblot confirming expression of FH-PKM2-NLS after doxycycline induction. (Lower panel) Immunofluorescence analysis showing nuclear localization of FH-PKM2-NLS; Scale bar, 15 μm. (D) mRNA expression changes after expression of FH-PKM2-NLS. CDF of genes binned according to the number of canonical rG4s (GGG(N1–7)3-GGG) in their exons (left panel), in introns within 200 nt from splice sites (middle panel) or greater than 200 nt (right panel). (E) (Upper panel) Immunoblot confirming expression of FH-HNRNPF after doxycycline induction. (Lower panel) Immunofluorescence analysis showing nuclear localization of FH-HNRNPF; Scale bar, 15 μm. (F) mRNA expression changes after expression of FH-HNRNPF. CDF of genes binned according to the number of canonical rG4s (GGG(N1–7)3-GGG) in their exons (left panel), in introns within 200 nt from splice sites (middle panel) or greater than 200 nt (right panel). Nuclei, Hoechst 33342 (blue); FLAG, Alexa Fluor 594 (red); Scale bar, 20 μm. *P ≤ 0.05, **P ≤ 0.01, ***P ≤ 0.001, ****P ≤ 0.0001, Mann-Whitney U test (MWU).
Figure 5.
Figure 5.. PKM2 binding and rG4 formation promotes transcription elongation
(A,B) Polymerase occupancy changes of total PolII near transcription start site (A) or elongating PolII (CTD phosphorylated at S2) along the gene body (B). Transcripts were binned according to the number of canonical rG4 motifs (GGG(N1–7)3GGG) in their exons or within 200 nt of the 5’ or 3’ splice site. *P ≤ 0.05, **P ≤ 0.01, ***P ≤ 0.001, ****P ≤ 0.0001; Mann-Whitney U test (MWU). (C,D) Abundance changes of intronic reads (C) or ratio of intronic/exonic reads (D) upon expression of FH-PKM2-NLS. Transcripts were binned according to the number of canonical rG4 motifs (GGG(N1–7)3GGG) in their exons or within 200 nt of the 5’ or 3’ splice site.
Figure 6.
Figure 6.. The rG4ome is associated with aggressive cancer phenotype
(A) Scatter plot of hallmark gene sets enriched among genes upregulated by FH-PKM2-NLS expression (−log10 p-value versus Enrichment Score). (B) Gene Set Enrichment Analysis of transcripts upregulated by nuclear PKM2 (determined in HEK293) in HMLER cells as they transition from a less tumorigenic E-state to the highly aggressive hybrid E/M state. (C,D) mRNA expression changes comparing cells in the aggressive E/M state with the basic E-state. Transcripts were binned according to the number of canonical rG4 motifs (GGG(N1–7)3-GGG) in their exons (C) in their introns within 200 nt of the splicing sites (D). E Violin plots of the relative expression of transcripts with 0 (left panel), 1–6 (center panel), or more than 6 (right panel) PRG4Ss in their exons or introns near a splicing site for E, EM and xM cells. (F) mRNA expression changes upon treatment of MDA-MB-231 cells with 5 μΜ TEPP-46. Transcripts were binned according to the number of canonical rG4 motifs (GGG(N1–7)3-GGG) in their exons or within 200 nt of the 5’ or 3’ splice site. (G) Dot plot of cell front velocity in wound healing assay. (H) Dot plot of the proportion of invading cells per tested area of Matrigel-coated transwell filters in invasion assays. *P ≤ 0.05, **P ≤ 0.01, ***P ≤ 0.001, ****P ≤ 0.0001; two-tailed t-test.
Figure 7.
Figure 7.. Nuclear PKM2 promotes lung metastasis
(A) Immunoblot analysis showing expression of PKM endogenously tagged with either FH or NES-FH using anti-FLAG or anti-PKM2 antibodies. (B) ATP production in the presence of ADP and pyruvate (left panel, endpoint; middle panel, kinetics) from proteins purified by anti-FLAG immunoprecipitation (IP) from parental, MDA-MB-231PKM-FH/WT and MDA-MB-231PKM-NES-FH/PKM-NES-FH cells. (Right panel) Pyruvate kinase assay using extracts from parental cells. (C) Dot plot of cell front velocity in wound healing assay of MDA-MB-231PKM-FH/WT and MDA-MB-231PKM-NES-FH/PKM-NES-FH cells (D) Exclusion of PKM2 from the nucleus decreases tumor size. Primary tumor size of xenografts in NOD scid gamma (NSG) mice subcutaneously injected in the right flank with 107 cells of either parental MDA-MB-231 (black line), heterozygous PKM-FH/WT (gray line), or homozygous PKM-FH-NES cells. (E) Primary tumor size from (D) 44 days after injection. (F) Kaplan-Meier survival curves for the three groups from (D). (G) mRNA expression changes comparing gene expression in the primary tumor of xenografts of MDA-MB231 cells homo- or heterozygous for FH-NES-PKM expression. Transcripts for cumulative distribution function were binned by the number of PRG4Ss identified by fPAR-CLIP from parental MDA-MB231 cells. (H) Representative images of FLAG IHC staining in lung sections from metastases from xenografts of PKM-FH/WT heterozygous or PKM-NES-FH/PKM-NES-FH homozygous MDA-MB231 cells (left and middle panels); Scale bar, 1 mm. Mean values of fraction of metastasis in lungs (by volume, right panel).

References

    1. Imamura K, and Tanaka T (1972). Multimolecular forms of pyruvate kinase from rat and other mammalian tissues. I. Electrophoretic studies. J Biochem 71, 1043–1051. 10.1093/oxfordjournals.jbchem.a129852. - DOI - PubMed
    1. Vander Heiden MG, Cantley LC, and Thompson CB (2009). Understanding the Warburg effect: the metabolic requirements of cell proliferation. Science 324, 1029–1033. 10.1126/science.1160809. - DOI - PMC - PubMed
    1. Warburg O (1956). On the origin of cancer cells. Science 123, 309–314. 10.1126/science.123.3191.309. - DOI - PubMed
    1. Christofk HR, Vander Heiden MG, Harris MH, Ramanathan A, Gerszten RE, Wei R, Fleming MD, Schreiber SL, and Cantley LC (2008). The M2 splice isoform of pyruvate kinase is important for cancer metabolism and tumour growth. Nature 452, 230–233. 10.1038/nature06734. - DOI - PubMed
    1. Mazurek S, Boschek CB, Hugo F, and Eigenbrodt E (2005). Pyruvate kinase type M2 and its role in tumor growth and spreading. Semin Cancer Biol 15, 300–308. 10.1016/j.semcancer.2005.04.009. - DOI - PubMed

MeSH terms