. 2024 Oct 1;36(10):2329-2340.e4.
doi: 10.1016/j.cmet.2024.07.016. Epub 2024 Aug 16.

Cytosolic calcium regulates hepatic mitochondrial oxidation, intrahepatic lipolysis, and gluconeogenesis via CAMKII activation

Affiliations

Cytosolic calcium regulates hepatic mitochondrial oxidation, intrahepatic lipolysis, and gluconeogenesis via CAMKII activation

Traci E LaMoia et al. Cell Metab. .

Abstract

To examine the roles of mitochondrial calcium Ca2+ ([Ca2+]mt) and cytosolic Ca2+ ([Ca2+]cyt) in the regulation of hepatic mitochondrial fat oxidation, we studied a liver-specific mitochondrial calcium uniporter knockout (MCU KO) mouse model with reduced [Ca2+]mt and increased [Ca2+]cyt content. Despite decreased [Ca2+]mt, deletion of hepatic MCU increased rates of isocitrate dehydrogenase flux, α-ketoglutarate dehydrogenase flux, and succinate dehydrogenase flux in vivo. Rates of [14C16]palmitate oxidation and intrahepatic lipolysis were increased in MCU KO liver slices, which led to decreased hepatic triacylglycerol content. These effects were recapitulated with activation of CAMKII and abrogated with CAMKII knockdown, demonstrating that [Ca2+]cyt activation of CAMKII may be the primary mechanism by which MCU deletion promotes increased hepatic mitochondrial oxidation. Together, these data demonstrate that hepatic mitochondrial oxidation can be dissociated from [Ca2+]mt and reveal a key role for [Ca2+]cyt in the regulation of hepatic fat mitochondrial oxidation, intrahepatic lipolysis, gluconeogenesis, and lipid accumulation.

Keywords: CAMKII; Q-Flux; calcium; fat oxidation; glucose oxidation; isocitrate dehydrogenase flux; metabolic dysfunction-associated steatotic liver disease; mitochondria; mitochondrial calcium uniporter; succinate dehydrogenase flux; tricarboxylic acid cycle; type 2 diabetes; α-ketoglutarate dehydrogenase flux.


Conflict of interest statement

Declaration of interests The authors declare no competing interests.

Figures
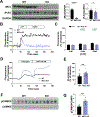
Figure 1.
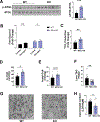
Figure 1.. Deletion of hepatic MCU increases cytosolic calcium accumulation.
(A) MCU and IP3R-I protein expression in WT and MCU KO mice. (B) Representative trace of [Ca2+]mt imaging in primary hepatocytes. (C) Quantification of [Ca2+]mt in response to stimulation with 5, 10, or 20 μM ATP. (D) Representative trace of [Ca2+]cyt imaging in primary hepatocytes. (E) Quantification of [Ca2+]cyt in response to stimulation with 100 nM glucagon followed by 100 nM vasopressin (AVP). (F) Phosphorylation of liver CAMKII Thr286 assessed by western blot. Data are presented as mean ± SEM. Groups were compared by the Student’s t test unless otherwise noted. **P < 0.01, ****P < 0.0001.
Figure 2.
Figure 2.. Increased fatty acid oxidation reduces liver triglyceride accumulation in MCU KO mice.
(A) Phosphorylation of liver ATGL Ser406 assessed by western blot. (B) Rates of intrahepatic lipolysis in precision-cut liver slices ± glucagon treatment. (C) Rates of fatty acid oxidation in liver slices. D-F) Liver long-chain acyl CoA (C), acetyl CoA (D), and triglyceride (E) concentrations. (G-H) Representative images (F) and quantification (G) of liver lipid droplet content in WT and MCU KO mice. Data are presented as mean ± SEM. Groups were compared by the Student’s t test unless otherwise noted. *P < 0.05, **P < 0.01, ***P < 0.001. See also Figure S1.
Figure 3.
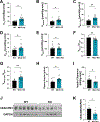
Figure 3.. Deletion of hepatic MCU increases pyruvate and glutamine anaplerosis, but impairs insulin clearance.
(A-E) Pyruvate carboxylase flux (A), PEPCK flux (B), Mitochondrial gluconeogenesis flux (C), glutaminase flux (D), and hepatic glucose production (E) obtained with Q-Flux in 6-h fasted mice. (F-G) Relative contribution of glycerol gluconeogenesis + glycogenolysis (F) and mitochondrial gluconeogenesis (G) to total HGP. (H) Fasting plasma insulin concentrations. (I) Rates of whole-body insulin clearance. (J-K) CEACAM1 protein expression in the liver of WT and MCU KO mice. Data are presented as mean ± SEM. Groups were compared by the Student’s t test unless otherwise noted. *P < 0.05, **P <0.01. See also Figure S2.
Figure 4.
Figure 4.. Mitochondrial calcium is dispensable for mitochondrial oxidation.
(A-D) Absolute rates of isocitrate dehydrogenase flux (A), α-ketoglutarate dehydrogenase flux (B), succinate dehydrogenase forward flux (C), and fatty acid oxidation (D) as measured by Q-Flux in 6-h fasted mice. Data are presented as mean ± SEM. Groups were compared by the Student’s t test unless otherwise noted. **P < 0.01, ***P < 0.001.
Figure 5.
Figure 5.. CAMKII activation recapitulates the MCU KO phenotype.
(A-F) Pyruvate carboxylase flux (A), PEPCK flux (B), mitochondrial gluconeogenic flux (C), isocitrate dehydrogenase flux (D), α-ketoglutarate dehydrogenase flux (E), and succinate dehydrogenase forward flux (F) in WT mice treated with LacZ control or CAMKII-CA adenovirus constructs. Data are presented as mean ± SEM. Groups were compared by the Student’s t test unless otherwise noted. *P < 0.05.
Figure 6.
Figure 6.. CAMKII knockdown abrogates the MCU KO phenotype.
(A) Liver CAMKII expression assessed by qPCR. (B-G) Pyruvate carboxylase flux (B), PEPCK flux (C), mitochondrial gluconeogenic flux (D), isocitrate dehydrogenase flux (E), α-ketoglutarate dehydrogenase flux (F), and succinate dehydrogenase forward flux (G) in WT or MCU KO mice treated with control ASOs, or MCU KO mice treated with CAMKII ASOs. Data are presented as mean ± SEM. Groups were compared by one-way ANOVA unless otherwise noted.
Figure 7.
Figure 7.. Calcium activation of aralar and SCaMC-3 are dispensable for mitochondrial oxidation in MCU KO mice.
(A-B) Hepatic [lactate]:[pyruvate] ratio (A) and [β-OHB]:[Acetoacetate] ratio (B) in WT mice or MCU KO mice ± aminooxy acetate (AOA). (C-F) Hepatic pyruvate carboxylase flux (C), isocitrate dehydrogenase flux (D), α-ketoglutarate dehydrogenase flux (E), and succinate dehydrogenase forward flux (F) in WT mice or MCU KO mice ± AOA. (G) Liver SCaMC-3 expression assessed by qPCR. (H-K) Liver pyruvate carboxylase flux (H), isocitrate dehydrogenase flux (I), α-ketoglutarate dehydrogenase flux (J), and succinate dehydrogenase forward flux (K) in WT mice or MCU KO mice ± SCaMC-3 knock down. Data are presented as mean ± SEM. Groups were compared by one-way ANOVA unless otherwise noted.

References

    1. Denton RM, Randle PJ, and Martin BR (1972). Stimulation by calcium ions of pyruvate dehydrogenase phosphate phosphatase. Biochem J 128, 161–163. 10.1042/bj1280161. - DOI - PMC - PubMed
    1. Denton RM, Richards DA, and Chin JG (1978). Calcium ions and the regulation of NAD+-linked isocitrate dehydrogenase from the mitochondria of rat heart and other tissues. Biochemical Journal 176, 899–906. 10.1042/bj1760899. - DOI - PMC - PubMed
    1. Linn TC, Pettit FH, and Reed LJ (1969). α-KETO ACID DEHYDROGENASE COMPLEXES, X. REGULATION OF THE ACTIVITY OF THE PYRUVATE DEHYDROGENASE COMPLEX FROM BEEF KIDNEY MITOCHONDRIA BY PHOSPHORYLATION AND DEPHOSPHORYLATION*. Proceedings of the National Academy of Sciences 62, 234–241. 10.1073/pnas.62.1.234. - DOI - PMC - PubMed
    1. Hansford RG, and Chappell JB (1967). The effect of Ca2+ on the oxidation of glycerol phosphate by blowfly flight-muscle mitochondria. Biochemical and Biophysical Research Communications 27, 686–692. 10.1016/S0006-291X(67)80090-1. - DOI - PubMed
    1. McCormack JG, and Denton RM (1979). The effects of calcium ions and adenine nucleotides on the activity of pig heart 2-oxoglutarate dehydrogenase complex. Biochem J 180, 533–544. 10.1042/bj1800533. - DOI - PMC - PubMed

Substances

LinkOut - more resources