. 2024 Dec 20;16(7):mjae030.
doi: 10.1093/jmcb/mjae030.

Modeling gastric intestinal metaplasia in 3D organoids using nitrosoguanidine

Affiliations

Modeling gastric intestinal metaplasia in 3D organoids using nitrosoguanidine

Yuan Li et al. J Mol Cell Biol. .

Abstract

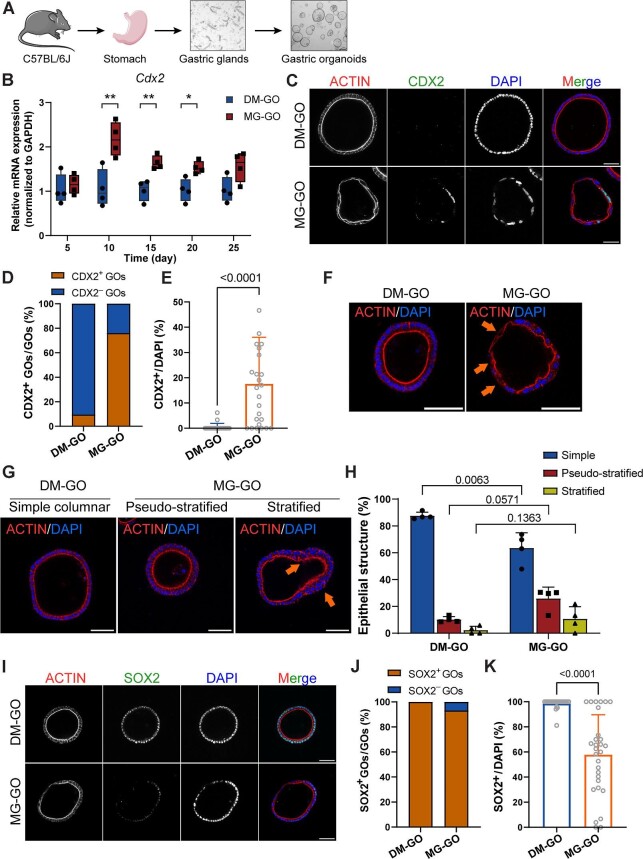
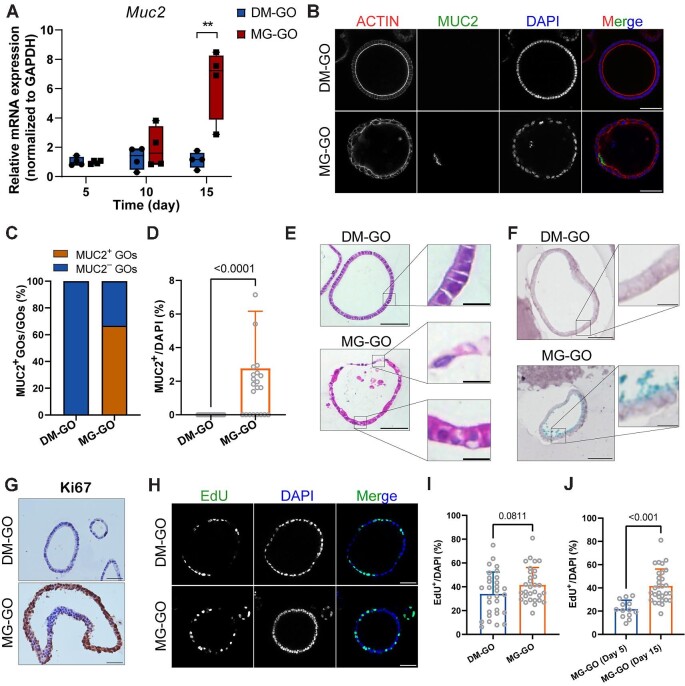
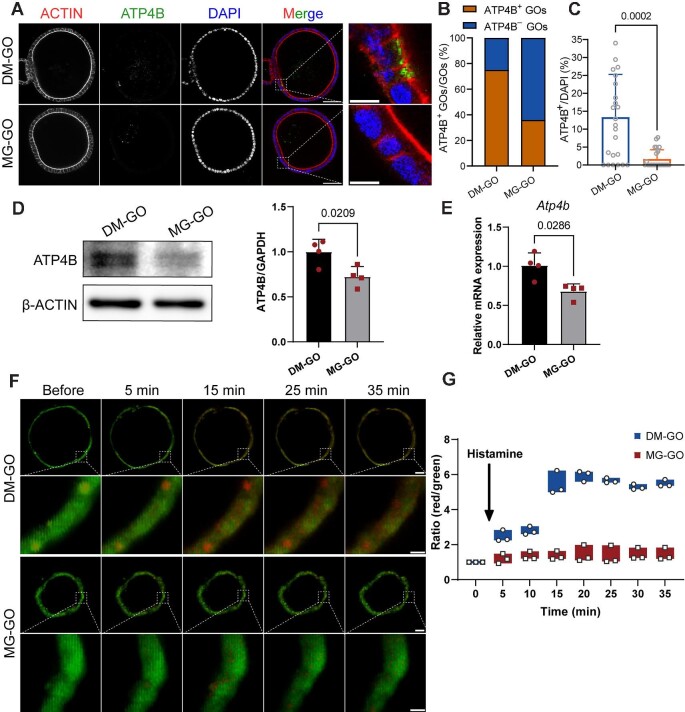
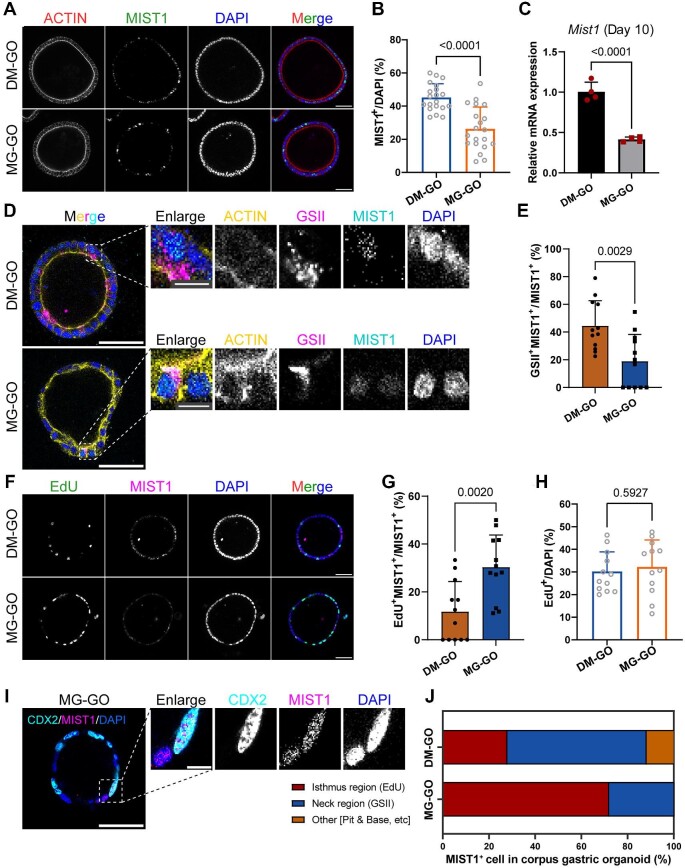
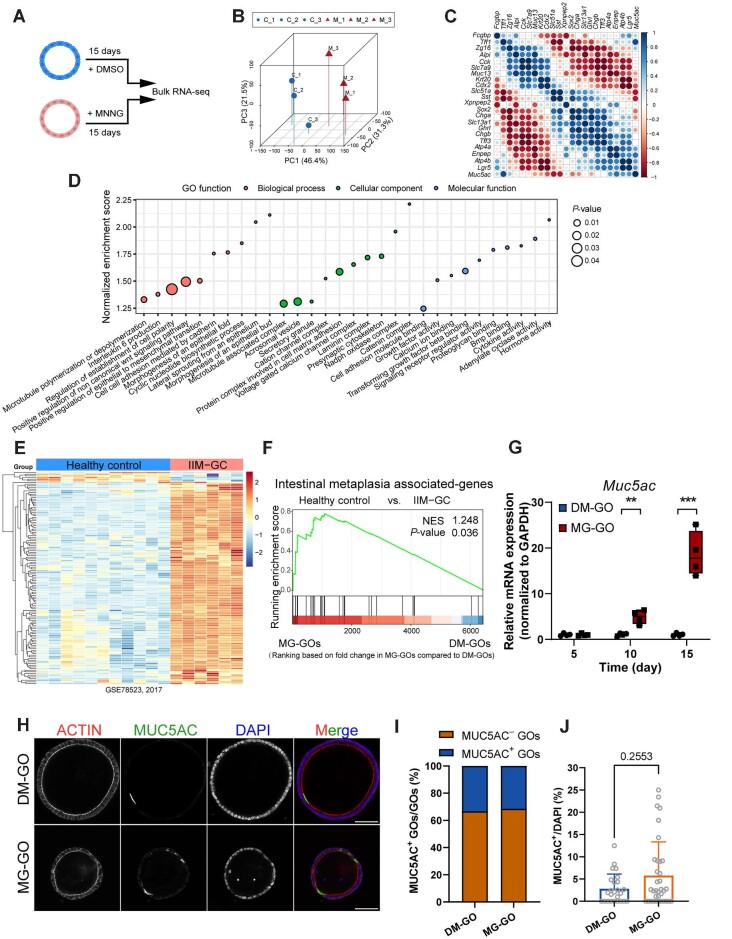
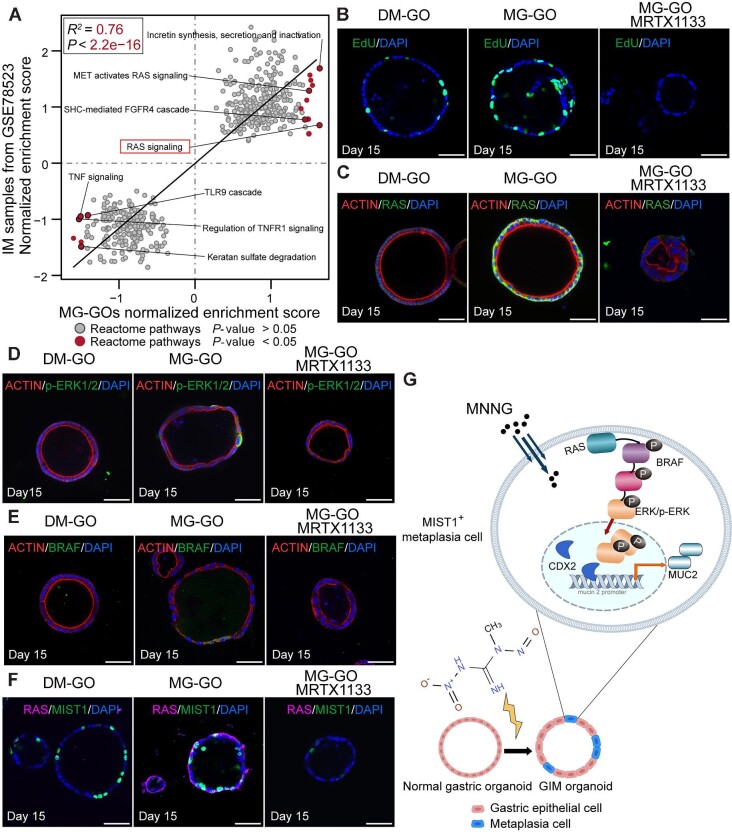
Gastric intestinal metaplasia (GIM) represents a precancerous stage characterized by morphological and pathophysiological changes in the gastric mucosa, where gastric epithelial cells transform into a phenotype resembling that of intestinal cells. Previous studies have demonstrated that the intragastric administration of N-methyl-N'-nitro-N-nitrosoguanidine (MNNG) induces both gastric carcinoma and intestinal metaplasia in mice. Here, we show that MNNG induces GIM in three-dimensional (3D) mouse organoids. Our histological analyses reveal that MNNG-induced gastric organoids undergo classical morphological alterations, exhibiting a distinct up-regulation of CDX2 and MUC2, along with a down-regulation of ATP4B and MUC6. Importantly, metaplastic cells observed in MNNG-treated organoids originate from MIST1+ cells, indicating their gastric chief cell lineage. Functional analyses show that activation of the RAS signaling pathway drives MNNG-induced metaplasia in 3D organoids, mirroring the characteristics observed in human GIM. Consequently, modeling intestinal metaplasia using 3D organoids offers valuable insights into the molecular mechanisms and spatiotemporal dynamics of the gastric epithelial lineage during the development of intestinal metaplasia within the gastric mucosa. We conclude that the MNNG-induced metaplasia model utilizing 3D organoids provides a robust platform for developing preventive and therapeutic strategies to mitigate the risk of gastric cancer before precancerous lesions occur.

Keywords: MNNG; gastric organoids; intestinal metaplasia; precancerous lesion; trans-differentiation.


Figures

Figure 1
Figure 1
Nitrosoguanidine induction increases CDX2 expression and decreases SOX2 expression in MG-GOs. (A) Schematic representation of the GO culture establishment process. (B) Relative mRNA expression levels of Cdx2 on Days 5, 10, 15, 20, and 25 (n = 4). Data represent mean ± SEM. (C) Representative fluorescent images of CDX2 at Day 10. Scale bar, 50 μm. (D) Stacked bar chart showing the proportion of CDX2-expressing organoids. (E) Percentage of CDX2+ cells in DM-GOs (n = 21) and MG-GOs (n = 25). Data represent mean ± SEM. (F) Organoids stained with phalloidin and DAPI. Arrows indicate cell polarity disruption in MG-GO. Scale bar, 50 μm. (G) Representative fluorescent images of epithelial structures in DM-GO and MG-GO. Arrows indicate stratified columnar epithelium in MG-GO. Scale bar, 50 μm. (H) Summary of percentages of simple columnar, pseudostratified, and stratified epithelial structures in DM-GOs (n = 114) and MG-GOs (n = 121). (I) Representative fluorescent images of SOX2 at Day 10. Scale bar, 50 μm. (J) Stacked bar chart showing the proportion of SOX2-expressing organoids. (K) Percentage of SOX2+ cells in DM-GOs (n = 21) and MG-GOs (n = 25). Data represent mean ± SEM.
Figure 2
Figure 2
Nitrosoguanidine induction triggers MUC2 expression and GIM characteristics in MG-GOs. (A) Relative mRNA expression levels of Muc2 at Days 5, 10, and 15 (n = 4, mean ± SEM). (B) Representative fluorescent images of MUC2 at Day 15. Scale bar, 50 μm. (C) Stacked bar chart showing the proportion of MUC2-expressing organoids. (D) Percentage of MUC2+ cells in DM-GOs (n = 23) and MG-GOs (n = 24). Data represent mean ± SEM. (E and F) Representative images of H&E staining and alcian blue staining for DM-GOs and MG-GOs. Scale bar, 50 μm (lower magnification) and 10 μm (higher magnification). (G) Representative images of Ki67 staining for DM-GOs and MG-GOs. Scale bar, 50 μm. (H) Representative images of EdU staining for DM-GOs and MG-GOs. Scale bar, 50 μm. (I) Percentage of EdU+ cells in DM-GOs and MG-GOs (n = 30 each group, mean ± SEM). (J) Percentage of EdU+ cells in MG-GOs on Days 5 and 15 (mean ± SEM).
Figure 3
Figure 3
Nitrosoguanidine induction suppresses ATP4B expression and impairs cellular response to histamine in GOs. (A) Representative fluorescent images of ATP4B at Day 5. Scale bar, 50 μm (lower magnification) and 10 μm (higher magnification). (B) Stacked bar chart showing the proportion of ATP4B-expressing organoids. (C) Percentage of ATP4B+ cells in DM-GOs (n = 24) and MG-GOs (n = 25). Data represent mean ± SEM. (D) Relative protein expression levels of ATP4B in MG-GOs compared to DM-GOs (n = 4, mean ± SEM). (E) Relative mRNA expression levels of Atp4b in MG-GOs compared to DM-GOs (n = 4, mean ± SEM). (F) Acridine orange staining before and after histamine (100 μM) treatment. Scale bar, 50 μm (lower magnification) and 10 μm (higher magnification). (G) Quantification of red/green (600–650 nm/500–550 nm) ratio changes in response to histamine from three individual regions of interest.
Figure 4
Figure 4
MIST1+ cells serve as progenitors for CDX2+ metaplastic cells in MG-GOs. (A) Representative fluorescent images of MIST1 at Day 10. Scale bar, 50 μm. (B) Percentage of MIST1+ cells in DM-GOs (n = 20) and MG-GOs (n = 20). Data represent mean ± SEM. (C) Relative mRNA expression levels of Mist1 on Day 10 (n = 4, mean ± SEM). (D) Representative fluorescent images of GSII and MIST1 at Day 10. Scale bar, 50 μm (lower magnification) and 10 μm (higher magnification). (E) Percentage of GSII+MIST1+ epithelial cells among total MIST1+ epithelial cells in DM-GOs (n = 12) and MG-GOs (n = 12). Data represent mean ± SEM. (F) Representative images of EdU and MIST1 at Day 10. Scale bar, 50 μm. (G) Percentage of EdU+MIST1+ epithelial cells among total MIST1+ epithelial cells in DM-GOs (n = 12) and MG-GOs (n = 12). (H) Percentage of EdU+ cells in DM-GOs (n = 12) and MG-GOs (n = 12). (I) Representative fluorescent images of CDX2 and MIST1 in MG-GOs at Day 10. Scale bar, 50 μm (lower magnification) and 10 μm (higher magnification). (J) Stacked bar chart showing the distribution of MIST+ cells in corpus gastric organoids, categorized by their location per total MIST+ cells.
Figure 5
Figure 5
Comparative analysis reveals transcriptomic differences and intestinal metaplasia signatures in MG-GOs. (A) Workflow depicting RNA-seq analysis. (B) 3D PCA of DM-GOs and MG-GOs. (C) Spearman correlation matrix of gastric and intestinal signature genes clustered using corrplot Bioconductor. (D) GSEA and Gene Ontology analysis of DEGs between DM-GOs and MG-GOs, visualized as a dot plot of significantly enriched terms. (E) Heatmap displaying DEGs between healthy gastric mucosa and IIM-GC. (F) GSEA of genes upregulated in IIM-GC compared to healthy gastric mucosa, showing similarity to IIM-GC. (G) Relative mRNA expression levels of Muc5ac at Days 5, 10, and 15 (n = 4, mean ± SEM). (H) Representative fluorescent images of MUC5AC at Day 15. (I) Stacked bar chart showing the proportion of MUC5AC-expressing organoids. (J) Percentage of MUC5AC+ cells in DM-GOs (n = 25) and MG-GOs (n = 35). Data represent mean ± SEM.
Figure 6
Figure 6
RAS/ERK signaling pathway is implicated in GIM formation. (A) Scatterplot showing gene sets enriched in MG-GOs and IIM-GC. IM, intestinal metaplasia. (B) Representative images of EdU staining for DM-GOs, MG-GOs, and MG-GOs treated with MRTX1133 on Day 15. Scale bar, 50 μm. (C) Immunofluorescent staining of RAS in DM-GOs, MG-GOs, and MG-GOs treated with MRTX1133. Scale bar, 50 μm. (D) Immunofluorescent staining of phosphorylated ERK1/2 (p-ERK1/2) in DM-GOs, MG-GOs, and MG-GOs treated with MRTX1133. Scale bar, 50 μm. (E) Immunofluorescent staining of BRAF in gastric organoids. Scale bar, 50 μm. (F) Organoids stained with EdU, anti-RAS, and DAPI. Scale bar, 50 μm. (G) Schematic illustration of the proposed molecular mechanism underlying changes in MG-GOs during GIM.

Similar articles

References

    1. Aditi A., Graham D.Y. (2012). Vitamin C, gastritis, and gastric disease: a historical review and update. Dig. Dis. Sci. 57, 2504–2515. - PMC - PubMed
    1. Babu S.D., Jayanthi V., Devaraj N. et al. (2006). Expression profile of mucins (MUC2, MUC5AC and MUC6) in Helicobacter pylori infected pre-neoplastic and neoplastic human gastric epithelium. Mol. Cancer 5, 10. - PMC - PubMed
    1. Barros R., Freund J.N., David L. et al. (2012). Gastric intestinal metaplasia revisited: function and regulation of CDX2. Trends Mol. Med. 18, 555–563. - PubMed
    1. Bartfeld S., Bayram T., van de Wetering M. et al. (2015). In vitro expansion of human gastric epithelial stem cells and their responses to bacterial infection. Gastroenterology 148, 126–136.e6. - PMC - PubMed
    1. Bhat A.A., Uppada S., Achkar I.W. et al. (2018). Tight junction proteins and signaling pathways in cancer and inflammation: a functional crosstalk. Front. Physiol. 9, 1942. - PMC - PubMed

Substances