. 2024 Aug 17;19(1):112.
doi: 10.1186/s13000-024-01536-8.

Prognostic and immune infiltration implications of SIGLEC9 in SKCM

Affiliations

Prognostic and immune infiltration implications of SIGLEC9 in SKCM

Peipei Yang et al. Diagn Pathol. .

Abstract

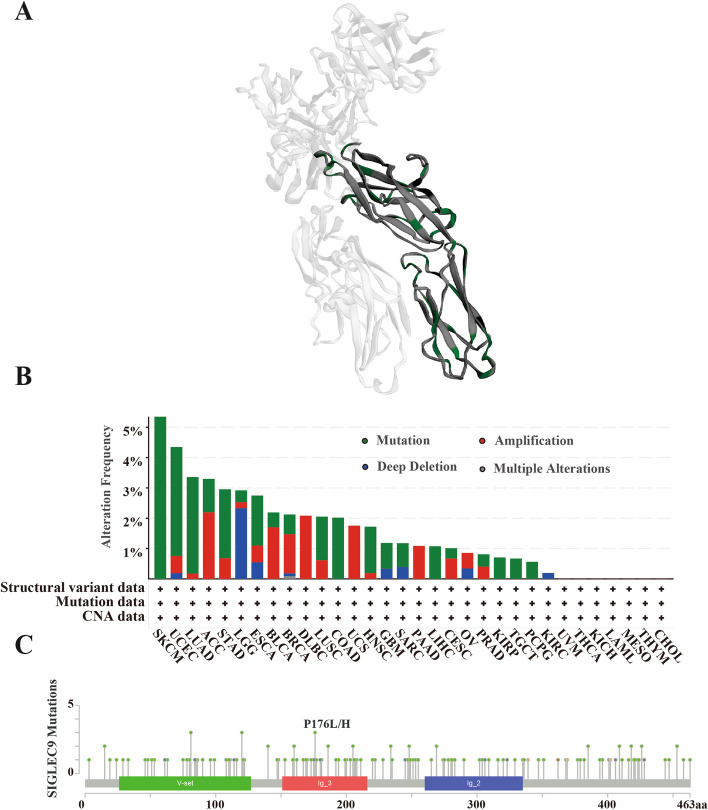
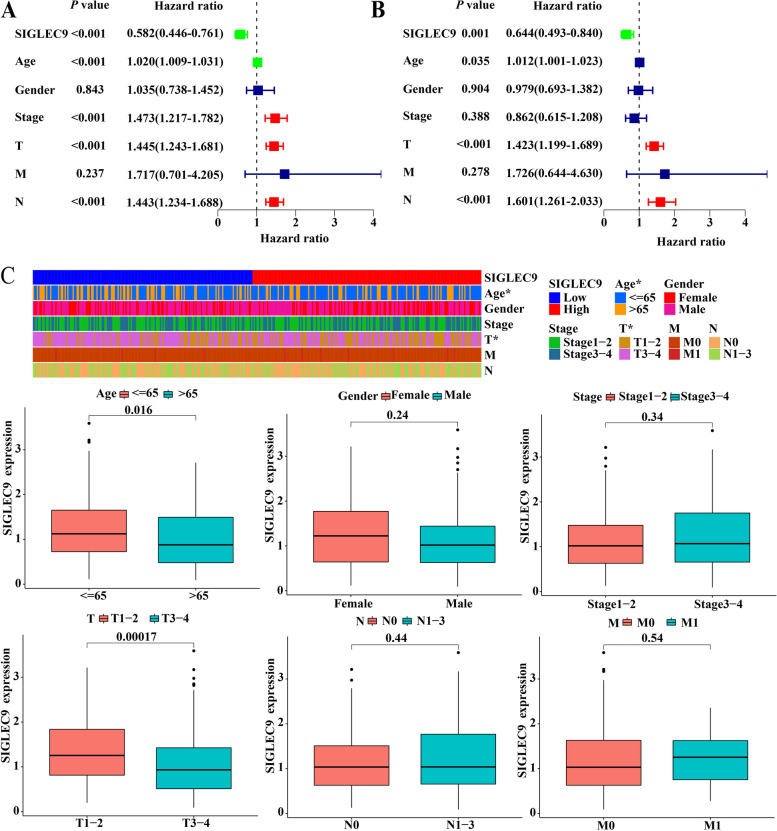
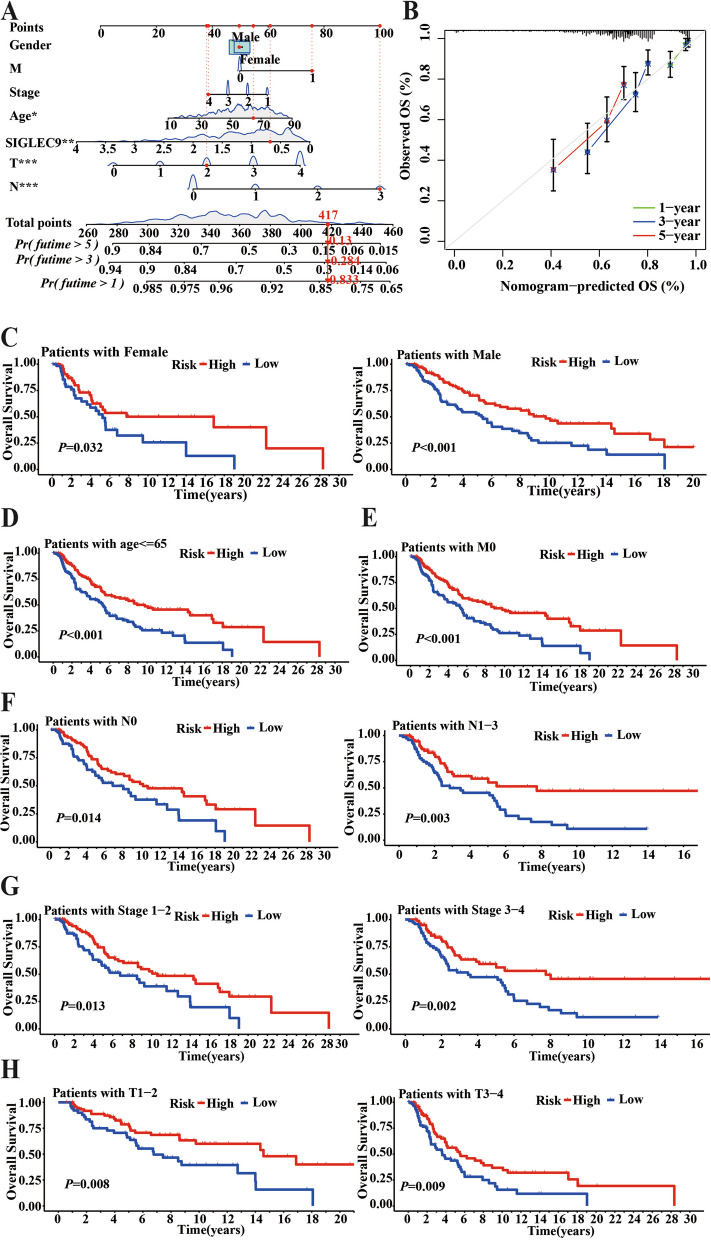
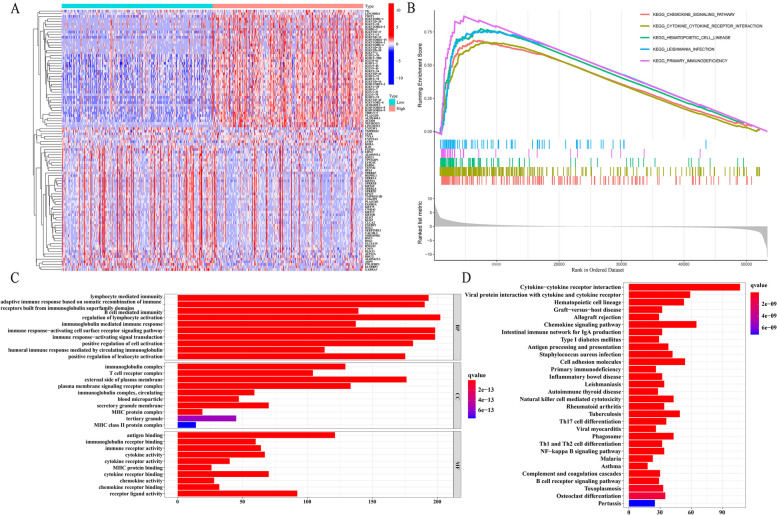
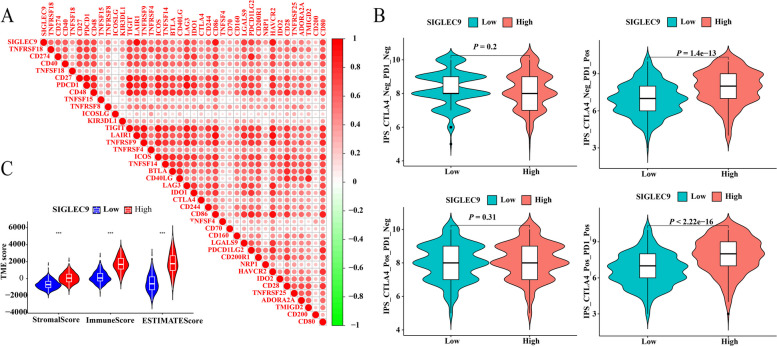
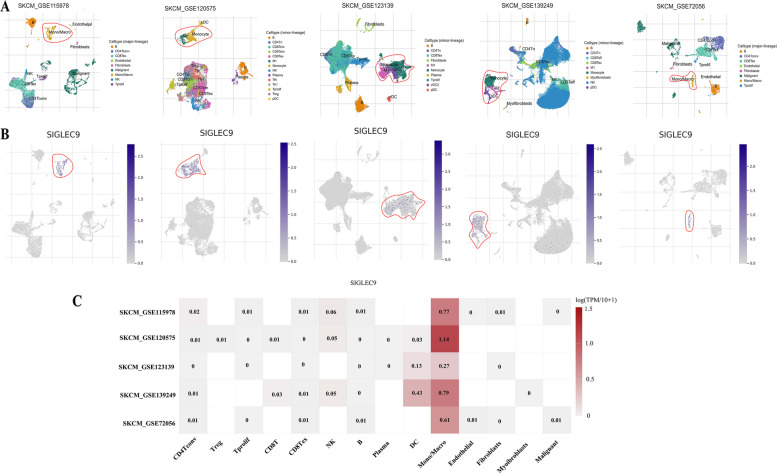
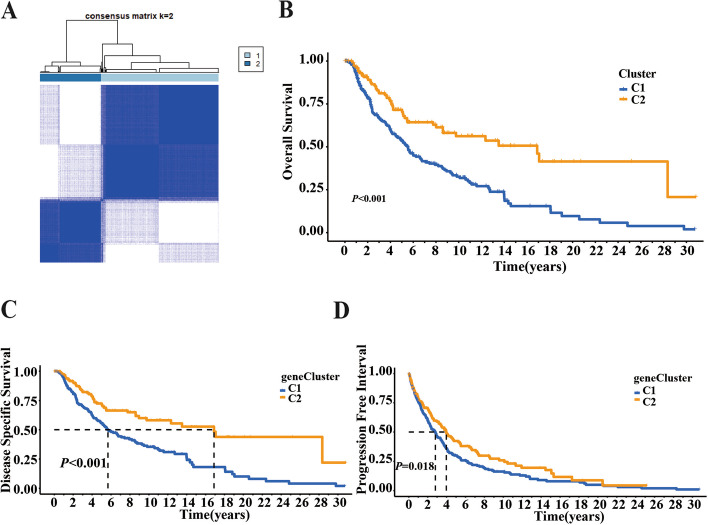
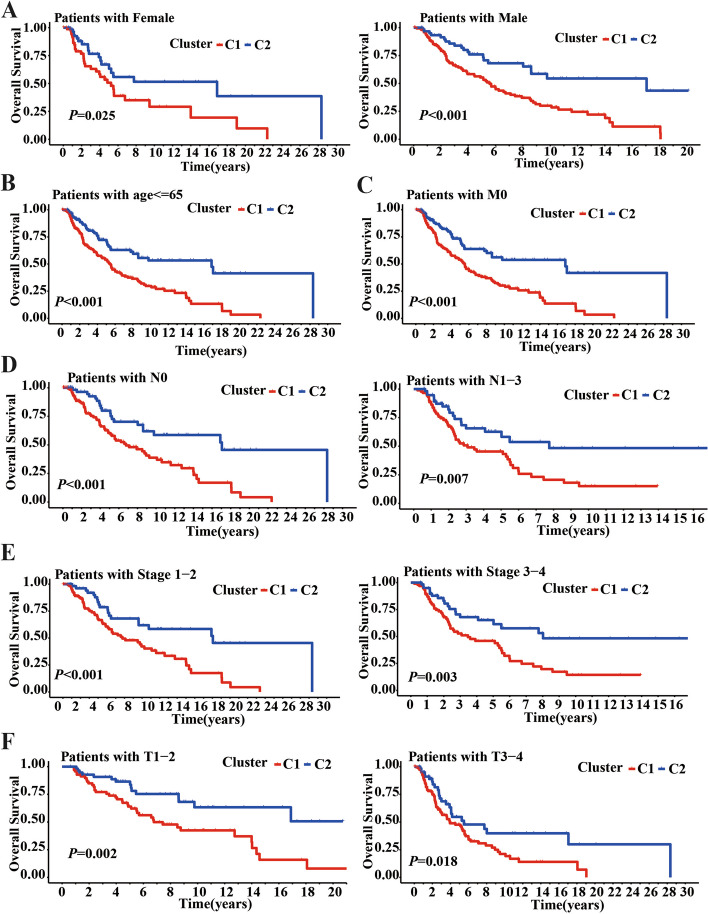
The occurrence and progression of skin cutaneous melanoma (SKCM) is strongly associated with immune cells infiltrating the tumor microenvironment (TME). This study examined the expression, prognosis, and immune relevance of SIGLEC9 in SKCM using multiple online databases. Analysis of the GEPIA2 and Ualcan databases revealed that SIGLEC9 is highly expressed in SKCM, and patients with high SIGLEC9 expression had improved overall survival (OS). Furthermore, the mutation rate of SIGLEC9 in SKCM patients was found to be 5.41%, the highest observed. The expression of SIGLEC9 was positively correlated with macrophages, neutrophils and B cells, CD8 + T cells, CD4 + T cells, and dendritic cells, according to TIMER. Based on TCGA-SKCM data, we verified that high SIGLEC9 expression is closely associated with a good prognosis for SKCM patients, including overall survival, progression-free interval, and disease-specific survival. This positive prognosis could be due to the infiltration of immune cells into the TME. Additionally, our analysis of single-cell transcriptome data revealed that SIGLEC9 not only played a role in the normal skin immune microenvironment, but is also highly expressed in immune cell subpopulations of SKCM patients, regulating the immune response to tumors. Our findings suggest that the close association between SIGLEC9 and SKCM prognosis is primarily mediated by its effect on the tumor immune microenvironment.

Keywords: SIGLEC9; Single cell; Skin cutaneous melanoma; Tumor infiltrating immune cells; Tumor microenvironment.


Conflict of interest statement

The authors declare no conflict of interest.

Figures

Fig. 1
Fig. 1
Exploring the significance of SIGLEC9 expression in SKCM and its implications for prognosis. A Examining the expression characteristics of both normal and cancerous SKCM tissues through GEPIA2 analysis (* P < 0.05). B The expression patterns of SIGLEC9 across different stages, as depicted in GEPIA2. C-D Analyzing the impact of high and low SIGLEC9 expression levels on SKCM patient OS and DFS using data from the GEPIA2 database. E Analyzing the impact of high and low SIGLEC9 expression levels on SKCM patient and OS using data from the Ualcan database. F-I Using TCGA data and Kaplan–Meier survival curves to explore the relationship between SIGLEC9 expression levels and OS, PFI, DSS, and PFS in SKCM
Fig. 2
Fig. 2
The expression of the SIGLEC9 protein in normal skin and SKCM tissue, as shown by scale bars, with lengths of 100 μm, 50 μm, and 25 μm from left to right
Fig. 3
Fig. 3
The three-dimensional structure of SIGLEC9 protein and the status of gene mutations. A Three-dimensional structure of the SIGLEC9 protein. B Pan-cancer analysis of mutations in the SIGLEC9 gene. C Location of mutations in SIGLEC9
Fig. 4
Fig. 4
SIGLEC9 expression and its association with clinical parameters in patients. A Univariate Cox analysis evaluating prognostic factors in SKCM. B Multivariate Cox analysis evaluating factors in SKCM. (C)SIGLEC9 expression in relation to clinical indicators
Fig. 5
Fig. 5
Prognostic analysis of SKCM patients. A Nomogram for predicting prognosis. B Calibration curves for the Nomogram. C OS curves for female and male patients with high and low expression of SIGLEC9. D OS curves for ≥ 65 years with high and low expression of SIGLEC9. E OS curves for M0 patients with high and low expression of SIGLEC9. F OS curves for N0 and N1-3 patients with high and low expression of SIGLEC9. G OS curves for Stage 1–2 and Stage 3–4 patients with high and low expression of SIGLEC9. H OS curves for T1-2 and T3-4 patients with high and low expression of SIGLEC9
Fig. 6
Fig. 6
Co-expression analysis of genes with SIGLEC9. A Circular visualization tool for analyzing co-expressed genes. B-G Scatter plot visualizing the positive correlation between SIGLEC9 and its co-expressed genes
Fig. 7
Fig. 7
Analysis of gene expression differences and functions between SIGLEC9 groups. A Visualization of gene expression differences between high and low SIGLEC9 expression groups using a heat-map. B Functional analysis of differentially expressed genes using GSEA. C Functional analysis of differentially expressed genes using GO. D Functional analysis of differentially expressed genes using KEGG
Fig. 8
Fig. 8
Investigation of the immune correlation between SIGLEC9 and the TME. A Analysis of the relative abundance of immune cells between the high and low SIGLEC9 expression groups. (* P < 0.05, ** P < 0.01, *** P < 0.001). B Correlation analysis of immune cells with SIGLEC9 expression. C Validation of the association between SIGLEC9 expression and immune cells using the TIMER database
Fig. 9
Fig. 9
Analysis of SIGLEC9 with immune checkpoints and immune therapy. A The heatmap illustrates the correlation between immune checkpoint genes and SIGLEC9 expression, where darker shades of red indicate a stronger correlation. B Analysis of differences in immune therapy among patients with different levels of SIGLEC9 expression. C Analysis of differences in StromalScore, ImmuneScore, and ESTIMATEScore between high and low SIGLEC9 expression groups in the TME (*** P < 0.001)
Fig. 10
Fig. 10
The expression profile of SIGLEC9 in various subpopulations of single cells present in the normal skin was be explored
Fig. 11
Fig. 11
The expression profile of SIGLEC9 in various subpopulations of single cells present in SKCM was be explored
Fig. 12
Fig. 12
Cluster analysis of SIGLEC9. A The consensus matrices of the clusters. B Kaplan–Meier survival curve of OS between C1 and C2. C Kaplan–Meier survival curve of DSS between C1 and C2. D Kaplan–Meier survival curve of PFI between C1 and C2
Fig. 13
Fig. 13
Analysis of prognostic subgroups in SKCM. A OS curves for female and male patients in C1 and C2 clusters. B OS curves for age ≥ 65 years patients in C1 and C2 clusters. C OS curves for M0 patients in C1 and C2 clusters. D OS curves for N0 and N1-3 patients in C1 and C2 clusters. E OS curves for Stage 1–2 and Stage 3–4 patients in C1 and C2 clusters. F OS curves for T1-2 and T3-4 patients in C1 and C2 clusters
Fig. 14
Fig. 14
The immune-related analysis of SKCM patient clustering. A Analysis of differential immune checkpoints between C1 and C2 clusters. (*P < 0.05, **P < 0.01, ***P < 0.001). B Analysis of differential immune cells infiltrating the TME between C1 and C2 clusters. (*P < 0.05, **P < 0.01, ***P < 0.001)

References

    1. Lim SY, et al. The molecular and functional landscape of resistance to immune checkpoint blockade in melanoma. Nat Commun. 2023;14(1):1516. 10.1038/s41467-023-36979-y - DOI - PMC - PubMed
    1. Skudalski L, et al. Melanoma an update on systemic therapies. J Am Acad Dermatol. 2022;86(3):515–24. 10.1016/j.jaad.2021.09.075 - DOI - PubMed
    1. Li J, et al. Single cell characterization of the cellular landscape of acral melanoma identifies novel targets for immunotherapy. Clin Cancer Res. 2022;28(10):2131–46. 10.1158/1078-0432.CCR-21-3145 - DOI - PMC - PubMed
    1. Luke JJ, et al. Targeted agents and immunotherapies: optimizing outcomes in melanoma. Nat Rev Clin Oncol. 2017;14(8):463–82. 10.1038/nrclinonc.2017.43 - DOI - PubMed
    1. Ziogas DC, et al. Mechanisms of resistance to immune checkpoint inhibitors in melanoma: what we have to overcome? Cancer Treat Rev. 2023;113: 102499. 10.1016/j.ctrv.2022.102499 - DOI - PubMed

MeSH terms

Substances