

Using established biorepositories for emerging research questions: a feasibility study
- PMID: 39154002
- PMCID: PMC11330044
- DOI: 10.1186/s12014-024-09504-6
Using established biorepositories for emerging research questions: a feasibility study
Abstract
Background: Proteomics and metabolomics offer substantial potential for advancing kidney transplant research by providing versatile opportunities for gaining insights into the biomolecular processes occurring in donors, recipients, and grafts. To achieve this, adequate quality and numbers of biological samples are required. Whilst access to donor samples is facilitated by initiatives such as the QUOD biobank, an adequately powered biobank allowing exploration of recipient-related aspects in long-term transplant outcomes is missing. Rich, yet unverified resources of recipient material are the serum repositories present in the immunological laboratories of kidney transplant centers that prospectively collect recipient sera for immunological monitoring. However, it is yet unsure whether these samples are also suitable for -omics applications, since such clinical samples are collected and stored by individual centers using non-uniform protocols and undergo an undocumented number of freeze-thaw cycles. Whilst these handling and storage aspects may affect individual proteins and metabolites, it was reasoned that incidental handling/storage artifacts will have a limited effect on a theoretical network (pathway) analysis. To test the potential of such long-term stored clinical serum samples for pathway profiling, we submitted these samples to discovery proteomics and metabolomics.
Methods: A mass spectrometry-based shotgun discovery approach was used to obtain an overview of proteins and metabolites in clinical serum samples from the immunological laboratories of the Dutch PROCARE consortium. Parallel analyses were performed with material from the strictly protocolized QUOD biobank.
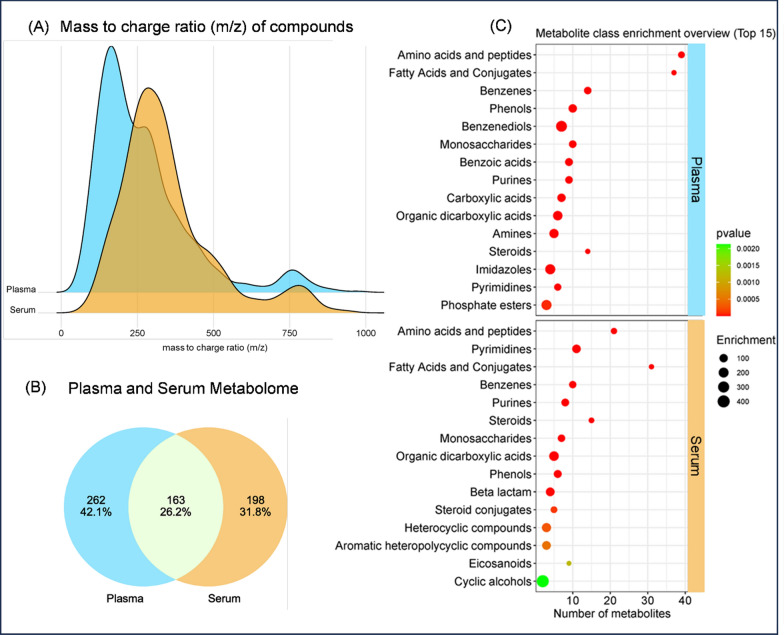
Results: Following metabolomics, more than 800 compounds could be identified in both sample groups, of which 163 endogenous metabolites were found in samples from both biorepositories. Proteomics yielded more than 600 proteins in both groups. Despite the higher prevalence of fragments in the clinical, non-uniformly collected samples compared to the biobanked ones (42.5% vs 26.5% of their proteomes, respectively), these fragments could still be connected to their parent proteins. Next, the proteomic and metabolomic profiles were successfully mapped onto theoretical pathways through integrated pathway analysis, which showed significant enrichment of 79 pathways.
Conclusions: This feasibility study demonstrated that long-term stored serum samples from clinical biorepositories can be used for qualitative proteomic and metabolomic pathway analysis, a notion with far-reaching implications for all biomedical, long-term outcome-dependent research questions and studies focusing on rare events.
Keywords: Biobank; Kidney transplantation; Metabolomics; Plasma; Proteomics; Serum.
© 2024. The Author(s).
Conflict of interest statement
The authors declare no competing interests.
Figures


References
-
- van Leeuwen LL, Spraakman NA, Brat A, Huang H, Thorne AM, Bonham S, et al. Proteomic analysis of machine perfusion solution from brain dead donor kidneys reveals that elevated complement, cytoskeleton and lipid metabolism proteins are associated with 1-year outcome. Transpl Int. 2021;34(9):1618–29. 10.1111/tri.13984 - DOI - PMC - PubMed
LinkOut - more resources
Full Text Sources