. 2024 Aug 17;15(1):7097.
doi: 10.1038/s41467-024-51637-7.

Discovery of an embryonically derived bipotent population of endothelial-macrophage progenitor cells in postnatal aorta

Affiliations

Discovery of an embryonically derived bipotent population of endothelial-macrophage progenitor cells in postnatal aorta

Anna E Williamson et al. Nat Commun. .

Abstract

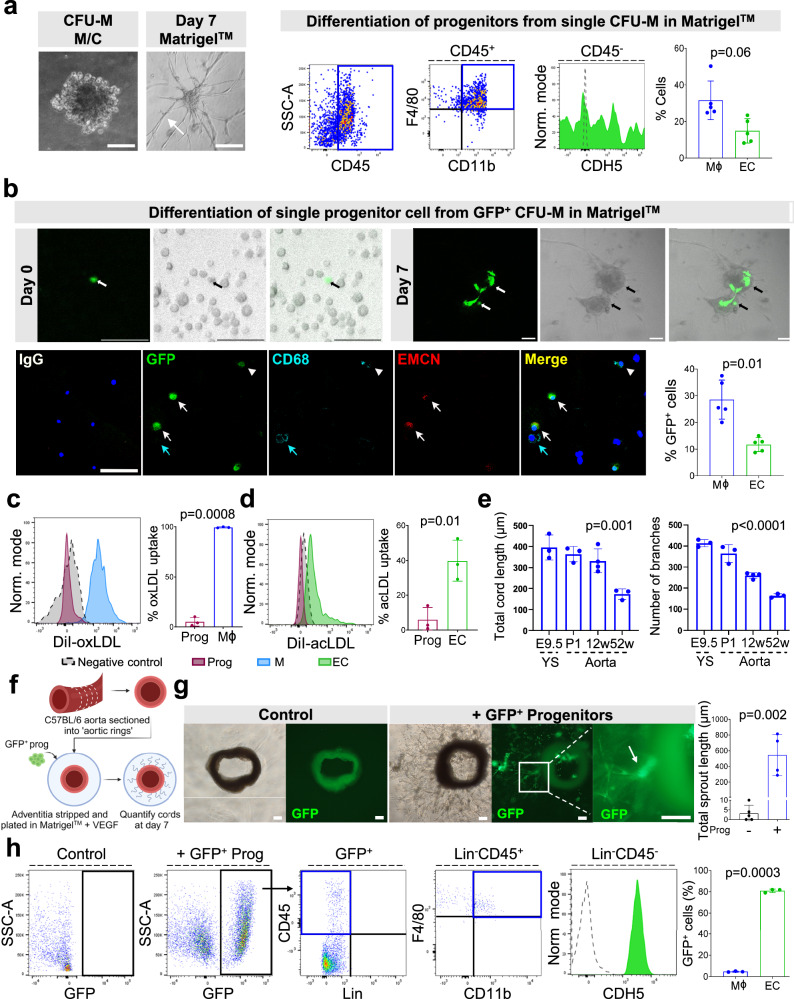
Converging evidence indicates that extra-embryonic yolk sac is the source of both macrophages and endothelial cells in adult mouse tissues. Prevailing views are that these embryonically derived cells are maintained after birth by proliferative self-renewal in their differentiated states. Here we identify clonogenic endothelial-macrophage (EndoMac) progenitor cells in the adventitia of embryonic and postnatal mouse aorta, that are independent of Flt3-mediated bone marrow hematopoiesis and derive from an early embryonic CX3CR1+ and CSF1R+ source. These bipotent progenitors are proliferative and vasculogenic, contributing to adventitial neovascularization and formation of perfused blood vessels after transfer into ischemic tissue. We establish a regulatory role for angiotensin II, which enhances their clonogenic and differentiation properties and rapidly stimulates their proliferative expansion in vivo. Our findings demonstrate that embryonically derived EndoMac progenitors participate in local vasculogenic responses in the aortic wall by contributing to the expansion of endothelial cells and macrophages postnatally.


Conflict of interest statement

S.J.N. has received research support from AstraZeneca, Amgen, Anthera, Eli Lilly, Esperion, Novartis, Cerenis, The Medicines Company, Resverlogix, InfraReDx, Roche, Sanofi-Regeneron and Liposcience and is a consultant for AstraZeneca, Akcea, Eli Lilly, Anthera, Kowa, Omthera, Merck, Takeda, Resverlogix, Sanofi-Regeneron, CSL Behring, Esperion and Boehringer Ingelheim. P.J.P. has received research support from Abbott Vascular, consulting fees from Amgen, Esperion, Eli Lilly, Novartis, Novo Nordisk and Sanofi, and speaker honoraria from Amgen, AstraZeneca, Bayer, Boehringer Ingelheim, Merck Schering-Plough, Pfizer, Novartis, Novo Nordisk and Sanofi. The remaining authors declare no competing interests.

Figures

Fig. 1
Fig. 1. Immunophenotypic characterization of CFU-M progenitors in adult aorta.
a Examples of small, medium and large CFU-M from 12 w C57BL/6J aortic cells. Pie chart shows breakdown of CFU-M by colony size (n = 5 mice). b Representative example of renewal of 2° CFU-M from a single cell plated from a 1° medium CFU­M. Flow cytometry of cells from (c) 1° and (d) 2° aortic CFU-M of medium size (n ≥ 3 for each marker). Blue histogram, sample; dotted histogram, Fluorescence-minus-one (FMO) control. e Flow cytometry shows presence of progenitors in 12 w C57BL/6J aorta in vivo (n = 6 for each marker with 1–2 mice per replication). f Flow cytometry of bromodeoxyuridine (BrdU) uptake versus 7-aminoactinomycin (7-AAD) labeled cells gated from aortic progenitors in vivo. Dotted box, cells in the synthetic phase (S-phase). Graph shows percentages of progenitors (Prog) and macrophages (Mϕ) in S-phase from 12 w C57BL/6J aorta, 24 h after administration of BrdU (n = 4 mice; two-tailed paired t-test). g Confocal microscopy of immunolabeled section of descending aorta from 12 w Cx3cr1GFP/+ mouse shows adventitial (Ad) CX3CR1+c-Kit+ progenitors. L, lumen. h CFU-M yield from fluorescence assisted cell sorting (FACS)-isolated cells from adult Cx3cr1GFP/+ aorta (two experiments, n = 6 mice each; one-way repeated measures ANOVA). N/A, not applicable. CFU-M yield from 12 w C57BL/6J aortic cells in presence or absence of (i) 100 nM CX3CL1 or (j) 50 nM M-CSF (n = 6 mice; two-tailed paired t-tests). Frequency of (k) CFU­M (n ≥ 8) and (l) progenitors (n = 5) from aortas of 12 w Cx3cr1GFP/+ and Cx3cr1GFP/GFP mice. Data were analyzed using two-tailed, unpaired t-test (k) and Mann–Whitney U test (l). Data are summarized as mean ± SD. Scale bar, 100 µm in (a), (b) and 20 µm in (g). Also see Supplementary Fig. 1–3. Source data are provided as a Source Data file.
Fig. 2
Fig. 2. Aortic CFU-M progenitors are independent of Flt3-mediated hematopoiesis and are seeded embryonically.
a Light and fluorescence microscopy images of CFU-M from bone marrow (BM) and aorta (Ao) of adult Flt3Cre x RosamTmG mice. Graph shows Flt3+ (green) and Flt3- (red) CFU-M yield from BM and Ao (n = 4 mice; two-tailed paired t-test). b Flow cytometry histograms showing expression of tdTomato (tdTom, red histogram) and green fluorescent protein (GFP, green histogram) on cells contained in CFU-M from Flt3Cre x RosamTmG aorta (n = 1). Dotted histogram, C57BL/6J control. c Flow cytometry plots show GFP-tdTom+ (Flt3-Cre) status of aortic progenitors from adult Flt3Cre x RosamTmG mice. Percentage represents mean of n = 4 mice. Please see Source Data file for fluorescence-minus-one (FMO) controls. d Comparison of proportion of GFP+ (Flt3-Cre+) cells in BM long-term (LT) and short-term (ST) hematopoietic cells (HSCs), multipotent progenitors (MPPs), blood monocytes (Mono) and aortic progenitors (Prog), macrophages (Mϕ) and endothelial cells (ECs) from adult Flt3Cre x RosamTmG mice (n ≥ 4). LSK, LinSca-1+c-Kit+; Bl, blood. Please see Methods for immunophenotypic definitions of BM cell populations. Comparisons of (e) CFU-M yield (n = 5) and (f) number of progenitors (n = 4) from C57BL/6J aortas at different ages. Data in (e) were analyzed using Kruskal–Wallis test with Dunn’s multiple comparisons test (†p = 0.002, P1 vs 52 w) and in (f) using one-way ANOVA with Tukey’s multiple comparisons test (*p = 0.02 for 3 w vs 52 w, ‡p = 0.0006 and #p < 0.0001 vs P1). g CFU-M yield from different embryonic tissues of Cx3cr1GFP/+ mice at different embryonic ages (YS - E7.5: 4, E8.5: 1, E9.5: 3, E10.5: 12, E11.5 and E12.5: 8 and E15.5: 10 embryos; AGM - E10.5: 11, E11.5 and E12.5: 12 and E15.5: 6 embryos; Embryo - E7.5: 3, E8.5: 5 and E9.5: 6 embryos). AGM aorta-gonad-mesonephros, YS yolk sac. h CFU-M yield from different subpopulations of fluorescence assisted cell sorting (FACS)-isolated cells from E9.5 YS from Cx3cr1GFP/+ mice (n = 3 experiments, each using ≥ 6 pooled YS; repeated measures one-way ANOVA; p = 0.003). i Flow cytometry of digests of YS, whole embryo and AGM from Cx3cr1GFP/+mice at different embryonic ages showing CX3CR1/GFP+ cells (top row) and CX3CR1/GFP+c-Kit+CD45+ progenitors (bottom row) (n ≥ 3 mice). j Number of CX3CR1/GFP+c-Kit+CD45+ progenitors in YS, whole embryo or AGM at different embryonic ages (n ≥ 3 mice). k Confocal microscopy of immunolabeled E12.5 and E15.5 AGM from Cx3cr1GFP/+ mice shows adventitial CX3CR1/GFP+c-Kit+ progenitors (arrows). L, lumen. Data are summarized as mean or mean ± SD. Scale bar, 100 μm in (a) and 50 μm in (k). Also see Supplementary Figs. 4 and 5. Source data are provided as a Source Data file.
Fig. 3
Fig. 3. Aortic CFU-M progenitors arise from an early embryonic CX3CR1+ source.
af Tamoxifen (TAM)-induced labeling was performed in Cx3cr1CreER-YFP x RosatdTom mice at E9.5 for subsequent analysis. a Representative plot shows negligible tdTomato (tdTom) expression in 12 w bone marrow (BM) (n = 4 mice). b Image of tdTom+ CFU-M from 12 w aorta. Graph shows % of tdTom+ CFU-M from different tissues and ages (n = 4 mice). AGM, aorta-gonad-mesonephros; Ao, aorta. c, d Graph and flow cytometry plots show composition of tdTom+ cells in E15.5 AGM (n = 4 mice) and 12 w aorta (n = 7 mice), with gated regions showing progenitors (Prog, maroon), macrophages (Mϕ, blue) and endothelial cells (EC, green). tdTom expression from Cx3cr1CreER-YFP x RosatdTom mice which did not receive TAM (TAM) is also shown as negative control (d). Data in (c) were analyzed using repeated measures one-way ANOVA (p = 0.004 for comparison at 12 w) with Tukey’s multiple comparisons test (*p = 0.02 for Prog vs Mϕ and p = 0.04 for Mϕ vs EC). e, f Representative histograms and graph show % tdTom expression in different cell populations from 12 w mice (blood monocytes: 4 mice, all other populations: 7 mice). Red histogram, sample; dotted histogram, TAM- control. Mono, monocytes. Please see Source Data file for normalized % tdTom expression to microglia. g Confocal microscopy images of immunolabeled sections of adult aorta from E9.5 TAM-induced Cx3cr1CreER-YFP x RosatdTom mice show VE-cadherin (top row), CD68 (middle row) and c-Kit (bottom row) expression in tdTom+ cells (arrows). Merged images of IgG controls for each labeling are also shown. Ad, adventitia. L, lumen. Please see Source Data file for larger version of these images. Data summarized as mean ± SD. Scale bar, 100 μm in (b) and 40 μm in (g). Also see Supplementary Figs. 6 and 7. Source data are provided as a Source Data file.
Fig. 4
Fig. 4. Aortic CFU-M progenitors have endothelial and macrophage potential.
a Light microscopy images show a single CFU-M from C57BL/6J aorta and a branching network formed by its progenitors in MatrigelTM after 7 d. Flow cytometry plots and graph show these networks contained new macrophages (Mϕ) and endothelial cells (EC) (n = 5 colonies; two-tailed Wilcoxon matched-pairs signed-rank test). b Top row: Confocal microscopy images (fluorescence, phase contrast and merged) show single GFP+ progenitor cell seeded with GFP- progenitors at day 0 and resulting GFP+ sprout at day 7. Bottom row: Confocal microscopy images of immunolabeled cells show presence of GFP+CD68+ macrophage (arrowhead) and GFP+EMCN+ endothelial cells (white arrows). Cyan arrow indicates GFP-CD68+ macrophage. Merged image from corresponding IgG isotype negative control staining is also shown. Please see Source Data file for larger version of these images. Graph summarizes frequency of macrophages and endothelial cells arising from a single GFP+ progenitor cell in replicate wells containing both cell types (n = 5 replicate wells; two-tailed paired t-test). Uptake of (c) DiI-oxLDL or (d) DiI-acLDL by aortic progenitors (Prog) and their macrophage or endothelial cell progeny produced in MatrigelTM (n = 3 mice; two-tailed paired t-tests). e Total cord length and number of branches produced in MatrigelTM by E9.5 yolk sac (YS) or aortic CFU-M progenitors from C57BL/6J mice of different ages (E9.5 YS, P1 and 52 w: 3 mice each; 12 w: 4 mice). Data were analyzed using one-way ANOVA with Tukey’s multiple comparisons test. p = 0.001, 0.004 and 0.008, respectively for E9.5, P1 and 12 w vs 52 w (left). p < 0.0001 for E9.5 vs 12 w and 52 w, and for P1 vs 52 w; p = 0.001 for P1 vs 12 w; p = 0.002 for 12 w vs 52 w (right). f Schematic of sprouting assay performed by culturing aortic progenitors from adult GFP mice with adventitia-less aortic rings from adult C57BL/6J mice. g Light and fluorescence microscopy images show adventitial sprouting without (control) and with (+) addition of GFP+ aortic progenitors, including higher magnification image of the boxed region. Graph shows quantitative results for sprout length (Prog-: 5 mice, Prog+: 4 mice; two-tailed unpaired t-test). h Flow cytometry plots and graph show the cells produced by culturing GFP+ aortic progenitors in aortic ring assay for 7 d (n = 3 mice with ≥4 replicates each; two-tailed paired t-test). Data summarized as mean ± SD. Scale bar, 100 µm. Also see Supplementary Figs. 8 and 9 and Supplementary Table 1. Source data are provided as a Source Data file. Figure 4 panel (f) created with BioRender.com released under a Creative Commons Attribution-Non-commercial-No Derivs 4.0 International license.
Fig. 5
Fig. 5. CFU-M progenitors have endothelial-macrophage plasticity and vasculogenic capacity in vivo.
a Schematic of 1° transfer of GFP+ aortic progenitors in hindlimb muscle after hindlimb ischemia surgery with 14 d follow-up. b Laser Doppler perfusion images of mice on day 0 and 14 after ischemia surgery and receiving cell-free control (above) or progenitors (Prog; below). Graph shows results of follow-up over 14 d (n = 6 mice). Data was analyzed using mixed effects two-way ANOVA (p < 0.0001 for time, p = 0.03 for group and p = 0.005 for time x group) with Sidak’s multiple comparisons test (#p = 0.0009 for progenitor vs control). c Fluorescence-minus-one (FMO) control staining used to analyze the composition of cells produced by engrafted GFP+ progenitors after transfer into ischemic hindlimb muscle. GFP, green fluorescent protein. d Flow cytometry plots and graph show the cells produced by donor cells in recipient muscle (n = 6 mice). Green histogram, sample; dotted histogram, FMO control. Data was analyzed using repeated measures one-way ANOVA with Tukey’s multiple comparisons test (*p = 0.02 vs Mϕ). Mϕ, macrophages; EC, endothelial cells. e Confocal microscopy of immunolabeled recipient ischemic muscle shows neovessels lined by GFP+CD31+ endothelial cells (arrows) with cluster of GFP+CD68+ macrophages (arrowhead) (above) and perfused with host TER-119+ erythrocytes (below). L, lumen. f Schematic of 2° transfer of GFP+ progenitors into hindlimb muscle after hindlimb ischemia surgery. M/C, Methylcellulose. g Flow cytometry plots and graph show cells produced by donor cells after 2° transfer (n = 3 mice; repeated measures one-way ANOVA with Tukey’s multiple comparisons test; *p = 0.02 for Mϕ and p = 0.04 for EC vs Prog). h Schematic of 1° transfer of GFP+ aortic progenitors in hindlimb muscle after induction of hindlimb ischemia with 56 d follow-up. i Flow cytometry plots and graph show cells produced by donor cells 8 w after 1° transfer (n = 3 mice; repeated measures one-way ANOVA with Tukey’s multiple comparisons test; *p = 0.02 for Mϕ and †p = 0.008 for Prog vs EC). Data summarized as mean ± SD. Scale bar, 20 µm. Also see Supplementary Fig. 10. Source data are provided as a Source Data file. Figure 5 panels (a), (f) and (h) created with BioRender.com released under a Creative Commons Attribution-Non-commercial-No Derivs 4.0 International license.
Fig. 6
Fig. 6. Aortic CFU-M progenitors exhibit a myelopoietic and vasculogenic transcriptional profile.
Aortic CFU-M progenitors cultured from two adult C57BL/6J mice were pooled and viable cells analyzed by scRNA-seq. a UMAP plot of 7966 cells that passed quality controls colored by cluster assignment. Each dot represents a cell. Cell clusters are colored as indicated. Prolif, proliferative. b Phylogenetic tree shows the hierarchical relationships of assigned clusters. c Expression levels of Mki67 overlaid on the UMAP plot showing cell specificity of expression. Expression levels are shown as log normalized counts. The gray to red gradient represents low to high values. Predominant expression can be seen in the proliferative clusters. d Dot plot shows the top 10 differentially expressed genes in each cluster and relative expression levels of those genes in all clusters. Purple to red gradient represents average expression levels from low to high. Dot size denotes percent cells expressing a gene, as indicated. e Violin plots illustrate cluster-wise expression of the genes corresponding to the key surface markers expressed by progenitors, along with selected mature endothelial (top) and macrophage marker (bottom) genes. f Expression levels of the endothelial gene Tek overlaid on the UMAP plot showing minimal expression. Expression levels of the indicated marker genes for (g) definitive hematopoiesis, (h) hemangioblasts from embryonic mesenchyme, (i) YS EMPs (EMP), pre-macrophages (Pre-mac), myelopoiesis and vasculogenesis/angiogenesis, overlaid on the UMAP plot showing cell specificity of expression. Also see Supplementary Fig. 11.
Fig. 7
Fig. 7. Regulatory effects of Angiotensin II on aortic EndoMac progenitors.
a Surface expression of ACE, AGTR1 and AGTR2 on progenitors from aortic CFU-M of 12 w C57BL/6J mice (n = 6 mice). b ACE expression on progenitors in aortic digests from 12 w C57BL/6J mice (n = 4 mice). c ACE expression on progenitors from E9.5 YS CFU-M from C57BL/6J mice (n = 3 mice). d Normalized expression of Agtr1 and Agtr2 mRNA in progenitors from aortic CFU-M relative to donor-matched aortic digests from 12 w C57BL/6J mice (n = 6 mice; two-tailed Wilcoxon matched-pairs signed-rank tests). e Aortic CFU-M yield with different concentrations of AngII, normalized to no AngII control (n = 6, 12 w C57BL/6J mice; Friedman test with Dunn’s multiple comparisons test; *p = 0.04 and †p = 0.006 vs control). f Aortic CFU-M yield from 12 w C57BL/6J mice across serial passages in the presence or absence of 100 nM AngII (n = 4 mice). g Aortic CFU-M yield in the presence of inhibitors of ACE (Enalapril), AGTR1 (Losartan) and AGTR2 (PD123319) normalized to no inhibitor (control) (n = 7 mice; Friedman test with Dunn’s multiple comparisons test; *p = 0.02 for AGTR1 and AGTR2 inhibitors vs control). h Schematic of peritoneal transfer assay. GFP+ aortic progenitors were intraperitoneally injected into 12 w C57BL/6J mice with daily injections of PBS, AngII or M-CSF for 72 h. i Immunophenotype of GFP+ aortic progenitors before intraperitoneal injection. j Flow cytometry shows de novo formation of macrophages from GFP+ aortic progenitors under different conditions in peritoneal cavity after 72 h. No progenitor cells (Prog) negative control for GFP also shown. GFP green fluorescent protein. k Number of macrophages produced by progenitors under different conditions (n = 4 mice per condition; one-way ANOVA with Tukey’s multiple comparisons test; *p = 0.01 vs PBS). lp mRNA expression of selected genes in aortic progenitors from 12 w C57BL/6J mice after treatment with AngII (AngII+). Expression normalized to β-actin and then to no AngII control (AngII-). Genes relate to (l) cell cycle, (m) progenitor/stem cell biology and self-renewal, (n) myelopoiesis, (o) macrophages, (p) endothelial biology and angiogenesis (n = 3 mice; two-tailed paired t-tests). Data summarized as mean ± SD. Source data are provided as a Source Data file. Figure 7 panel (h) created with BioRender.com released under a Creative Commons Attribution-Non-commercial-No Derivs 4.0 International license.
Fig. 8
Fig. 8. Angiotensin II-induced vascular inflammation involves early expansion of EndoMac progenitors in vivo.
a Schematic of PBS or AngII infusion in adult Flt3Cre x RosamTmG mice for 48 h. Comparisons of aortic cells from PBS and AngII treated mice for the numbers of Flt3-Cre+ (green) and Flt3-Cre- (red) (b) macrophages, (c) S-phase macrophages, (d) CFU-M yield, (e) progenitors and (f) S-phase progenitors (n = 6 mice/group). Cells were analyzed by flow cytometry for (b), (c), (e) and (f). Data were analyzed using two-tailed unpaired t-tests. p-values in red, Flt3-Cre- comparisons; p-values in green, Flt3-Cre+ comparisons. S-phase, synthetic phase. g Schematic of PBS or AngII infusion in E9.5 tamoxifen (TAM)-induced 12 w Cx3cr1CreER-YFP x RosatdTom mice with aortas harvested at different time-points. h Flow cytometry of tdTomato (tdTom+) labeling in aortic digests at different time-points. No TAM control also shown. Graph summarizes number of tdTom+ cells in aortas (12 h: 4 mice, 48 h: 3 mice, 168 h: 3 mice for PBS and 4 mice for AngII). Data were analyzed using two-way ANOVA. p = 0.04 for interaction, p = 0.005 for time and p = 0.03 for group. Comparisons between groups at a time-point were performed using two-tailed, Mann–Whitney U test or unpaired t-test. *p = 0.03. i Confocal microscopy of tdTom immunolabeled (red) sections of descending aorta after 48 h of PBS or AngII infusion. L, lumen. Nuclei stained with DAPI (blue). Graph shows % of tdTom+ cells in adventitia (Ad) (n = 4 mice, three sections each; two-tailed unpaired t-test). j tdTom+ aortic CFU-M yield (n = 4 mice). Data were analyzed using two-way ANOVA. p < 0.0001 for interaction, p = 0.0005 for time and p < 0.0001 for group. Comparisons between groups at each time-point were performed with two-tailed unpaired t-tests. #p < 0.0001 and ‡p = 0.0006. k Numbers of tdTom+ progenitors in aorta after different durations of AngII or PBS infusion (PBS: 10, 12 h: 4, 48 h: 3 and 168 h: 4 mice; one-way ANOVA with Tukey’s multiple comparisons test; *p = 0.03, ‡p = 0.0005 and #p < 0.0001 vs 12 h). Data summarized as mean ± SD. Scale bar, 50 μm. Source data are provided as a Source Data file. Figure 8 panels (a) and (g) created with BioRender.com released under a Creative Commons Attribution-Non-commercial-No Derivs 4.0 International license.

References

    1. Qian, B. Z. & Pollard, J. W. Macrophage diversity enhances tumor progression and metastasis. Cell141, 39–51 (2010). 10.1016/j.cell.2010.03.014 - DOI - PMC - PubMed
    1. Fantin, A. et al. Tissue macrophages act as cellular chaperones for vascular anastomosis downstream of VEGF-mediated endothelial tip cell induction. Blood116, 829–840 (2010). 10.1182/blood-2009-12-257832 - DOI - PMC - PubMed
    1. Gurevich, D. B. et al. Live imaging of wound angiogenesis reveals macrophage orchestrated vessel sprouting and regression. EMBO J.37, e97786 (2018). 10.15252/embj.201797786 - DOI - PMC - PubMed
    1. Cahill, T. J. et al. Tissue-resident macrophages regulate lymphatic vessel growth and patterning in the developing heart. Development148, dev194563 (2021). 10.1242/dev.194563 - DOI - PMC - PubMed
    1. He, H. et al. Endothelial cells provide an instructive niche for the differentiation and functional polarization of M2-like macrophages. Blood120, 3152–3162 (2012). 10.1182/blood-2012-04-422758 - DOI - PMC - PubMed

MeSH terms

Substances