. 2024 Aug 17;7(1):1011.
doi: 10.1038/s42003-024-06704-6.

FGFR1 governs iron homeostasis via regulating intracellular protein degradation pathways of IRP2 in prostate cancer cells

Affiliations

FGFR1 governs iron homeostasis via regulating intracellular protein degradation pathways of IRP2 in prostate cancer cells

Hui Lin et al. Commun Biol. .

Abstract

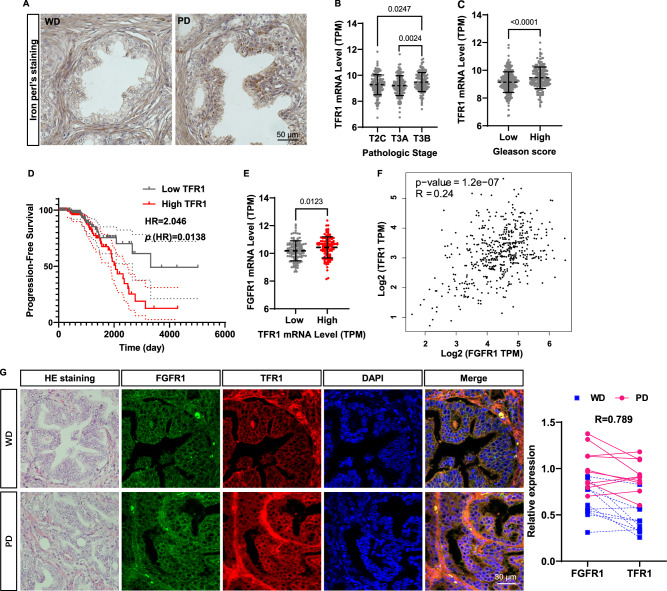
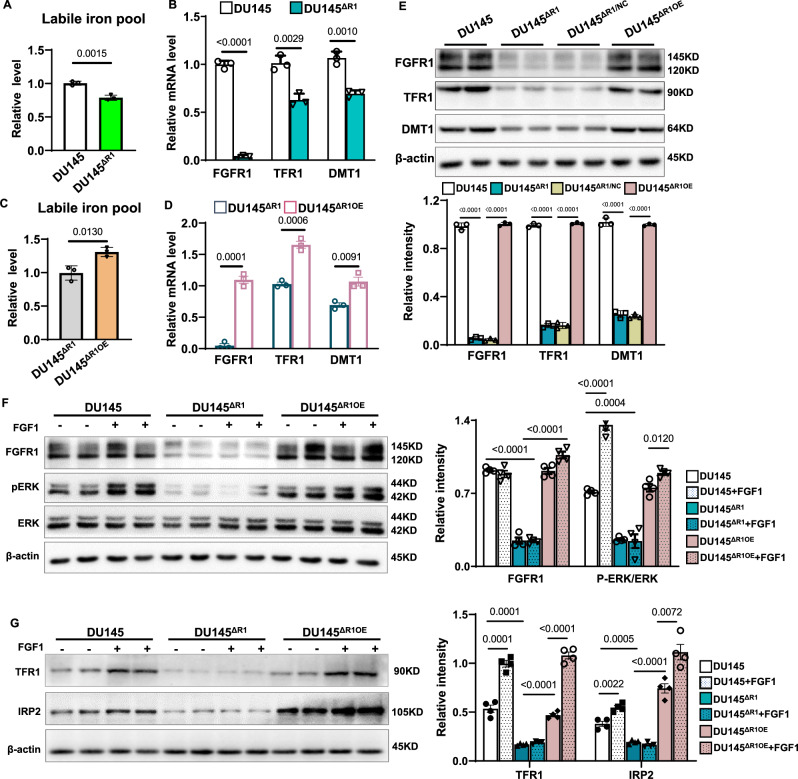
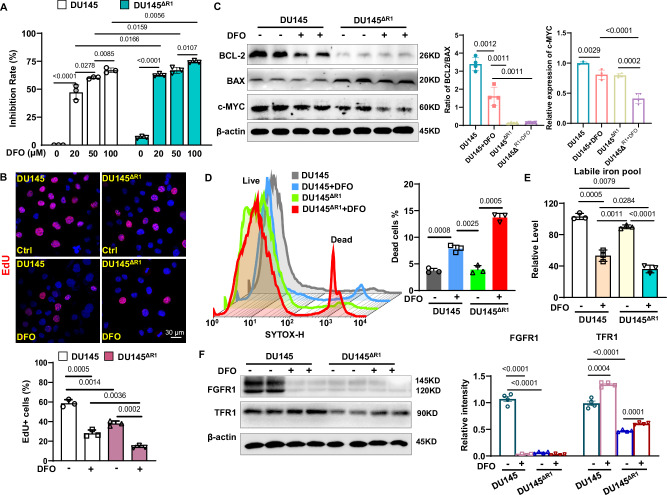
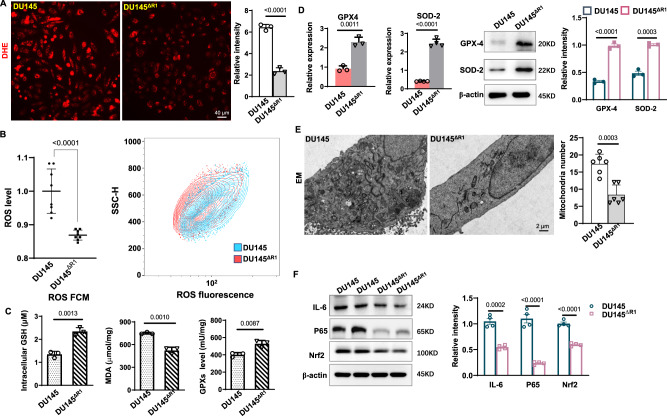
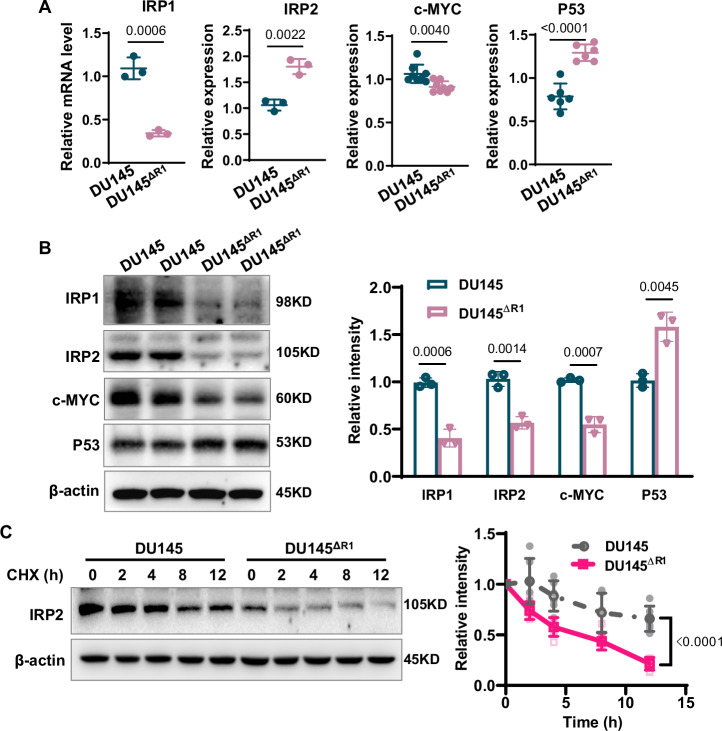
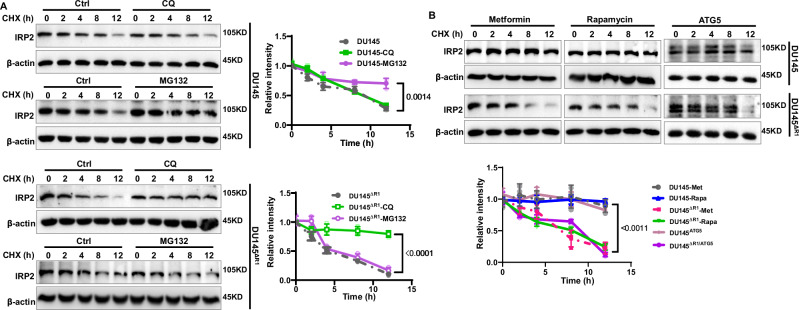
The acquisition of ectopic fibroblast growth factor receptor 1 (FGFR1) expression is well documented in prostate cancer (PCa) progression, notably in conferring tumor growth advantage and facilitating metastasis. However, how FGFR1 contributes to PCa progression is not fully revealed. Here we report that ectopic FGFR1 in PCa cells promotes transferrin receptor 1 (TFR1) expression and expands the labile iron pool (LIP), and vice versa. We further demonstrate that FGFR1 stabilizes iron regulatory proteins 2 (IRP2) and therefore, upregulates TFR1 via promoting IRP2 binding to the IRE of TFR1. Deletion of FGFR1 in DU145 cells decreases the LIP, which potentiates the anticancer efficacy of iron chelator. Intriguingly, forced expression of IRP2 in FGFR1 depleted cells reinstates TFR1 expression and LIP, subsequently restoring the tumorigenicity of the cells. Together, our results here unravel a new mechanism by which FGFR1 drives PCa progression and suggest a potential novel target for PCa therapy.


Conflict of interest statement

The authors declare no competing interests.

Figures

Fig. 1
Fig. 1. Ectopic expressed FGFR1 is associated with increased expression of TFR1 in PCa progression.
A Representative Perl’s staining enhanced with DAB of well differentiated and poorly differentiated human PCa tissues. Scale bars: 50 μm. B The mRNA level of TFR1 in pathologic stage of T2C, T3A, and T3B in PCa patients of TCGA database. Other stages were excluded due to the inadequate number of cases. C Analysis between TFR1 mRNA level and Gleason score in PCa patients of TCGA. Gleason score ≥ 8 defined as high and <8 defined as low. D Kaplan–Meier survival analysis was performed in low and high TFR1 mRNA level in PCa patients. Cutoff sets 25%. E The mRNA level of FGFR1 based on the mRNA level of TFR1 in TCGA. Cutoff on TFR1 sets 25%. F Correlation analysis between the mRNA level of TFR1 and FGFR1 in PCa patients of TCGA database. G HE staining and double immunofluorescence staining with FGFR1 (green) and TFR1 (red) between well and poorly differentiated human PCa tissues and the quantitative analyses with Image J. Scale bars: 30 μm. WD well differentiated. PD poorly differentiated. TPM Transcripts Per Million.
Fig. 2
Fig. 2. FGFR1 deletion decreases the LIP in PCa cells.
A Calcein AM was used to detect the labile iron pool. B Real-time qPCR was performed to analyze relative mRNA expression. C Calcein AM was used to detect the labile iron pool. D Real-time qPCR was performed to analyze relative mRNA expression. E Western blotting analysis of the indicated proteins and the quantitative analyses with Image J. β-actin was used as a loading control. F, G Western blotting analysis of the indicated proteins and the quantitative analyses with Image J. β-actin was used as a loading control (n = 4). Unless specified otherwise, data are represented as the mean ± SD of three independent experiments. DU145ΔR1, DU145 cells with FGFR1 knockout. DU145ΔR1OE, DU145ΔR1 with exogenous expression of FGFR1.
Fig. 3
Fig. 3. FGFR1 deletion potentiates the inhibitory effect of DFO in PCa cells.
A CCK8 analysis was performed to analyze viability of DU145 and DU145ΔR1 cells treated with DFO at different concentration (0 μM, 20 μM, 50 μM, and 100 μM) for 24 h. B EdU incorporation assay was used to analyze the proliferation of cells treating with 20 μM DFO, the ratio of EdU positive cells were calculated in three random areas by Image J software, DAPI (blue) for the counterstaining of nuclear. Scale bars: 30 μm. C Western blotting analysis of the indicated proteins and the quantitative analyses with Image J. β-actin was used as a loading control (n = 4). D SYTOX Green was used to detect the survival of DU145 and DU145ΔR1cells treated with 20 μM DFO for 24 h, the dead cells were detected by FCM. E Labile iron pool of DU145 and DU145ΔR1cells treated with DFO were detected with Calcein AM. F Western blotting analysis of the indicated proteins and the intensity was quantitated with Image J. β-actin was used as a loading control (n = 4). Unless specified otherwise, data are represented as the mean ± SD of three independent experiments. DU145ΔR1, DU145 cells with FGFR1 knockout.
Fig. 4
Fig. 4. FGFR1 deletion disrupts the oxidant/antioxidant balance.
A The representative image of DHE staining in DU145 and DU145ΔR1 cells. Scale bars: 40 μm. B ROS level detected by FCM with DHE in DU145 and DU145ΔR1 cells (n = 8). C Intracellular GSH level, MDA level, and GPXs level detected in DU145 and DU145ΔR1 cells. D Relative mRNA and protein level of GPX4 and SOD-2 in DU145 and DU145ΔR1 cells. E The representative image of mitochondria in DU145 and DU145ΔR1 cells by TEM, and the number of mitochondria is counted in right panel (n = 6). Scale bars: 2 μm. F Western blotting analysis of the indicated proteins and the intensity was quantitated with Image J. β-actin was used as a loading control (n = 4). Unless specified otherwise, data are represented as the mean ± SD of three independent experiments. DU145ΔR1, DU145 cells with FGFR1 knockout.
Fig. 5
Fig. 5. FGFR1 deletion accelerates the degradation of IRP2.
A Real-time qPCR was performed to analyze relative mRNA expression of IRP1/IRP2/c-MYC/P53 in DU145 and DU145ΔR1cells. B Western blotting analysis of the indicated proteins and the quantitative analyses of TFR1 with Image J. β-actin was used as a loading control. C Western blotting showing the expression of IRP2 in DU145 and DU145ΔR1 cells treated with CHX (100 μg/ml) for 0 h, 2 h, 4 h, 8 h, and 12 h. Data are shown as the mean ± SD (n = 5). Unless specified otherwise, data are represented as the mean ± SD of three independent experiments. DU145ΔR1, DU145 cells with FGFR1 knockout.
Fig. 6
Fig. 6. FGFR1 deletion alters the main degradation pathways of IRP2.
A DU145 and DU145ΔR1 cells treated with CHX (100 μg/ml) and CQ (50 μM) or MG132 (10 μM) for 0, 2, 4, 8 or 12 h, and then subjected to Western blotting with IRP2 antibody. B DU145 and DU145ΔR1 cells treated with Metformin (50 μM), Rapamycin (10 μM), or transfected with ATG5 for indicated time, followed by Western blotting showing the expression of IRP2. In A, B, panels were the quantitative analysis by Image J software and β-actin was used as a loading control. Data are shown as the mean ± SD (n = 3). CHX, Cycloheximide. CQ, Chloroquine. DU145ΔR1, DU145 cells with FGFR1 knockout.
Fig. 7
Fig. 7. FGFR1 deletion reduces the interaction of FBXL5 and IRP2.
A Immunofluorescence staining showing colocalization of IRP2 (green) and FBXL5 (red) in DU145 and DU145ΔR1 cells, DAPI for the counterstaining of nucleus. Middle/bottom panel was colocalization analysis and 3D view analysis of colocalization performed by image J software, intensity indication was in the upper left corner of 3D image. Scale bars: 20 μm. B Western blotting analysis of FBXL5 and the quantitative analyses with Image J (n = 3). C Western blotting analysis of the ubiquitination of IRP2 protein in DU145 and DU145ΔR1 cells. D The indicated cell lysates were prepared and immunoprecipitated with either agarose-conjugated anti-IRP2 or nonspecific anti-rabbit/mouse IgG antibodies as negative control. Immunoprecipitants and cell lysates were analyzed by western blotting. E, F RNA immunoprecipitation assay. Western blotting analysis of IRP2 after IRP2 specific antibody immunoprecipitation with cell lysate (n = 4). Input, cell lysate of DU145; IgG, DU145 cell lysate immunoprecipitated with IgG antibody as negative control (E). Quantitative RT-PCR analysis of the mRNA level of TFR1 after immunoprecipitation (n = 4) (F). Unless specified otherwise, data are represented as the mean ± SD of three independent experiments. DU145ΔR1, DU145 cells with FGFR1 knockout. DU145ΔR1/NC, DU145ΔR1 transfected with control plasmid. DU145ΔR1OE, DU145ΔR1 with exogenous expression of FGFR1.
Fig. 8
Fig. 8. Forced expression of IRP2 reinstates the LIP, increases cell proliferation, and restores tumorigenic activity in DU145ΔR1 cells.
A Statistical analysis of intracellular iron through Calcein AM for indicated cell groups (n = 3). B EdU incorporation assay was used to analyze the proliferation, the ratio of EdU positive cells were calculated in three random areas by Image J software, DAPI (blue) for the counterstaining of nuclear (n = 3). Scale bars: 30 μm. C Western blotting analysis of indicated proteins and the quantitative analyses with Image J (n = 3). D Tumor xenograft derived from the injection of DU145, DU145ΔR1, DU145ΔR1/NC, and DU145ΔR1/IRP2 cells into nude mice. Right panel was the statistical analysis of tumor volume and weight (n = 5). E The detection of labile iron pool in tumor xenograft tissues (n = 5). F Immunofluorescence staining showing FGFR1 (green) and TFR1 (red), FBXL5 (green) and IRP2 (red), and PCNA (red) in tumor xenograft. DAPI (blue) for the counterstaining of nuclear. Scale bars: 50 μm. Unless specified otherwise, data are represented as the mean ± SD of three independent experiments. DU145ΔR1, DU145 cells with FGFR1 knockout. DU145ΔR1/NC, DU145ΔR1 transfected with control plasmid. DU145ΔR1/IRP2, DU145ΔR1 transfected with IRP2 plasmid.
Fig. 9
Fig. 9. Schematic of FGFR1 governs iron homeostasis via IRP2 in PCa cells.
Iron bound to TF uptakes by TFR1 on the plasma membrane of cells is the most important way for cancer cells to absorb iron. TFR1 overexpression increases LIP in tumor cells to promote tumorigenesis and proliferation. FGFR1 positively regulates the cellular iron content via raising TFR1 expression through inhibiting the degradation of the master regulator IRP2, which is regulated in a reciprocal fashion to FBXL5, an iron-sensing E3 ubiquitin ligase. Under the condition of excess iron TFR1 expands, leading to accelerate PCa progression. TF, transferrin; TFR1, transferrin receptor 1; LIP, liable iron pool; IRP2, iron regulatory proteins 2; FBXL5, F-box and Leucine-rich repeat protein 5.

References

    1. Torre, L. A. et al. Global cancer statistics, 2012. CA Cancer J. Clin.65, 87–108 (2015). 10.3322/caac.21262 - DOI - PubMed
    1. Isbarn, H. et al. Androgen deprivation therapy for the treatment of prostate cancer: consider both benefits and risks. Eur. Urol.55, 62–75 (2009). 10.1016/j.eururo.2008.10.008 - DOI - PMC - PubMed
    1. Wesche, J., Haglund, K. & Haugsten, E. M. Fibroblast growth factors and their receptors in cancer. Biochem. J.437, 199–213 (2011). p. 10.1042/BJ20101603 - DOI - PubMed
    1. Corn, P. G., Wang, F., McKeehan, W. L. & Navone, N. Targeting fibroblast growth factor pathways in prostate cancer. Clin. Cancer Res.19, 5856–5866 (2013). 10.1158/1078-0432.CCR-13-1550 - DOI - PMC - PubMed
    1. Yang, F. et al. FGFR1 is essential for prostate cancer progression and metastasis. Cancer Res.73, 3716–3724 (2013). 10.1158/0008-5472.CAN-12-3274 - DOI - PMC - PubMed

Publication types

MeSH terms

LinkOut - more resources