. 2024 Aug 17;15(1):7091.
doi: 10.1038/s41467-024-51429-z.

Synergistic activation by Glass and Pointed promotes neuronal identity in the Drosophila eye disc

Affiliations

Synergistic activation by Glass and Pointed promotes neuronal identity in the Drosophila eye disc

Hongsu Wang et al. Nat Commun. .

Abstract

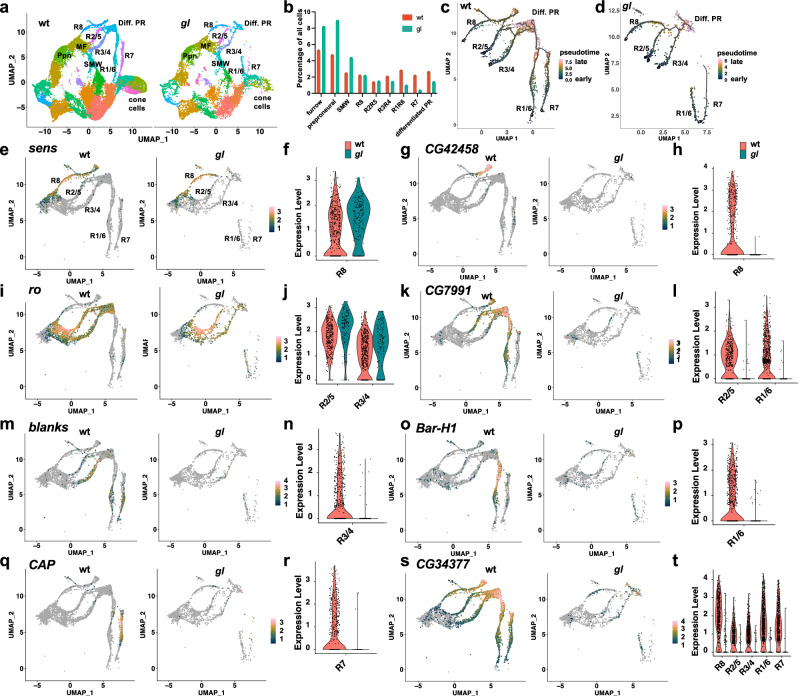
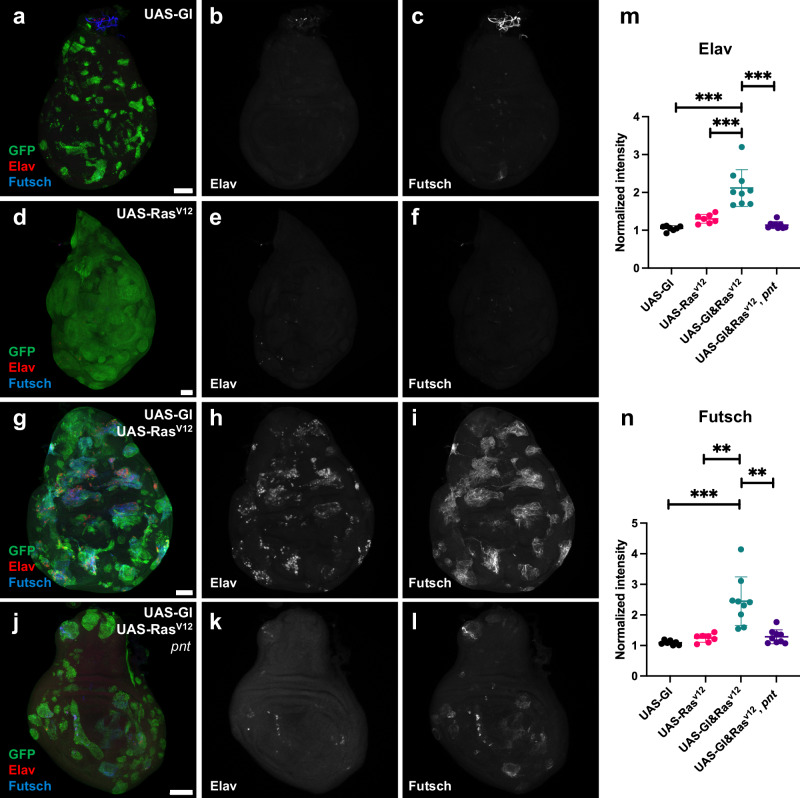
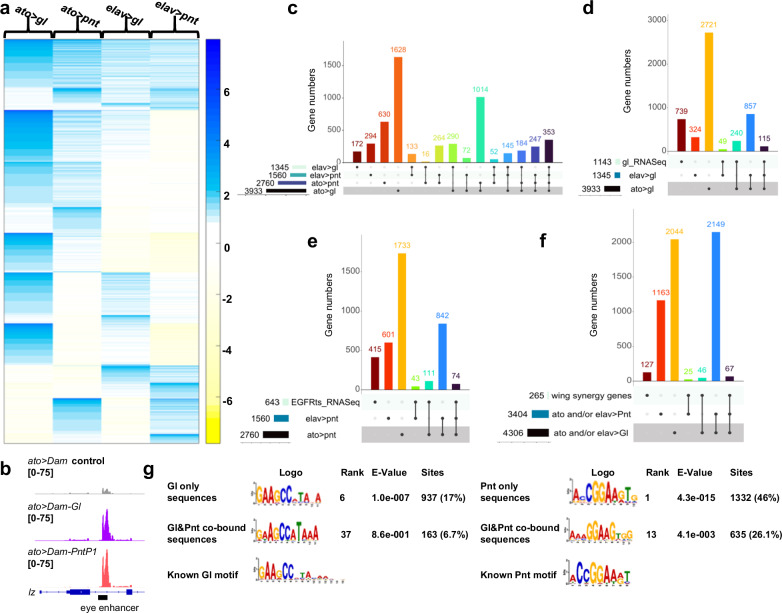
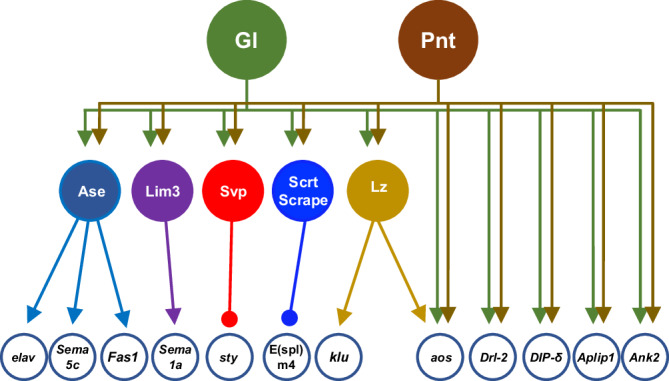
The integration of extrinsic signaling with cell-intrinsic transcription factors can direct progenitor cells to differentiate into distinct cell fates. In the developing Drosophila eye, differentiation of photoreceptors R1-R7 requires EGFR signaling mediated by the transcription factor Pointed, and our single-cell RNA-Seq analysis shows that the same photoreceptors require the eye-specific transcription factor Glass. We find that ectopic expression of Glass and activation of EGFR signaling synergistically induce neuronal gene expression in the wing disc in a Pointed-dependent manner. Targeted DamID reveals that Glass and Pointed share many binding sites in the genome of developing photoreceptors. Comparison with transcriptomic data shows that Pointed and Glass induce photoreceptor differentiation through intermediate transcription factors, including the redundant homologs Scratch and Scrape, as well as directly activating neuronal effector genes. Our data reveal synergistic activation of a multi-layered transcriptional network as the mechanism by which EGFR signaling induces neuronal identity in Glass-expressing cells.


Conflict of interest statement

C.A.M. is a shareholder of 10X Genomics. G.M. is the co-owner of Genetivision Corporation. The other authors declare no competing interests.

Figures

Fig. 1
Fig. 1. scRNA-Seq characterization of photoreceptor differentiation defects in gl mutants.
a UMAP dimensional plot of scRNA-Seq data from wild-type and gl60j white prepupal eye discs harmonized using the Seurat integration method. The same colors are used for equivalent clusters in the two conditions. Clusters corresponding to photoreceptor types and cone cells are labeled. Other labeled clusters are Ppn preproneural, MF morphogenetic furrow, SMW second mitotic wave, Diff. PR differentiated photoreceptors. b Percentage of total cell counts in these integrated clusters in wild-type (red) and gl mutant (green) conditions. c, d Monocle3 trajectory inferences of the photoreceptor clusters using the integrated UMAP and raw counts for wild-type (c) and gl (d). Pseudotime is shown on a batlow scale, beginning with gray at the roots and ending with pink for the most differentiated cells. e, g, i, k, m, o, q, s Feature plots of gene expression levels in wild-type and gl mutant eye discs, with gray indicating no expression and pink the highest expression. f, h, j, l, n, p, r, t Violin plots of gene expression levels in the indicated selected cell clusters, with wild-type in red and gl in green. e, f sens is still expressed in R8 in gl mutants; g, h the late R8 marker CG42458 is not expressed; i, j rough is still expressed in R2, R5, R3, and R4; k, l CG7991 is lost from R1–R6; m, n blanks is lost from R3 and R4; o, p Bar-H1 is lost from R1 and R6; q, r CAP is lost from R7; s, t the late marker CG34377 is strongly reduced in all photoreceptors.
Fig. 2
Fig. 2. Gl and RasV12 synergistically induce neuronal markers in the wing disc.
al Wing discs in which clones overexpressing the indicated proteins are marked with GFP (green), stained for the neuronal markers Elav, a nuclear protein (b, e, h, k, red in a, d, g, j) and Futsch, a cytoplasmic protein (c, f, i, l, blue in a, d, g, j). Anterior is to the left and dorsal is up. ac Gl overexpression does not induce either protein. df RasV12 induces clone overgrowth but not the neuronal markers. gi Overexpression of both Gl and RasV12 strongly induces Elav and Futsch. jl Overexpression of Gl and RasV12 in pntΔ88 mutant clones induces much less Elav and Futsch expression than Gl and RasV12 in wild-type clones. All discs were imaged in parallel with the same laser settings. Scale bars, 50 μm. m, n Quantification of Elav (m) or Futsch (n) intensity in these genotypes, normalized to the background. Co-expression of Gl and RasV12 showed significantly greater Elav and Futsch levels than all other genotypes. Error bars indicate mean ± SD. m p(Gl + Ras, Gl) = 0.0002, p(Gl + Ras, Ras) = 0.0009, p(Gl+Ras, Gl + Ras pnt) = 0.0003. n p(Gl + Ras, Gl) = 0.0009, p(Gl + Ras, Ras) = 0.0018, p(Gl+Ras, Gl + Ras pnt) = 0.0021, two-tailed t-test with Welch’s correction. n = 7 discs (UAS-Gl; UAS-RasV12); n = 9 discs (UAS-Gl&RasV12; UAS-Gl&RasV12, pnt). Source data are provided as a Source Data file.
Fig. 3
Fig. 3. Synergistic activation of a neuronal program by Gl and RasV12.
a Heat map showing the log2-transformed expression levels of the 265 genes that were significantly upregulated in wing discs with clones expressing UAS-Gl and UAS-RasV12 compared to UAS-Gl or UAS-RasV12 alone by differential gene expression analysis and were attenuated in pnt mutant clones. b Volcano plot showing expression levels of genes that were significantly different with Gl and RasV12 co-expression compared to Gl expression alone. Genes with |log2 fold change| > 1 are shown in red and <1 in blue. Selected neuronal genes are labeled. p values were computed with the Wald test in DESeq2. ch Transcript levels (RPKM, libraries normalized to GFP level) of the synergistically activated neuronal genes Syt4 (c), futsch (d), lz (e), trp (f), scrt (g), and CG12605 (h). Error bars indicate mean ± SD. n = 3 biological replicates of the RNA-Seq experiment. i Panther-based GO term analysis of the 265 genes. Many GO terms are associated with neuronal functions. j Pie chart showing the proportion of the 265 genes that have neuronal functions documented in FlyBase. Source data are in Supplementary Data 3.
Fig. 4
Fig. 4. Gl and Pnt bind shared target genes at two stages of photoreceptor differentiation.
a Log2 fold-change compared to Dam control of peaks that were significantly bound by Dam-Gl or Dam-Pnt in at least one condition. The heatmap shows a k-means clustering, with k = 8. b Dam-ID peaks for ato>Dam, ato>Dam-Gl, and ato>Dam-Pnt on the second intron of lz, overlapping with the known Gl and EGFR-responsive minimal enhancer,. n = 3 biological replicates of each condition. c UpSet plot of genes that were significantly bound in at least one condition. Columns with dots connected by lines indicate binding in multiple conditions. The y-axis shows discrete gene numbers in each single set or intersection. d UpSet plot of genes significantly bound by Gl and their intersection with genes showing significantly reduced expression in gl mutant eye discs. e UpSet plot of genes significantly bound by Pnt and their intersection with genes showing significantly reduced expression in Egfrts mutant eye discs. f UpSet plot of genes significantly bound by Gl or by Pnt in at least one condition and their intersection with genes synergistically activated by Gl and RasV12 in a pnt-dependent manner in the wing disc. Source data are in Supplementary Data 4. g Gl and Pnt motifs identified by STREME in peaks bound only by Gl, only by Pnt, or by both factors, showing the motif logo, the rank of that logo based on E-value compared to all logos found in the search, the E-value of the logo, and the number and percentage of peaks that contain the indicated logo. Both motifs appear at a lower rank and higher E-value in a smaller percentage of co-bound peaks compared to peaks bound only by that transcription factor. The Gl and Pnt binding motifs identified by Fly Factor Survey are shown for comparison.
Fig. 5
Fig. 5. Gl and Pnt co-binding correlates with photoreceptor-specific genome accessibility.
a, b Examples of a site bound by Pnt and Gl in ato-GAL4 cells in the CG14624 gene (a) and a site bound in elav-GAL4 cells in the Oamb gene (b), aligned with ATAC-Seq data for those genes in the eye disc. Peaks of interest are shown between the red dashed lines. Gl and Pnt binding in elav-GAL4 cells correlates with accessibility in early (PMF_PR_early) and late (PMF_PR_late) photoreceptors, and binding in ato-GAL4 cells also correlates with accessibility in the morphogenetic furrow (MF) and more weakly with anterior precursor cells (AMF_Prec). AMF_Prog, anterior progenitors. c A heat map showing k-means clustering (k = 5) of Dam-ID peak log2 fold changes for peaks that were bound by both Gl and Pnt in ato-GAL4 and/or elav-GAL4 cells in genes that were synergistically induced in the wing disc. d, e Percentages of the peaks in the heat map in (c) with shared binding in ato-GAL4 cells (d) or elav-GAL4 cells (e) that have the indicated ATAC-Seq accessibility profiles. Accessible peaks are defined as those with pseudobulk scATAC-Seq normalized counts ≥10. f Location distribution of 2429 peaks bound by Gl and Pnt in ato-GAL4 and/or elav-GAL4 cells relative to the nearest gene. g In 82% of genes that are bound by both Gl and Pnt, these factors bind to the same peaks. Source data are in Supplementary Data 4. h A Panther-based gene ontology search of the 1752 genes that contain these shared peaks showed enrichment of many terms related to neuronal or eye development.
Fig. 6
Fig. 6. Scrt and Scrape act redundantly in R7 photoreceptor axon targeting.
a, c Feature plots and b, d violin plots showing that scrt (a, b) and scrape (c, d) are expressed in photoreceptors in wild-type eye discs and show reduced expression in gl mutant discs. e Dam-ID peaks showing Dam-Gl and Dam-Pnt binding to the intergenic region between the 5’ ends of scrape and scrt (within the red dashed lines). f Schematic of sgRNAs used to delete all the predicted zinc fingers (yellow) of scrape. gi w1118; jl scrape1E; mp scrtjo11 clones; qt scrtj011, scrape2A clones. Clones are marked with myrTomato (red in m, q, magenta in n, r, blue in o, s). g, j, m, q Horizontal adult head sections were stained for Chp (green) to mark rhabdomeres and Elav (magenta in g, j, blue in m, q) to mark neuronal nuclei. h, k, n, r Horizontal sections of medullas stained for Chp (green in n, r) to mark R7 and R8 axons. Asterisks in (r) mark gaps in the R7 terminal layer corresponding to scrtj011, scrape2A clones. i, l, o, p, s, t 48 h APF retinas stained for Elav (green) and the R7 marker Pros (p, t, magenta in i, l, red in o, s). Most single and double mutant ommatidia contain an Elav and Pros-labeled R7 cell, and Pros is expressed equally strongly in wild-type and mutant R7s. Scale bars: 50 μm (g, j, m, q); 20 μm (h, k, n, r); 10 μm (i, l, o, p, s, t). u Quantification of the percentage of R7 axons that fail to reach the M6 layer in the medulla. n = 148 axon columns in 8 brains (148/8, w1118), 58/6 (scrtjo11 clones), 144/5 (scrape1E), 65/7 (scrtjo11, scrape2A clones). ****p < 0.0001, *p = 0.0114, ns p = 0.34, Fisher’s two-sided exact test. v Percentage of ommatidia that lack a Pros-labeled R7 cell. n = 292 ommatidia in 13 retinas (292/13, wt), 295/6 (scrtjo11 clones), 606/9 (scrape1E), 208/7 (scrtjo11, scrape2A clones). p(wt, scrt scrape) = 0.2136; p(wt, scrape) = 0.042; p(wt, scrt) > 0.99, Fisher’s exact test. Source data are provided as a Source Data file.
Fig. 7
Fig. 7. Gl and Pnt act upstream of a multi-layered transcriptional network.
The diagram shows a subset of the transcription factors and effector genes that are directly bound by Gl and Pnt in our Dam-ID experiment and have known functions in photoreceptor development. Arrowheads indicate activation and circles repression. The effector genes shown to be targeted by intermediate transcription factors are based on previous studies. Gl and Pnt directly activate some terminal effector genes that are relevant to eye/neuronal development and regulate others through an intermediate layer of transcription factors.

Similar articles

References

    1. Perrimon, N., Pitsouli, C. & Shilo, B. Z. Signaling mechanisms controlling cell fate and embryonic patterning. Cold Spring Harb. Perspect. Biol.4, a005975 (2012). 10.1101/cshperspect.a005975 - DOI - PMC - PubMed
    1. Mack, E. A. & Pear, W. S. Transcription factor and cytokine regulation of eosinophil lineage commitment. Curr. Opin. Hematol.27, 27–33 (2020). 10.1097/MOH.0000000000000552 - DOI - PMC - PubMed
    1. Lee, S., Lee, B., Lee, J. W. & Lee, S. K. Retinoid signaling and Neurogenin2 function are coupled for the specification of spinal motor neurons through a chromatin modifier CBP. Neuron62, 641–654 (2009). 10.1016/j.neuron.2009.04.025 - DOI - PMC - PubMed
    1. Jarman, A. P., Grell, E. H., Ackerman, L., Jan, L. Y. & Jan, Y. N. atonal is the proneural gene for Drosophila photoreceptors. Nature369, 398–400 (1994). 10.1038/369398a0 - DOI - PubMed
    1. Tio, M. & Moses, K. The Drosophila TGF alpha homolog Spitz acts in photoreceptor recruitment in the developing retina. Development124, 343–351 (1997). 10.1242/dev.124.2.343 - DOI - PubMed

MeSH terms