. 2024 Sep;43(38):2885-2899.
doi: 10.1038/s41388-024-03125-x. Epub 2024 Aug 18.

Jumonji histone demethylases are therapeutic targets in small cell lung cancer

Affiliations

Jumonji histone demethylases are therapeutic targets in small cell lung cancer

Aiden Nguyen et al. Oncogene. 2024 Sep.

Abstract

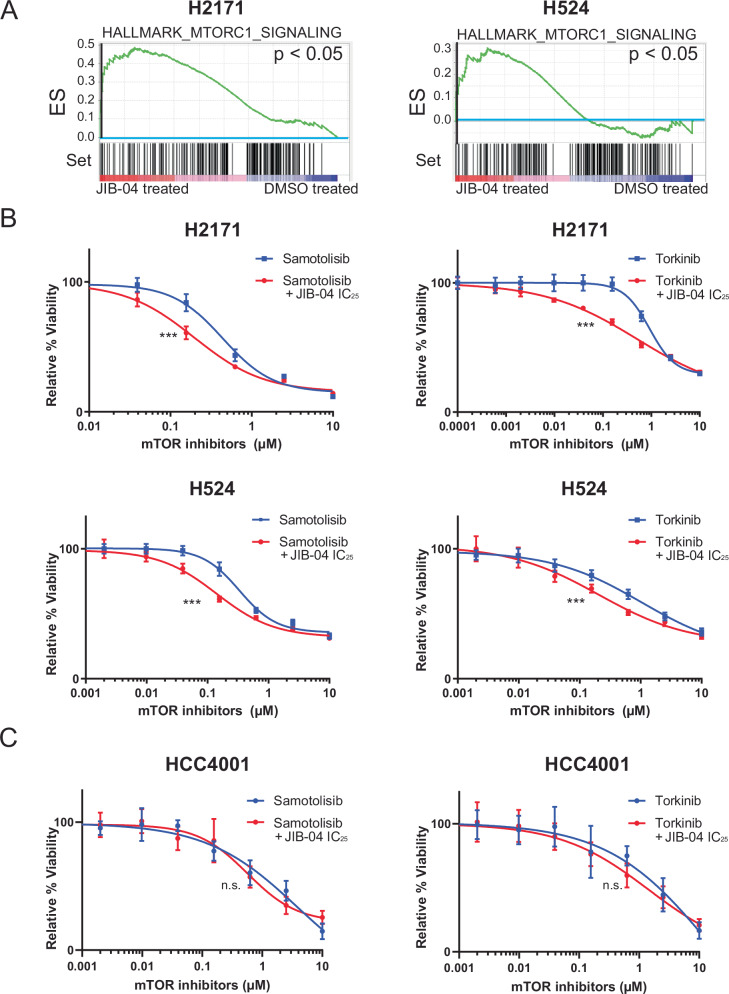
Small cell lung cancer (SCLC) is a recalcitrant cancer of neuroendocrine (NE) origin. Changes in therapeutic approaches against SCLC have been lacking over the decades. Here, we use preclinical models to identify a new therapeutic vulnerability in SCLC consisting of the targetable Jumonji lysine demethylase (KDM) family. We show that Jumonji demethylase inhibitors block malignant growth and that etoposide-resistant SCLC cell lines are particularly sensitive to Jumonji inhibition. Mechanistically, small molecule-mediated inhibition of Jumonji KDMs activates endoplasmic reticulum (ER) stress genes, upregulates ER stress signaling, and triggers apoptotic cell death. Furthermore, Jumonji inhibitors decrease protein levels of SCLC NE markers INSM1 and Secretogranin-3 and of driver transcription factors ASCL1 and NEUROD1. Genetic knockdown of KDM4A, a Jumonji demethylase highly expressed in SCLC and a known regulator of ER stress genes, induces ER stress response genes, decreases INSM1, Secretogranin-3, and NEUROD1 and inhibits proliferation of SCLC in vitro and in vivo. Lastly, we demonstrate that two different small molecule Jumonji KDM inhibitors (pan-inhibitor JIB-04 and KDM4 inhibitor SD70) block the growth of SCLC tumor xenografts in vivo. Our study highlights the translational potential of Jumonji KDM inhibitors against SCLC, a clinically feasible approach in light of recently opened clinical trials evaluating this drug class, and establishes KDM4A as a relevant target across SCLC subtypes.


Conflict of interest statement

JDM receives royalties from the NIH and UTSW for the distribution of human tumor cell lines. None of the other authors have any competing interests to declare.

Figures

Fig. 1
Fig. 1. Clusters of SCLC cell lines and patient tumors driven by lineage transcription factors.
Cell lines are shown in red and patient tumors are shown in green in the top bar. Neuroendocrine score, defined by the level of expression of 50 genes that drive the neuroendocrine phenotype [27], is represented on a yellow-to-brown scale. Relative transcription factor expression levels are shown in blue scale and are defined as follows: ASCL1 – A, NEUROD1 – N, YAP1 –Y, and POU2F3 – P. Note that cell lines populate all the clusters defined in patient samples.
Fig. 2
Fig. 2. Jumonji inhibitors block SCLC viability, act on target, and robustly inhibit etoposide-resistant cell lines.
A Range of IC50 responses to JIB-04, SD70, and GSK-J4 of SCLC cell lines representing all clusters. Each diamond represents the median IC50 across multiple experiments of a particular cell line, measured by 4-day MTS assay (see also Table 1). The IC50 values are shown on a log scale. B Inhibitors act on target as demonstrated by robust decreases in Jumonji enzymatic activity when cells are treated with their corresponding IC50 values for 24 h. Bar graphs display the level of H3K9me3 demethylase activity in H446 and H2171 cell lysates and/or nuclear extracts after the indicated treatment. ** = p ≤ 0.01 and * = p ≤ 0.05 by two-tailed t-test, unequal variance. Data are average ± SEM. C Correlation analysis yields negative correlations between the IC50 of etoposide and the IC50 of each of the three Jumonji inhibitors tested across 31 SCLC cell lines: JIB-04 (pan-JmjC KDM inhibitor with some selectivity for KDM5s), SD70 (relatively selective KDM4 inhibitor) and GSK-J4 (relatively selective KDM6 inhibitor). Pearson R-values are shown. D Heat map of etoposide and Jumonji inhibitor IC50 values represented in a blue to red scale for individual drugs in the indicated concentration ranges. Chemoresistant cell lines in the green box are sensitive to Jumonji inhibitors, particularly to JIB-04. E Dose-response curves demonstrate three etoposide most resistant cell lines (H378, H889, and H510) are highly sensitive to JIB-04. H524 and HCC4003 are sensitive to etoposide and are given for reference. Representative curves of n = 4–8 replicates with SEM are shown. See Table 1 for further details.
Fig. 3
Fig. 3. A subset of SCLC lines upregulates mTOR signaling genes and is sensitized to mTOR inhibitors in response to JIB-04 treatment.
A SCLC cell lines (H2171 and H524) upregulated mTOR signaling pathway genes upon treatment with JIB-04 at 0.05 µM as determined by GSEA analysis. Nominal p-values are shown as calculated on the GSEA site following Subramanian et al. [61]. See Supplementary Information RNA-seq dataset for more details. B Dose-response curves to each of two different mTOR inhibitors alone and concurrently with low dose of JIB-04 (IC25) measured by MTS viability assays over a 4-day treatment. The two cell lines that upregulated mTOR signaling genes in response to JIB-04 have 2–3-fold or greater enhanced sensitivity to mTOR inhibitors (mean ± SEM is shown for each dose, n = 3–4). C HCC4001 which did not significantly upregulate mTOR signaling genes in response to JIB-04, did not show enhanced sensitivity to mTOR inhibitors (mean ± SD is shown for each dose, n = 8). B, C JIB-04 IC25 = 0.25 µM for H2171 and H524, 0.01 µM for HCC4001. P-values for curve comparisons calculated by GraphPad Prism (top, bottom, IC50, Hill coefficient) are as follows: H2171 Samotolisib ± JIB-04 0.0069; H2171 Torkinib ± JIB-04 < 0.0001, H524 Samotolisib ± JIB-04 0.0005, H524 Torkinib ± JIB-04 0.0011, HCC4001 Samotolisib ± JIB-04 0.1425, HCC4001 Torkinib ± JIB-04 0.1932.
Fig. 4
Fig. 4. Jumonji inhibitors activate ER stress pathway proteins and trigger cell death in SCLC cells.
A Western blot analysis demonstrates multiple proteins in the ER stress pathway are elevated by treatment with IC50 doses of JIB-04 or SD70 for 24 h across multiple SCLC lines representing various inhibitor sensitivities and both NEUROD1-high (H446, H2171, H524) and ASCL1-high transcription (H510, H1522, H1417, H2107) factor clusters. Tubulin or GAPDH were used as a loading control. B Activation of phospho-elF2α is also seen by Western analysis in SCLC cell lines treated with inhibitors for 24 h at their respective IC50. GAPDH was used as loading control. C Annexin V staining was analyzed by FACS after 48 h (H446, H2171, H510) or 72 h (H524) of inhibitor treatment, and double-positive early or late apoptotic cells quantified. Data are averages across replicates with error bars representing SEM. **** = p ≤ 0.0001, *** = p ≤ 0.001, ** = p ≤ 0.01, * = p < 0.05, by unpaired two-tailed t-test. D Inhibitor treatment with IC50 for 48 h triggers PARP cleavage in H510 as shown by Western blot, indicating late stage of apoptosis. GAPDH served as a loading control. C shows quantification of early apoptotic H510 cells at this time point.
Fig. 5
Fig. 5. Depletion of the ER stress transcriptional regulator Jumonji KDM4A upregulates ER stress and mTOR signaling, decreases cell proliferation in vitro, and blunts tumor growth in vivo.
A Immunoblot demonstrating decrease of KDM4A (top) in H446 cells compared to parental and Cas9-only control cells. GAPDH (bottom) was used as the loading control. B Loss of KDM4A in H446 decreases proliferation compared to parental and Cas9-only H446 cells. See the methods section for experimental details. Error bars represent SD from the mean across 4–5 biological replicates. ** = p ≤ 0.01, * = p ≤ 0.05, by two-tailed t-test, unequal variance. C Depletion of KDM4A in H446 decreases colony formation potential compared to parental and Cas9-only H446 cells. Each colony is defined by a cluster of approximately 100 cells. Error bars are SEM across six replicates. **** = p ≤ 0.0001 by two-tailed t-test, unequal variance. D Upregulation of ER stress pathway genes measured by RNA-sequencing in KDM4A knockdown compared to parental and Cas9-only H446 cells. Data are shown as mean ± SD, n = 3. *** = p ≤ 0.001, ** = p ≤ 0.01, * = p ≤ 0.05, by two-tailed t-test, unpaired with Welch’s correction. E ER stress proteins p-elF2α, DDIT3, and CHAC1 are upregulated in H446 KDM4A knockdown cells vs controls, as shown by Western blot. Tubulin is a loading control. F MTS viability curves of H446 Cas9 vs KDM4A knockdown cells in response to mTOR inhibitors. Data are average ± SD for each dose, n = 4. P-values for curve comparisons calculated by GraphPad Prism (top, bottom, IC50, Hill coefficient). G Growth of cell line-derived xenografts in nude mice demonstrates suppressed tumor progression in H446 tumors with KDM4A knockdown compared to controls. Data are shown as mean ± SEM. H446 parental (n = 5), H446 Cas9 (n = 6), H446 Cas9 KDM4A (n = 7) and * = p ≤ 0.05, by one-tailed t-test, unequal variance. H Bar graph representing final tumor volumes in H446 xenografts. H446 KDM4A knockdown xenograft volumes were significantly lower compared to parental and Cas9-only controls. Data are shown as means ± SEM. ** = p ≤ 0.01, * = p < 0.05, by one-tailed t-test, unpaired with Welch’s correction.
Fig. 6
Fig. 6. KDM4 inhibitors decrease the growth rate of H446 and H510 cell line-derived xenograft tumors in vivo and regulate common genes.
A Growth of H446 xenograft tumors grown in nude mice is significantly suppressed after treatment with JIB-04. Tumor weight was likewise significantly decreased in JIB-04-treated mice. JIB-04 was given via oral gavage three times a week (Mon, Wed, Fri) at 75 mg/kg. Data are shown as mean ± SEM (n = 4 per treatment group). B Growth of H446 xenograft tumors grown in nude mice was suppressed after treatment with SD70. Tumor weight decreased in SD70-treated animals, showing a nearly significant trend. SD70 was given by IP injection Mon-Fri at 10 mg/kg. Data are shown as mean ± SEM (n = 4 per treatment group). C Growth of H510 xenograft tumors grown in nude mice is significantly suppressed after treatment with SD70. Tumor weight was significantly decreased in SD70-treated animals. Data are shown as mean ± SEM (n = 3 per treatment group). ** = p ≤ 0.01, * = p ≤ 0.05, by two-tailed t-test, unequal variance. D Venn diagrams depicting the overlap in upregulated genes (≥1.5 over vehicle) between JIB-04 and SD70 in H446 xenografts (left panel, n = 3 per treatment group) and between SD70-treated H446 vs H510 xenografts (n = 3 per xenograft).
Fig. 7
Fig. 7. Jumonji inhibition or KDM4A genetic knockdown alter the protein levels of key modulators of small cell lung cancer phenotypes in cells and in vivo.
A The SCLC marker Secretogranin-3 is decreased in KDM4A knockdown cell secreted media compared to Cas9 control H446 cells. A representative immunoblot is shown along with a section of total protein stain for the same gel. Quantification across two independent experiments normalized to total protein lysate is shown in the bar graph. B Western analysis validates the downregulation of INSM1 protein expression in H446 KDM4A KD cells, as well as in HCC4001, H510, and H2107 cells treated with Jumonji inhibitors, as indicated. GAPDH was used as a loading control. C NEUROD1 or ASCL1 Western blots show decreased protein in KDM4A KD or SD70 and JIB-04 treated cells. NEUROD1-high (H446, HCC4001) and ASCL1-high cells (H510, H2107) cells are shown. GAPDH as loading control. Note that in some cases the same gels were used to probe for INSM1 and NEUROD1 or ASCL1 thus sharing the same loading control. Quantifications are given in Fig. S7. D Western blots showing upregulation of H3K9me3 levels in H510 tumor nuclear extracts (n = 2 per treatment group) with RNA polymerase II used as a loading control. Quantification is shown on the right with lines connecting the DMSO control and SD70-treated mouse pairs. E Western blots showing decreased INSM1 and ASCL1 protein levels in H510 tumor lysates (n = 2 per treatment group) with GAPDH as a loading control. Quantifications are shown on the right with lines connecting DMSO control and SD70-treated mouse pairs. D, E dotted lines represent the place in the membrane where an extra control lane between DMSO and drug-treated samples was removed for simplicity of presentation.

References

    1. Gazdar AF, Bunn PA, Minna JD. Small-cell lung cancer: what we know, what we need to know and the path forward. Nat Rev Cancer. 2017;17:765. 10.1038/nrc.2017.106 - DOI - PubMed
    1. Wang S, Tang J, Sun T, Zheng X, Li J, Sun H, et al. Survival changes in patients with small cell lung cancer and disparities between different sexes, socioeconomic statuses and ages. Sci Rep. 2017;7:1339. 10.1038/s41598-017-01571-0 - DOI - PMC - PubMed
    1. Cai L, Liu H, Huang F, Fujimoto J, Girard L, Chen J, et al. Cell-autonomous immune gene expression is repressed in pulmonary neuroendocrine cells and small cell lung cancer. Commun Biol. 2021;4:314. 10.1038/s42003-021-01842-7 - DOI - PMC - PubMed
    1. Petty WJ, Paz-Ares L. Emerging strategies for the treatment of small cell lung cancer: a review. JAMA Oncol. 2023;9:419–29. 10.1001/jamaoncol.2022.5631 - DOI - PubMed
    1. Brahmer JR, Lee JS, Ciuleanu TE, Bernabe Caro R, Nishio M, Urban L, et al. Five-year survival outcomes with nivolumab plus ipilimumab versus chemotherapy as first-line treatment for metastatic non-small-cell lung cancer in CheckMate 227. J Clin Oncol. 2023;41:1200–12. 10.1200/JCO.22.01503 - DOI - PMC - PubMed

MeSH terms