. 2024 Dec 31;16(1):2392343.
doi: 10.1080/19382014.2024.2392343. Epub 2024 Aug 18.

Small RNA-Seq and real time rt-qPCR reveal islet miRNA released under stress conditions

Affiliations

Small RNA-Seq and real time rt-qPCR reveal islet miRNA released under stress conditions

Bssam Aljani et al. Islets. .

Abstract

Replacement of beta cells through transplantation is a potential therapeutic approach for individuals with pancreas removal or poorly controllable type 1 diabetes. However, stress and death of beta cells pose significant challenges. Circulating miRNA has emerged as potential biomarkers reflecting early beta cell stress and death, allowing for timely intervention. The aim of this study was to identify miRNAs as potential biomarkers for beta cell health. Literature review combined with small RNA sequencing was employed to select islet-enriched miRNA. The release of those miRNA was assessed by RT-qPCR in vivo, using a streptozotocin induced diabetes mouse model and in vitro, through mouse and human islets exposed to varying degrees of hypoxic and cytokine stressors. Utilizing the streptozotocin induced model, we identified 18 miRNAs out of 39 candidate islet-enriched miRNA to be released upon islet stress in vivo. In vitro analysis of culture supernatants from cytokine and/or hypoxia stressed islets identified the release of 45 miRNAs from mouse and 8 miRNAs from human islets. Investigation into the biological pathways targeted by the cytokine- and/or hypoxia-induced miRNA suggested the involvement of MAPK and PI3K-Akt signaling pathways in both mouse and human islets. We have identified miRNAs associated with beta cell health and stress. The findings allowed us to propose a panel of 47 islet-related human miRNA that is potentially valuable for application in clinical contexts of beta cell transplantation and presymptomatic early-stage type 1 diabetes.

Keywords: Biomarker; T1D; islet beta cell stress; miRNA; transplantation.


Conflict of interest statement

No potential conflict of interest was reported by the author(s).

Figures

None
Graphical abstract
Figure 1.
Figure 1.
Identification of mouse and human islet enriched miRNAs. A volcano plot showing differential expression of 70 mouse miRNAs collected from the literature and tested for expression in islets compared to serum (N = 3 for each tissue). Each sample was tested in triplicate. The 29 significant miRNAs are shown as black dots. The -log10 p-value is plotted against log2 fold change. The vertical line indicates a fold change of 2 and the horizontal line a p-value of 0.05. B bar plot showing the 29 mouse miRNA significantly enriched in islets compared to serum. Bars show log2fold change and asterisks show significance. C volcano plot showing 571 miRNAs identified by small RNA- seq on serum and islets from BL6 mice. 194 miRNAs were significantly up- and 151 down- regulated in islets as compared to serum (black dots). The log2 fold change is plotted against the -log10 p-value. D eatmap with the top 50 miRNA upregulated in islets in comparison to serum, as found by small RNA-seq. Log2 of the normalized reads is presented. Each column indicates an islet (right) or serum (left) sample, each row a miRNA species. Clustering by Euclidean distance and row scaling were applied. E venn diagram shows overlap of mouse miRNAs identified by small RNA-seq and by qPCR. F volcano plot showing differential expression of 30 human miRNA collected from the literature and tested for expression in human islets compared to serum (N = 5 for islets and N = 6 for serum). The 13 significant miRNAs are shown as black dots. The -log10 p-value is plotted against log2fold change. The vertical line indicates a fold change of 2 and the horizontal line a p-value of 0.05. G bar plot showing the 13 human miRNAs significantly enriched in islets compared to serum. Bars shows log2fold change and asterisks show significance. t – test was performed on Δq values (CqTarget - CqReference). *p < 0.05, **p < 0.01, ***p < 0.001 and ****p < 0.0001.
Figure 2.
Figure 2.
miRNA measured after STZ- treatment. Heatmap shows 39 miRNAs measured by RT-qPCR after treating mice with STZ. Shown are log fold change values of miRNA in treated mice compared to untreated mice. Values from mice developing STZ- induced diabetes are shown in the left- and from mice not developing diabetes in the right column. Clustering by Euclidean distance was applied. Colors encode log fold change (negative values in blue and positive values in red). Asterisks show significance. t-test was performed on fold change values. *p < 0.05, **p < 0.01, ***p < 0.001 and ****p < 0.0001.
Figure 3.
Figure 3.
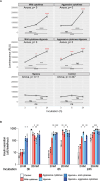
Stress induces apoptosis and modulates glucose-stimulated insulin secretion (GSIS) in islets in vitro. A caspase-3 activity after in vitro islet stress was measured after 3, 6 and 24 h (shown on the x- axis) in mouse islets incubated in mild and/or aggressive cytokine mix, with- or without hypoxia (3 islets per well, at least 12 wells per condition). One plot is shown for each condition, with the treatment described at the top of the plot. Luminescence measured and expressed as relative light units (RLU) is shown on the y- axis. One-way ANOVA followed by Tukey’s HSD multiple comparison test was performed. Significance for the multiple comparisons between time points for each treatment condition are shown at the bottom of the graphs, ANOVA p values are indicated at the top, and asterisks in red, above the graphs, represent the significance of the time point of the condition compared to the corresponding time point of the control (untreated islets). *p < 0.05, **p < 0.01, ***p < 0.001 and ****p < 0.0001. B islets incubated in mild and/or aggressive cytokine mix, with or without hypoxia, for 3, 6 and 24 h (shown on the x- axis) in the presence of basal- or high glucose (2 mM or 20 mM) (shown on the lower x- axis) were subjected to GSIS. Insulin secretion is shown on the y-axis (insulin concentration (uIU) per islet per hour). Student’s t-test was performed to analyze differences in secretion induced between incubation with cytokines or hypoxia and controls incubated with the same glucose concentration and for the same time. p-values: *p < 0.05, **p < 0.01, ***p < 0.001.
Figure 4.
Figure 4.
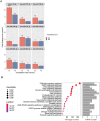
A. Patterns of miRNA released upon in vitro islet stress. 45 miRNAs (out of 64) were significantly increased in supernatants of treated as compared to supernatants of untreated islets after 3, 6 and 24 h. Shown are log2 fold changes, illustrated by the dot sizes (legend on the right) and the tukey p-value (blue: p > 0.05, red: p < 0.05). Each column corresponds to one treatment condition (described at the bottom of the plot: M= mild and A= aggressive cytokine mix; ± hypoxia) and each row to one miRNA. One-way ANOVA testing (p < 0.05) across all time points (3, 6 and 24 h) was applied followed by the Tukey’s HSD multiple comparison. B, C the top most significant pathways targeted by stress-released miRNAs. The 20 most significant pathways targeted by miRNAs released upon cytokine stress only (B) or upon combined cytokine- and hypoxic stress (C). Target genes (mRNA) of the 10 (B) or 42 (C) miRNAs differentially released were pooled and unique targets (targeted by one miRNA only) were used in kegg-pathway analysis. The number of miRNAs and of their target genes (mRNAs) found for each pathway are below the bar- and the dot- plot, respectively. The dot size reflects the ratio between the number of genes in the pathway and the input target genes (mRNAs) and the dot color the p-value.
Figure 5.
Figure 5.
Stress-induced miRNA release into the supernatant of human islets in vitro. A quantification of 9 miRNAs in the supernatant of human islets cultured under inflammatory- (aggressive cytokine mix) and hypoxic stress after 24 (red) and 48 h (blue). Shown is the fold change for each miRNA (± SEM) between the supernatant after culture under stress conditions and the supernatant of untreated islets (control). Two-way ANOVA followed by Tukey’s HSD multiple comparison test was performed for statistical analysis. *p < 0.05, **p < 0.01, and ***p < 0.001. Each sample contained 120 islets; control: N = 3, treated islets: N = 3. qPCR was performed in triplicates. The red broken line indicates fold change of 1. B shows the 20 most significant pathways targeted by miRNAs released by human islets upon combined in vitro inflammatory- and hypoxic stress. Target genes (mRNA) of the 8 miRNAs significantly differentially released were pooled and unique targets (targeted by one miRNA only) were used for kegg-pathway analysis. The number of miRNAs and of their target genes (mRNAs) found for each pathway are shown below the bar- and the dot-plot, respectively. The dot size reflects the ratio between the number of genes in the pathway and the input target genes (mRNAs) and the dot color the p-value.

References

    1. Morran MP, Vonberg A, Khadra A, Pietropaolo M.. Immunogenetics of type 1 diabetes mellitus. Mol Aspects Med. 2015;42:42–16. doi:10.1016/j.mam.2014.12.004. - DOI - PMC - PubMed
    1. Silva IBB, Kimura CH, Colantoni VP, Sogayar MC. Stem cells differentiation into insulin-producing cells (IPCs): recent advances and current challenges. STEM Cell Res Ther. 2022;13(1). doi:10.1186/s13287-022-02977-y. - DOI - PMC - PubMed
    1. Shapiro AMJ, Pokrywczynska M, Ricordi C. Clinical pancreatic islet transplantation. Nat Rev Endocrinol. 2017;13(5):268–277. doi:10.1038/nrendo.2016.178. - DOI - PubMed
    1. Komatsu H, Kandeel F, Mullen Y. Impact of oxygen on pancreatic islet survival. Pancreas. 2018;47(5):533–543. doi:10.1097/MPA.0000000000001050. - DOI - PMC - PubMed
    1. Bennet W, Groth CG, Larsson R, Nilsson B, Korsgren O. Isolated human islets trigger an instant blood mediated inflammatory reaction: implications for intraportal islet transplantation as a treatment for patients with type 1 diabetes. Ups J Med Sci. 2000;105(2):125–133. doi:10.1517/03009734000000059. - DOI - PubMed

Publication types

LinkOut - more resources