. 2024 Aug 27;43(8):114641.
doi: 10.1016/j.celrep.2024.114641. Epub 2024 Aug 17.

Non-canonical autophosphorylation of RIPK1 drives timely pyroptosis to control Yersinia infection

Affiliations

Non-canonical autophosphorylation of RIPK1 drives timely pyroptosis to control Yersinia infection

David Jetton et al. Cell Rep. .

Abstract

Caspase-8-dependent pyroptosis has been shown to mediate host protection from Yersinia infection. For this mode of cell death, the kinase activity of receptor-interacting protein kinase 1 (RIPK1) is required, but the autophosphorylation sites required to drive caspase-8 activation have not been determined. Here, we show that non-canonical autophosphorylation of RIPK1 at threonine 169 (T169) is necessary for caspase-8-mediated pyroptosis. Mice with alanine in the T169 position are highly susceptible to Yersinia dissemination. Mechanistically, the delayed formation of a complex containing RIPK1, ZBP1, Fas-associated protein with death domain (FADD), and caspase-8 abrogates caspase-8 maturation in T169A mice and leads to the eventual activation of RIPK3-dependent necroptosis in vivo; however, this is insufficient to protect the host, suggesting that timely pyroptosis during early response is specifically required to control infection. These results position RIPK1 T169 phosphorylation as a driver of pyroptotic cell death critical for host defense.

Keywords: CP: Immunology; CP: Microbiology; RIPK1; Yersinia pseudotuberculosis; YopJ; autophosphorylation; caspase-8; macrophages; necroptosis; pyroptosis.


Conflict of interest statement

Declaration of interests The authors declare no competing interests.

Figures

Figure 1.
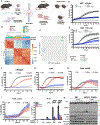
Figure 1.. Phosphorylation of RIPK1 T169, and not canonical S166, drives cell death after stimulation with LPS/5z7
(A) Cell death as measured by propidium iodide (PI) incorporation over time in B6, RIPK1 S166A, and RIPK1 D138N knockin immortalized BMDMs stimulated with LPS/5z7. (B) IL-1β release from B6, RIPK1 S166A, and RIPK1 D138N knockin immortalized BMDMs after 16 h of indicated treatments. LPS priming (10 ng/mL) occurred 4 h before the addition of 5z7 or 5z7/Nec-1. (C) Western blot for GapDH, cleaved CASP8, CASP3, GSDMD, total RIPK1, phospho-S166 RIPK1, total RIPK3, phospho-RIPK3, total MLKL, and phospho-MLKL in LPS/5z7-stimulated B6, RIPK1 S166A, and RIPK1 D138N immortalized BMDMs stimulated with LPS/5z7 over the indicated amounts of time. (D) Schema depicting workflow of phospho-specific mass spectroscopy. Phosphosites detected by liquid chromatography-tandem mass spectrometry (LC-MS/MS) in BMDMs treated with LPS or LPS/5z7 for 30 min. Previously reported autophosphorylations are highlighted in yellow and identified in the representation on the bottom. Schemas were created in BioRender. (E) Cell death as measured by PI incorporation over time in B6, RIPK1 T169A, and RIPK1 D138N knockin immortalized BMDMs stimulated with LPS/5z7. (F) IL-1β release from B6, RIPK1 S166A, and RIPK1 D138N knockin immortalized BMDMs after 16 h of indicated treatments. LPS priming (10 or 100 ng/mL) occurred 4 h before the addition of 5z7 or nigericin, respectively.

Data from cell death assays and western blots are representative of 3 or more independent experiments, cell death data are presented as the mean ± SD of triplicate wells, and n = 10,000 cells examined in three individual wells. IL-1β release data are presented as the mean ± SD for triplicate wells from n = 3 independent experiments. Data from (A) and (E) as well as (B) and (F) were generated concurrently using the same B6 and D138N controls but are presented separately for narrative purposes. Two-way analysis of variance (ANOVA) was used for comparison between groups: ns, non-significant (p > 0.05), *p < 0.05, **p < 0.01, ***p < 0.001, and ****p < 0.0001. See also Figure S1.
Figure 2.
Figure 2.. Inhibition of RIPK1 T169 phosphorylation inhibits CASP8-dependent death and downstream pyroptosis without altering inflammatory signaling
(A) Schema depicting the establishment of the Ripk1T169A/T169A mouse line created in BioRender. (B) Sample-sample correlation heatmap of B6 and RIPK1 T169A BMDMs treated with LPS, LPS/5z7, or unstimulated. N = 3 for each genotype and stimulation. (C) Principal-component analysis (PCA) plot of bulk RNA sequencing analysis of B6 and RIPK1 T169A BMDMs treated with LPS or LPS/5z7 or unstimulated. N = 3 for each genotype and stimulation. (D–I) Cell death as measured by PI incorporation over time in (D and E) B6 and RIPK1 T169A MEFs or (F–I) B6, RIPK1 T169A, and RIPK1 D138N primary BMDMs stimulated with (D and F) LPS/5z7, (E) TNF-α/5z7, (G and H) Y. ptb. at an MOI of 12, or (I) ΔYopJ-deficient Y. ptb. at an MOI of 12, respectively. (J) IL-1β release from B6, RIPK1 T169A, and RIPK1 D138N primary BMDMs after 16 h of indicated treatments. LPS priming (10 ng/mL) occurred 4 h before the addition of 5z7. (K) Western blot for GapDH, RIPK1, RIPK1 phospho-S321, total IκBα, NF-κB phospho-p65, and NF-κB total p65 in B6 and RIPK1 T169A BMDMs stimulated with Y. ptb. at MOI of 12 over indicated time. Data from cell death assays and western blots are representative of 3 or more biologically independent experiments, cell death data are presented as the mean ± SD of triplicate wells, and n = 10,000 cells examined in three individual wells. IL-1β release data are presented as the mean ± SD for triplicate wells from n = 3 independent biologic experiments. Two-way ANOVA was used for comparison between groups: ns, non-significant (p > 0.05), *p < 0.05, **p < 0.01, ***p < 0.001, and ****p < 0.0001. See also Figure S2.
Figure 3.
Figure 3.. RIPK1 T169A BMDMs form a delayed death complex but do not induce caspase cleavage
(A) Western blot for GapDH, RIPK1, cleaved CASP8, CASP3, and CASP7 in B6 and RIPK1 T169A BMDMs stimulated with LPS or LPS/5z7 over the indicated amounts of time. (B) FADD immunoprecipitation (IP) of B6, RIPK1 T169A, and RIPK1 D138N primary BMDMs stimulated with LPS/5z7 for 0, 2, or 4 h and probed for FADD and RIPK1. Inputs were probed for GapDH, FADD, RIPK1, and cleaved CASP8. (C) FADD IP of B6, RIPK1 T169A, and RIPK1 D138N primary BMDMs stimulated with Y.ptb. for 0, 1, and 3 h and probed for FADD, ZBP1, and RIPK1. Inputs were probed for GapDH, FADD, RIPK1, ZBP1, cleaved CASP8, cellular FLICE-like inhibitory protein (cFLIP), and GSDMD.
Figure 4.
Figure 4.. RIPK1 T169A mice are more susceptible to Y.ptb. in vivo, corresponding to a decrease in splenic IL-1β during early infection
(A) Kaplan-Meir survival curve of 8- to 10-week-old B6, T169A, and D138N mice treated with 5 × 10² CFUs of Y.ptb. via intravenous (i.v.) injection. (B) Percentage of mice that reached the 85% of original body weight sacrifice criterion or experienced spontaneous death across all mice in (A). (C) Kaplan-Meir survival curve of 8- to 12-week-old B6, T169A, and D138N mice treated with 5 × 10² CFUs of Y.ptb. deficient for YopJ via i.v. injection. N = 3. (D) Spleen and liver CFUs for mice sacrificed on the indicated day post-infection. For each time point and genotype, N = 4. (E) TNF-α and IL-1β protein levels measured by ELISA in the spleen of B6, T169A, and D138N mice injected i.v. with Y.ptb. for the indicated amounts of time. For PBS mice, N = 2–4 mice per genotype. For 2-day infected mice, N = 8–9 mice per genotype. Log-rank (Mantel-Cox) test was used for comparison of survival curves. Two-way ANOVA was used for comparison between groups: ns, non-significant (p > 0.05), *p < 0.05, **p < 0.01, ***p < 0.001, and ****p < 0.0001. See also Figure S3.
Figure 5.
Figure 5.. RIPK1 T169A mice experience delayed onset of cell death in the spleen after early Y.ptb. foci formation that rapidly increases to levels similar to those seen in B6 mice
(A) TUNEL staining and (B and C) quantification of percentage of total cells that are TUNEL+ in the spleens of B6, RIPK1 T169A, and RIPK1 D138N mice injected i.v. with GFP+ Y.ptb. for the indicated times. DAPI, 4′,6-diamidino-2 phenylindole. Each point represents one field of view, with a total of 5 fields of view across four biological replicates. Two-way ANOVA was used for comparison between groups: ns, non-significant (p > 0.05), *p < 0.05, **p < 0.01, ***p < 0.001, and ****p < 0.0001.
Figure 6.
Figure 6.. RIPK1 T169A mice activate p-MLKL, and not CASP8, in the spleen during in vivo Y.ptb. infection
(A and B) Immunofluorescence staining for cleaved CASP8 and (A) CD68 or (B) Ly6G in the spleens of B6, RIPK1 T169A, and RIPK1 D138N mice injected i.v. with Y.ptb. for 0 or 3 days. DAPI, 4′,6-diamidino-2 phenylindole. All scale bars shown represent 400 μm. (C) Quantification of (A) and (B) for percentage of total cells that are cleaved CASP8+ in the spleens of B6, RIPK1 T169A, and RIPK1 D138N mice and quantification of cleaved CASP8+ colocalization with either CD68 or Ly6G. Each point represents one tissue field of view across four biological replicates. Two-way ANOVA was used for comparison between groups: ns, non-significant (p > 0.05), *p < 0.05, **p < 0.01, ***p < 0.001, and ****p < 0.0001. (D) Western blot of spleen lysates from B6, RIPK1 T169A, and RIPK1 D138N mice i.v. injected with either PBS or Y.ptb. for 3 days as indicated probed for GapDH, cleaved CASP8, GSDMD, phospho-RIPK3 and total RIPK3, and phospho-MLKL and total MLKL. Data from western blots are representative of 4 or more biological replicates for each indicated treatment.

References

    1. Peterson LW, Philip NH, DeLaney A, Wynosky-Dolfi MA, Asklof K, Gray F, Choa R, Bjanes E, Buza EL, Hu B, et al. (2017). RIPK1-dependent apoptosis bypasses pathogen blockade of innate signaling to promote immune defense. J. Exp. Med. 214, 3171–3182. - PMC - PubMed
    1. Philip NH, Dillon CP, Snyder AG, Fitzgerald P, Wynosky-Dolfi MA, Zwack EE, Hu B, Fitzgerald L, Mauldin EA, Copenhaver AM, et al. (2014). Caspase-8 mediates caspase-1 processing and innate immune defense in response to bacterial blockade of NF-κB and MAPK signaling. Proc. Natl. Acad. Sci. 111, 7385–7390. - PMC - PubMed
    1. Demarco B, Grayczyk JP, Bjanes E, Le Roy D, Tonnus W, Assenmacher CA, Radaelli E, Fettrelet T, Mack V, Linkermann A, et al. (2020). Caspase-8-dependent gasdermin D cleavage promotes antimicrobial defense but confers susceptibility to TNF-induced lethality. Sci. Adv. 6, eabc3465. - PMC - PubMed
    1. Sarhan J, Liu BC, Muendlein HI, Li P, Nilson R, Tang AY, Rongvaux A, Bunnell SC, Shao F, Green DR, and Poltorak A (2018). Caspase-8 induces cleavage of gasdermin D to elicit pyroptosis during Yersinia infection. Proc. Natl. Acad. Sci. 115, E10888–E10897. - PMC - PubMed
    1. Orning P, Weng D, Starheim K, Ratner D, Best Z, Lee B, Brooks A, Xia S, Wu H, Kelliher MA, and Berger SB (2018). Pathogen blockade of TAK1 triggers caspase-8–dependent cleavage of gasdermin D and cell death. Science 2818, 1064–1069. - PMC - PubMed

Publication types

Substances

LinkOut - more resources