. 2024 Sep:107:105279.
doi: 10.1016/j.ebiom.2024.105279. Epub 2024 Aug 17.

NMR metabolomics-guided DNA methylation mortality predictors

Collaborators, Affiliations

NMR metabolomics-guided DNA methylation mortality predictors

Daniele Bizzarri et al. EBioMedicine. 2024 Sep.

Abstract

Background: 1H-NMR metabolomics and DNA methylation in blood are widely known biomarkers predicting age-related physiological decline and mortality yet exert mutually independent mortality and frailty signals.

Methods: Leveraging multi-omics data in four Dutch population studies (N = 5238, ∼40% of which male) we investigated whether the mortality signal captured by 1H-NMR metabolomics could guide the construction of DNA methylation-based mortality predictors.

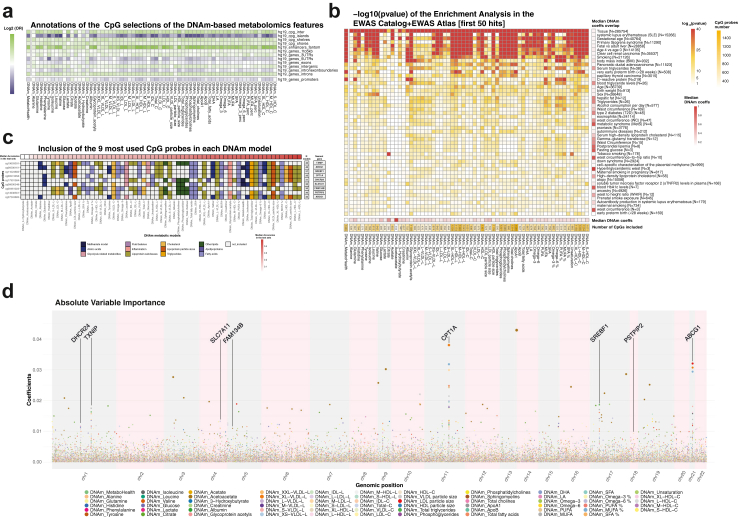
Findings: We trained DNA methylation-based surrogates for 64 metabolomic analytes and found that analytes marking inflammation, fluid balance, or HDL/VLDL metabolism could be accurately reconstructed using DNA-methylation assays. Interestingly, a previously reported multi-analyte score indicating mortality risk (MetaboHealth) could also be accurately reconstructed. Sixteen of our derived surrogates, including the MetaboHealth surrogate, showed significant associations with mortality, independent of relevant covariates.

Interpretation: The addition of our metabolic analyte-derived surrogates to the well-established epigenetic clock GrimAge demonstrates that our surrogates potentially represent valuable mortality signal.

Funding: BBMRI-NL, X-omics, VOILA, Medical Delta, NWO, ERC.

Keywords: Ageing biomarkers; DNA methylation predictors; Epidemiology; Epigenetic clock; Metabolic risk score; NMR metabolomics.


Conflict of interest statement

Declaration of interests Authors declare no competing interests.

Figures

Fig. 1
Fig. 1
Study and methods overview. a) Study overview. (i) We employed 4334 samples, from 4 cohort of the BIOS Consortium, DNAm methylation and metabolomics to train and test our surrogates (orange border). (ii) Coupled with 1544 samples from the Rotterdam Study (black border) to evaluate their associations with mortality. (iii) We applied a calibration to harmonise all the metabolomics data, using Lifelines as a reference dataset. (iv) We then train ElasticNET models, on LIFELINES and NTR. Using the DNA methylation data, we predict two types of outcomes: 1) the pre-trained metabolomics mortality predictor (MetaboHealth), and 2) the 64 metabolic features. (v) The DNAm models are evaluated using 1) the hold-out valuation sets (LLS and RS) and 2) a 5-Fold Cross Validation on the training sets (NTR and LIFELINES). (vi) Finally, we use the DNAm models to generate surrogate metabolomics features in the RS dataset (1544 samples) and 1) evaluate their univariate associations to mortality (while correcting for age, sex), and 2) trained a complete Cox regression combining our DNAm metabolomics features and the pre-trained DNAm surrogates. b) Data availability, usage, and main phenotypic characteristics of the individuals in each cohort.
Fig. 2
Fig. 2
Harmonization of the metabolomics data. a) Distribution of glucose in NTR and LIFELINES before (upper figure) and after (lower figure) calibration. b) tSNE of the metabolomics dataset after calibration and coloured by the four biobanks (LIFELINES, LLS, RS and NTR). c) Principal Variance Component Analysis (PVCA) before (red) and after (green) calibration, estimating the variance explained in the dataset by available clinical variables (e.g., sex, age, BMI, diabetes). d) Bar-plots showing the differences in men and women in the calibrated MetaboHealth in the four cohorts. e) Observed mean values of age, BMI, eGFR, hsCRP and pressure, and f) alcohol consumption, current smoking, and diabetes ordered following the calibrated MetaboHealth in different percentiles over the entire BIOS population. On top of each panel the Spearman correlation ρ.
Fig. 3
Fig. 3
DNAm metabolites accuracies. Circular heatmap representing the accuracies of the DNAm-based models for 64 1H-NMR metabolic features by Nightingale Health and MetaboHealth. The outer ring shows the correlation between measured and DNAm-based metabolomics features, while correlation between DNAm surrogates with age and sex are shown in the middle and inner ring, respectively. Mean CV states for mean cross validation results in the cohorts LL and NTR together in the training (train) and test (test) sets, while results in the left-out set are indicated with RS and LLS. Moreover, the metabolomics features are annotated for their metabolomics group type (e.g., amino acids, fatty acids etc.) and if they were or were not included in MetaboHealth. Finally, we indicated with asterisks the tertiles of mean correlations with the measured metabolites over the test sets.
Fig. 4
Fig. 4
Correlations with pre-trained DNAm scores after regressing out the ageing signal. Correlations between our DNAm metabolic features and previously trained clocks (Hannum, Horvath, PhenoAge, bAge, and GrimAge), the DNAm surrogates included in GrimAge and the 109 DNAm-based surrogates for proteins (EpiScores) by Gall et al. These correlations were calculated on the age regressed DNA methylation-based features (indicated as “AgeAccel”).
Fig. 5
Fig. 5
Associations with time to death. a) Significant univariate associations of the DNAm metabolomics features with time to all-cause mortality in RS (N = 1542 with 285 reported deaths). The associations are grouped based on the metabolomics groups coloured by the significant associations or the metabolites with mortality in Deelen et al. The asterisks (∗) separates nominal significant DNAm metabolomics features from the FDR significant ones [cox regression]. b) Stepwise Cox regression predicting of time to all-cause mortality optimised in RS, composed combining age, 3 DNAm surrogates included in GrimAge, and 9 DNAm metabolic models and 12 protein EpiScores. Finally, c) presents the ROC curves and the accuracies (AUC) at 5-years mortality for our newly developed clocks as compared to previously trained scores. Similarly, d) reports the Hazard Ratios for each of the Age accelerated multivariate scores, regressing also for sex, BMI and cell counts. In this last figure the scores as split for containing our DNAm metabolomics features (red) or not (blue).
Fig. 6
Fig. 6
CpG selections of the ElasticNET models. a) Log2 Odds ratio indicating the enriched in annotations of the CpG by our ElasticNET models. b) The central heatmap reports the log 10 p values [Fisher test] of the enrichments CpG sites selected by our models (rows) and the 50 most significant traits in the EWAS Catalog and Atlas enriched (rows). Bottom: the median coefficients in each DNAm model, and the number of CpGs per model. Right: the median coefficients given by our DNAm model to the overlapping CpGs with each trait. c) The nine most used probes (rows) over the 65 ElasticNET models (columns), coloured by metabolic groups. Top: The models were ordered by the mean accuracy over the test sets (CV, LLS, and RS). Right: The number of models which include each CpG and their nearest genes. d) Manhattan plot-like figure indicating the Variable importance of the single CpG probes in the DNAm metabolic models.

References

    1. López-Otín C., Blasco M.A., Partridge L., Serrano M., Kroemer G. Hallmarks of aging: an expanding universe. Cell. 2023;186 doi: 10.1016/j.cell.2022.11.001. - DOI - PubMed
    1. Partridge L., Deelen J., Slagboom P.E. Facing up to the global challenges of ageing. Nature. 2018;561:45–56. - PubMed
    1. Comfort A. Test-Battery to measure ageing-rate in man. Lancet. 1969;294:1411–1415. - PubMed
    1. Blackburn E.H., Greider C.W., Szostak J.W. Telomeres and telomerase: the path from maize, Tetrahymena and yeast to human cancer and aging. Nat Med. 2006;12:1133–1138. - PubMed
    1. Horvath S. DNA methylation age of human tissues and cell types. Genome Biol. 2013;14:R115. - PMC - PubMed

LinkOut - more resources