. 2024 Sep;65(9):100623.
doi: 10.1016/j.jlr.2024.100623. Epub 2024 Aug 19.

Natriuretic peptide receptor-C perturbs mitochondrial respiration in white adipose tissue

Affiliations

Natriuretic peptide receptor-C perturbs mitochondrial respiration in white adipose tissue

Shi-Jin Li et al. J Lipid Res. 2024 Sep.

Abstract

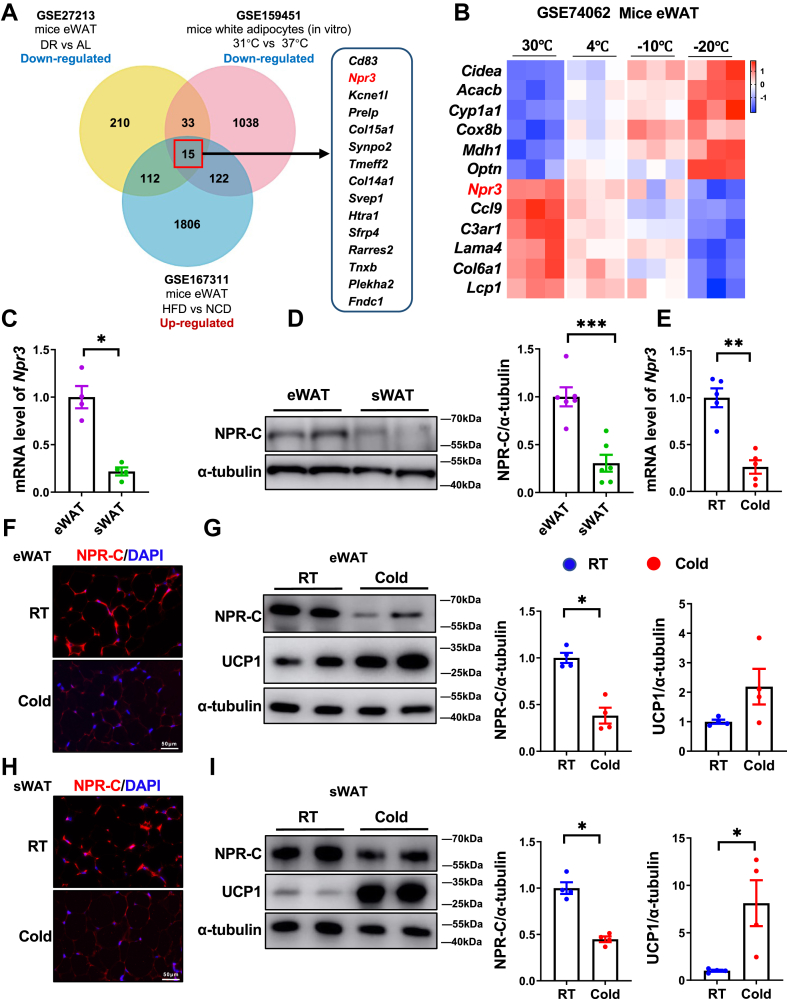
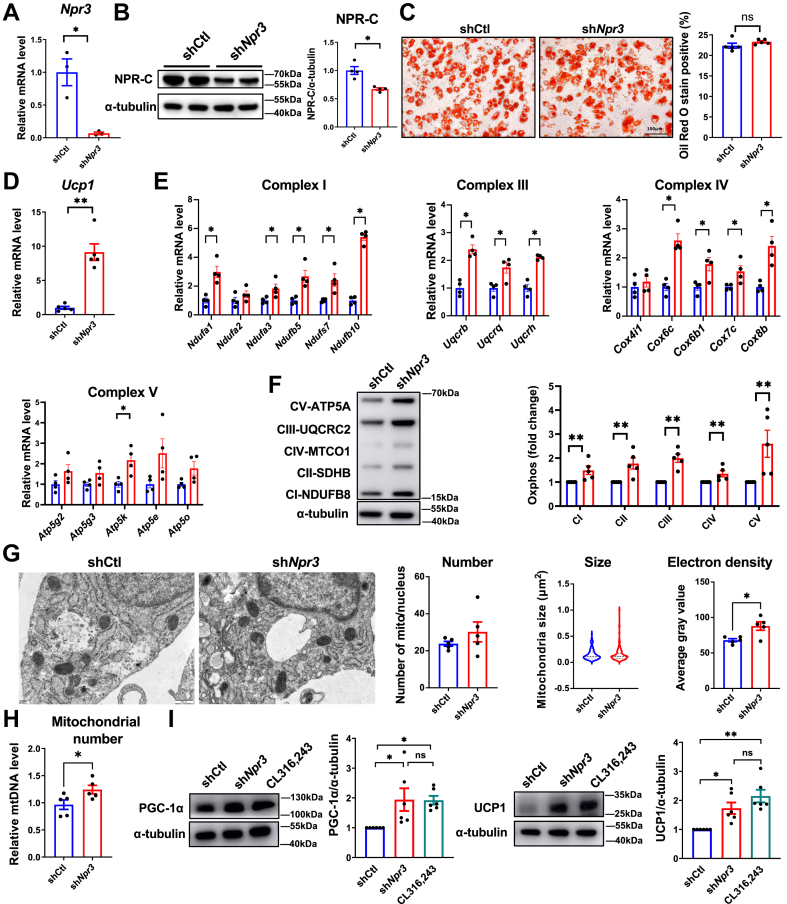
Natriuretic peptide receptor-C (NPR-C) is highly expressed in adipose tissues and regulates obesity-related diseases; however, the detailed mechanism remains unknown. In this research, we aimed to explore the potential role of NPR-C in cold exposure and high-fat/high-sugar (HF/HS) diet-induced metabolic changes, especially in regulating white adipose tissue (WAT) mitochondrial function. Our findings showed that NPR-C expression, especially in epididymal WAT (eWAT), was reduced after cold exposure. Global Npr3 (gene encoding NPR-C protein) deficiency led to reduced body weight, increased WAT browning, thermogenesis, and enhanced expression of genes related to mitochondrial biogenesis. RNA-sequencing of eWAT showed that Npr3 deficiency enhanced the expression of mitochondrial respiratory chain complex genes and promoted mitochondrial oxidative phosphorylation in response to cold exposure. In addition, Npr3 KO mice were able to resist obesity induced by HF/HS diet. Npr3 knockdown in stromal vascular fraction (SVF)-induced white adipocytes promoted the expression of proliferator-activated receptor gamma coactivator 1α (PGC1α), uncoupling protein one (UCP1), and mitochondrial respiratory chain complexes. Mechanistically, NPR-C inhibited cGMP and calcium signaling in an NPR-B-dependent manner but suppressed cAMP signaling in an NPR-B-independent manner. Moreover, Npr3 knockdown induced browning via AKT and p38 pathway activation, which were attenuated by Npr2 knockdown. Importantly, treatment with the NPR-C-specific antagonist, AP-811, decreased WAT mass and increased PGC-1α, UCP1, and mitochondrial complex expression. Our findings reveal that NPR-C deficiency enhances mitochondrial function and energy expenditure in white adipose tissue, contributing to improved metabolic health and resistance to obesity.

Keywords: browning; mitochondrial complex; natriuretic peptide receptor C; obesity; white adipose tissue.


Conflict of interest statement

Conflict of interest The authors declare that they have no conflict of interest with the contents of this article.

Figures

Fig. 1
Fig. 1
Cold-induced decrease of NPR-C expression in epididymal WAT (eWAT). A: Venn diagram identifying candidate genes for WAT metabolic disorders. B: Heatmap of differential gene expression from mice eWAT exposed to different temperatures. C: Relative mRNA expression of Npr3 in mice eWAT and subcutaneous WAT (sWAT). D: Western blot analysis and quantification data of NPR-C in mice eWAT and sWAT. E through I. WT male mice were individually housed at room temperature (RT) or 4°C (Cold) for 72 h. E: qPCR analysis of Npr3 mRNA in eWAT of mice from RT and Cold. F: Representative images of NPR-C (red) immunofluorescence in eWAT from RT and Cold. DAPI was used to stain the nucleus in blue. G: Western blot analysis and quantification data of NPR-C and uncoupling protein 1 (UCP1) protein expression in eWAT from RT and Cold. H: Representative images of NPR-C (red) immunofluorescence in sWAT from RT and Cold. DAPI was used to stain the nucleus in blue. I: Western blot analysis and quantification data of NPR-C and UCP1 protein expression in sWAT from RT and Cold. Data are presented as mean ± SEM. Data were analyzed by unpaired Student’s t-test. ∗P < 0.05, ∗∗P < 0.01, ∗∗∗P < 0.001.
Fig. 2
Fig. 2
NPR-C deficiency promotes adipose tissue thermogenesis. A: Representative images and body weight of WT and Npr3 knockout (KO) mice. B: Tissue weight of WT and KO mice. C: Representative images and H&E staining of eWAT and sWAT of WT and KO mice. D: Distribution of adipocyte size in eWAT (left) and sWAT (right) of WT and KO mice. The percentage of cells in relation to cell diameter for WT and KO mice (WT, n = 5; KO, n = 5. Five H&E-stained slides per mouse). E: qPCR analysis of browning, thermogenesis, lipogenesis, inflammation, and angiogenesis genes expression in eWAT from WT and KO mice. F: Western blot analysis and quantification data of UCP1 protein expression in eWAT from WT and KO mice. G: Representative images and quantification data of UCP1 (red) immunofluorescence in eWAT from WT and KO mice. DAPI was used to stain the nucleus in blue. Data are presented as mean ± SEM. Data were analyzed by unpaired Student’s t-test. ∗P < 0.05, ∗∗P < 0.01.
Fig. 3
Fig. 3
NPR-C deficiency leads to enhanced mitochondrial function in cold exposure. A: H&E staining of eWAT and sWAT from WT and KO mice exposed to RT or Cold for 72 h. B: Distribution of adipocyte size in eWAT (top) and sWAT (bottom). (WT Cold, n = 5; KO Cold, n = 5. Five H&E-stained slides per mouse). C: Volcano plot comparisons of gene expression in eWAT. D: Top KEGG terms in eWAT. E. Top GO terms in eWAT. F: Heatmap of up-regulated genes related to mitochondrial respiratory chain complexes in eWAT. G. qPCR analysis of mitochondrial respiratory chain complexes in eWAT. CI: complex I; CII: complex II; CIII: Complex III; CIV: complex IV; CV: complex V. H: Western blot analysis and quantification data of mitochondrial respiratory chain complex protein expression in eWAT. I: NAD/NADH ratio in eWAT. J: ATP levels in eWAT. K: Relative mtDNA levels in eWAT. Data are presented as mean ± SEM. Data were analyzed by unpaired Student’s t-test. ∗P < 0.05, ∗∗P < 0.01.
Fig. 4
Fig. 4
NPR-C deficiency attenuates high-fat/high-sugar (HF/HS)-induced metabolic dysfunction. The HF/HS diet started from 4 weeks and lasted for 14 weeks. A: Representative images of 14-week-old male WT and KO mice. B: Body weight curve of WT and KO mice induced by HF/HS diet. C: Tissue weight of WT and KO mice induced by HF/HS diet. D: Fat mass and lean mass of WT-HF/HS and KO-HF/HS mice. E: Representative fat highlighting images (top, fat is white), highlighted pseudo-color image (bottom, fat is red) in magnetic resonance imaging (MRI) analysis. F: Representative images and H&E staining of liver and eWAT, and distribution of adipocyte size in eWAT (WT, n = 4; KO, n = 4. Five H&E-stained slides per mouse) in WT-HF/HS and KO-HF/HS mice. G: Glucose tolerance test (GTT) (left) and calculated area under the curve (AUC) (right) in WT-HF/HS and KO-HF/HS mice. H: Insulin tolerance test (ITT) (left) and calculated AUC (right) in WT-HF/HS and KO-HF/HS mice. I: ANCOVA analysis results of O2 consumption (VO2) of WT-HF/HS and KO-HF/HS mice over 48 h. P value was between two groups. J: ANCOVA analysis results of energy expenditure (EE) of WT-HF/HS and KO-HF/HS mice over 48h. P value was between two groups. K: Food and drink intake (left) and physical activity (right) of WT-HF/HS and KO-HF/HS mice. L: Systolic (left) and diastolic (right) blood pressure (BP) of WT-HF/HS and KO-HF/HS mice. Data are presented as mean ± SEM. Data were analyzed by unpaired Student’s t-test. ∗P < 0.05, ∗∗P < 0.01, ns: not significant.
Fig. 5
Fig. 5
The effect of NPR-C on mitochondrial function in vitro. A: qPCR analysis of Npr3 mRNA expression in SVF-induced white adipocytes transduced with scramble RNA control (shCtl) or Npr3 shRNA (shNpr3). B: Western blot analysis and quantification data of NPR-C protein expression. C. The Oil Red O staining of SVF cells transfected with shCtl or shNpr3 followed by induction into white adipocytes. D: qPCR analysis of Ucp1 mRNA expression in SVF-induced white adipocytes transduced with shCtl or shNpr3. E: qPCR analysis of mRNA expressions of mitochondrial respiratory chain complexes. F: Western blot analysis and quantification data of oxidative phosphorylation complex proteins. G. Transmission electron microscopy (TEM) images and analysis of SVF-induced white adipocytes transduced with shCtl or shNpr3. Mitochondrial size was measured for all mitochondria in each field of view. Electron density was determined by calculating the gray value of each mitochondrion, with averages represented as single dots. H: qPCR analysis of the number of mitochondria. I: Western blot analysis and quantification data of PGC1α and UCP1 protein expression in SVF-induced white adipocytes transduced with shCtl or shNpr3 or treated with CL316,243 for 6 h. Data are presented as mean ± SEM. Data were analyzed by unpaired Student’s t-test. ∗P < 0.05, ∗∗P < 0.01, ns: not significant.
Fig. 6
Fig. 6
NPR-C regulates mitochondrial function dependent on NPR-B signaling. A: KEGG pathways of eWAT in WT and Npr3 KO mice in the cold-exposure model. B: Western blot analysis and quantification data of p-Akt/Akt and p-p38/p38 expression in SVF-induced white adipocytes transduced with shCtl or shNpr3 or treated with CL316,243 for 6 h. C through D: Western blot analysis and quantification data of UCP1 expression in SVF-induced white adipocytes transduced with shCtl or shNpr3 or shNpr3 plus MK2206 or SB203580. E: Effects of shRNAs on the protein expression of PGC1α, UCP1, NPR-C, NPR-B, p-Akt/Akt and p-p38/p38 in SVF-induced white adipocytes. F: Effects of shRNAs on oxygen consumption rate (OCR). G: Effects of shRNAs on cAMP, cGMP, and calcium levels. Data are presented as mean ± SEM. Data were analyzed by one-way ANOVA followed by Tukey's test. ∗P < 0.05, ∗∗P < 0.01, ∗∗∗P < 0.001, ns: not significant.
Fig. 7
Fig. 7
Inhibition of NPR-C mimics cold-induced adipose tissue thermogenesis. A: Western blot analysis and quantification data of p-Akt/Akt and p-p38/p38 expression in SVF-induced white adipocytes under different doses of AP-811 for 5 min. B: Relative eWAT and sWAT weight of WT mice injected with 0.9% NaCl or AP-811. C. Representative images and H&E staining and adipocyte sizes of eWAT and sWAT. D: Representative images of uncoupling protein 1 (UCP1) (red) immunofluorescence and quantification data of eWAT and sWAT. DAPI was used to stain the nucleus in blue. E through F: Western blot analysis and quantification data of PGC1α, UCP1, and mitochondrial respiratory chain complex expression in eWAT and sWAT. Data were analyzed by unpaired Student’s t-test. ∗P < 0.05, ∗∗P < 0.01, ∗∗∗P < 0.001.
Fig. 8
Fig. 8
Schematic representation of the mechanism of NPR-C on mitochondrial respiration in white adipose tissue.

References

    1. Morigny P., Boucher J., Arner P., Langin D. Lipid and glucose metabolism in white adipocytes: pathways, dysfunction and therapeutics. Nat. Rev. Endocrinol. 2021;17:276–295. - PubMed
    1. Tchernof A., Despres J.P. Pathophysiology of human visceral obesity: an update. Physiol. Rev. 2013;93:359–404. - PubMed
    1. Karpe F., Pinnick K.E. Biology of upper-body and lower-body adipose tissue--link to whole-body phenotypes. Nat. Rev. Endocrinol. 2015;11:90–100. - PubMed
    1. Borgeson E., Boucher J., Hagberg C.E. Of mice and men: pinpointing species differences in adipose tissue biology. Front. Cell Dev. Biol. 2022;10 - PMC - PubMed
    1. Verboven K., Hansen D., Jocken J.W.E., Blaak E.E. Natriuretic peptides in the control of lipid metabolism and insulin sensitivity. Obes. Rev. 2017;18:1243–1259. - PubMed

Substances

LinkOut - more resources