. 2024 Dec;166(6):1511-1531.
doi: 10.1016/j.chest.2024.06.3824. Epub 2024 Aug 16.

Equivalency of Multiple Biomarkers to Clinical Pulmonary Arterial Hypertension Survival Risk Models

Affiliations

Equivalency of Multiple Biomarkers to Clinical Pulmonary Arterial Hypertension Survival Risk Models

Megan Griffiths et al. Chest. 2024 Dec.

Abstract

Background: Risk assessment in pulmonary arterial hypertension (PAH) is fundamental to guiding treatment and improved outcomes. Clinical models are excellent at identifying high-risk patients, but leave uncertainty amongst moderate-risk patients.

Research question: Can a multiple blood biomarker model of PAH, using previously described biomarkers, improve risk discrimination over current models?

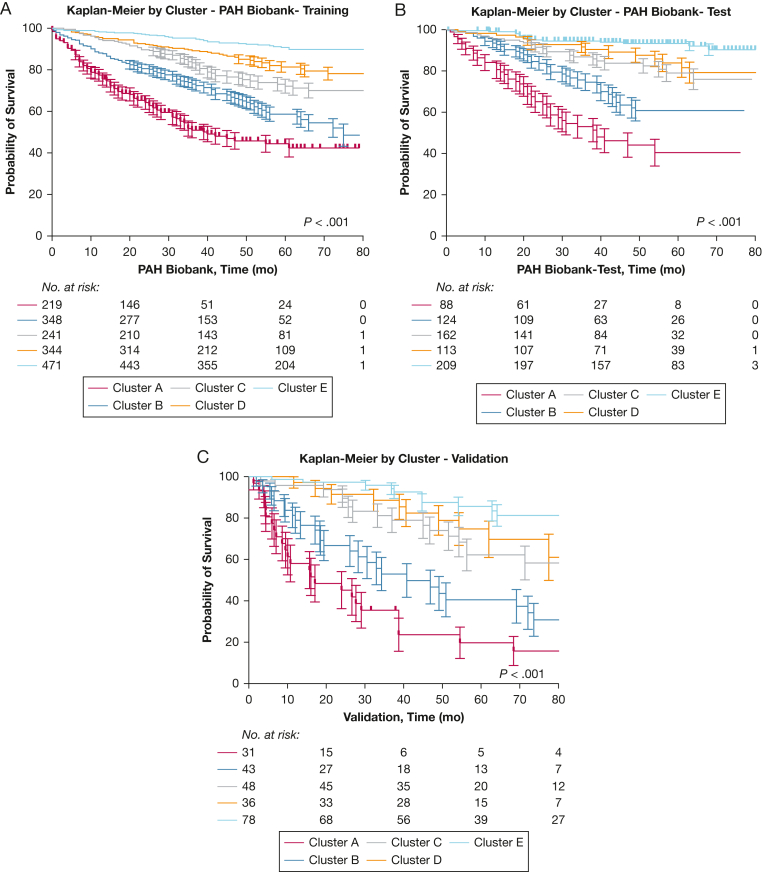
Study design and methods: Using a multiplex enzyme-linked immunosorbent assay, we measured N-terminal pro-B-type natriuretic peptide (NT-proBNP), soluble suppressor of tumorigenicity, IL-6, endostatin, galectin 3, hepatoma derived growth factor, and insulin-like growth factor binding proteins (IGFBP1-7) in training (n = 1,623), test (n = 696), and validation (n = 237) cohorts. Clinical variables and biomarkers were evaluated by principal component analysis. NT-proBNP was not included to develop a model independent of NT-proBNP. Unsupervised k-means clustering classified participants into clusters. Transplant-free survival by cluster was examined using Kaplan-Meier and Cox proportional hazard regressions. Hazard by cluster was compared with NT-proBNP, Registry to Evaluate Early and Long-Term PAH Disease Management (REVEAL), and European Society of Cardiology and European Respiratory Society risk models alone and combined clinical and biomarker models.

Results: The algorithm generated five clusters with good risk discrimination using six biomarkers, weight, height, and age at PAH diagnosis. In the test and validation cohorts, the biomarker model alone performed equivalent to REVEAL (area under the receiver operating characteristic curve, 0.74). Adding the biomarker model to the European Society of Cardiology and European Respiratory Society score and REVEAL score improved the European Society of Cardiology and European Respiratory Society score and REVEAL score. The best overall model was the biomarker model adjusted for NT-proBNP with the best C statistic, Akaike information criterion, and calibration for the adjusted model compared with either the biomarker or NT-proBNP model alone.

Interpretation: In this study, a multibiomarker model alone was equivalent to current PAH clinical mortality risk prediction models and improved performance when combined and added to NT-proBNP. Clinical risk scores offer excellent predictive models, but require multiple tests; adding blood biomarkers to models can improve prediction or can enable more frequent, noninvasive monitoring of risk in PAH to support therapeutic decision-making.

Keywords: biomarkers; pulmonary hypertension; risk prediction.


Conflict of interest statement

Financial/Nonfinancial Disclosures None declared.

Figures

Figure 1
Figure 1
Flowchart showing participant enrollment and eligibility for analysis. PAH = pulmonary arterial hypertension; PAH Biobank = National Biological Sample and Data Repository for Pulmonary Arterial Hypertension.
Figure 2
Figure 2
Diagram showing methods for model development in the training cohort. PAH Biobank = National Biological Sample and Data Repository for Pulmonary Arterial Hypertension; PC = principal components; SSE = sum of squared error.
Figure 3
Figure 3
Diagram showing methods for comparison of baseline and additive models in training, test, and validation cohorts. AIC = Akaike information criterion; ERS = European Respiratory Society; ESC = European Society of Cardiology; NT-proBNP = N-terminal pro-B-type natriuretic peptide; REVEAL = Registry to Evaluate Early and Long-Term PAH Disease Management.
Figure 4
Figure 4
A, B, Biomarker-based clusters in the National Biological Sample and Data Repository for Pulmonary Arterial Hypertension: plot of clusters (A), with colors representing cluster membership, and graph showing scaled distribution of features by cluster (B). NT-proBNP included for reference. Dim = dimension; IGFBP = insulin-like growth factor binding protein; NT-proBNP = N-terminal pro-B-type natriuretic peptide; ST2 = soluble suppressor of tumorigenicity.
Figure 5
Figure 5
Kaplan-Meier curves and forest plots of risk for event (death or transplantation) based on cluster membership. A, Kaplan-Meier curve showing event by cluster membership in the PAH Biobank training cohort. B, Kaplan-Meier curve showing event by cluster membership in the PAH Biobank test cohort. C, Kaplan-Meier curve showing event by cluster membership in the independent validation cohort. D, Forest plot showing the hazard ratio for event by cluster membership in the PAH Biobank training cohort. E, Forest plot showing the hazard ratio for event by cluster membership in the PAH Biobank test cohort. F, Forest plot showing the hazard ratio for event by cluster membership in the independent validation cohort. PAH Biobank = National Biological Sample and Data Repository for Pulmonary Arterial Hypertension.
Figure 5
Figure 5
Kaplan-Meier curves and forest plots of risk for event (death or transplantation) based on cluster membership. A, Kaplan-Meier curve showing event by cluster membership in the PAH Biobank training cohort. B, Kaplan-Meier curve showing event by cluster membership in the PAH Biobank test cohort. C, Kaplan-Meier curve showing event by cluster membership in the independent validation cohort. D, Forest plot showing the hazard ratio for event by cluster membership in the PAH Biobank training cohort. E, Forest plot showing the hazard ratio for event by cluster membership in the PAH Biobank test cohort. F, Forest plot showing the hazard ratio for event by cluster membership in the independent validation cohort. PAH Biobank = National Biological Sample and Data Repository for Pulmonary Arterial Hypertension.
Figure 6
Figure 6
A, Receiver operator characteristic curve of cluster membership (blue), NT-proBNP (green), and a combination of cluster membership and NT-proBNP (red) in the PAH Biobank training cohort. The AUC of NT-proBNP and the additive model are significantly different (P < .001). B, Calibration curve showing predicted vs actual risk by NT-proBNP in the PAH Biobank training cohort. C, Calibration curve showing the predicted vs actual risk by NT-proBNP plus cluster model in the PAH Biobank training cohort. AUC = area under the receiver operator characteristic curve; NPV = negative predictive value; NT-proBNP = N-terminal pro-B-type natriuretic peptide; PAH Biobank = National Biological Sample and Data Repository for Pulmonary Arterial Hypertension; PPV = positive predictive value.
Figure 7
Figure 7
A, Receiver operating characteristic curve of cluster membership (blue), NT-proBNP (green), and a combination of cluster membership and NT-proBNP (red) in the PAH Biobank test cohort. The AUC of NT-proBNP and the additive model are significantly different (P = .01). B, Calibration curve showing predicted vs actual risk by NT-proBNP in the PAH Biobank test cohort. C, Calibration curve showing predicted vs actual risk by NT-proBNP plus cluster model in the PAH Biobank test cohort. AUC = area under the receiver operator characteristic curve; NPV = negative predictive value; NT-proBNP = N-terminal pro-B-type natriuretic peptide; PAH Biobank = National Biological Sample and Data Repository for Pulmonary Arterial Hypertension; PPV = positive predictive value.
Figure 8
Figure 8
A, Receiver operating characteristic curve of cluster membership (blue), NT-proBNP (green), and a combination of cluster membership and NT-proBNP (red) in the validation cohort. The AUC of NT-proBNP and the additive model are not significantly different (P = .07). B, Calibration curve showing predicted vs actual risk by NT-proBNP in the validation cohort. C, Calibration curve showing predicted vs actual risk by NT-proBNP plus cluster model in the validation cohort. AUC = area under the receiver operator characteristic curve; NPV = negative predictive value; NT-proBNP = N-terminal pro-B-type natriuretic peptide; PPV = positive predictive value.
Figure 9
Figure 9
A, Kaplan-Meier curve of transplant-free survival by cluster in participants with moderate-risk or low-risk NT-proBNP. B, Kaplan-Meier curve of transplant-free survival by cluster in participants with moderate-risk or low-risk NT-proBNP, scaled to show separation of curves. Transplant-free survival at 1 year by cluster: cluster A, 90%; cluster B, 93%; cluster C, 95%; cluster D, 98%; and cluster E, 99%. Transplant-free survival at 2 years by cluster: cluster A, 82%; cluster B, 88%; cluster C, 93%; cluster D, 97%; and cluster E, 99%. NT-proBNP = N-terminal pro-B-type natriuretic peptide; PAH Biobank = National Biological Sample and Data Repository for Pulmonary Arterial Hypertension.
Supplementary Figure 1
Supplementary Figure 2
Supplementary Figure 3
Supplementary Figure 4
Supplementary Figure 5

References

    1. Galiè N., Channick R.N., Frantz R.P., et al. Risk stratification and medical therapy of pulmonary arterial hypertension. Eur Respir J. 2019;53(1) - PMC - PubMed
    1. Humbert M., Kovacs G., Hoeper M.M., et al. 2022 ESC/ERS guidelines for the diagnosis and treatment of pulmonary hypertension. Eur Respir J. 2023;61(1) - PubMed
    1. Benza R.L., Gomberg-Maitland M., Elliott C.G., et al. Predicting survival in patients with pulmonary arterial hypertension: the REVEAL risk score calculator 2.0 and comparison with ESC/ERS-based risk assessment strategies. Chest. 2019;156(2):323–337. - PubMed
    1. Benza R.L., Miller D.P., Gomberg-Maitland M., et al. Predicting survival in pulmonary arterial hypertension. Circulation. 2010;122(2):164–172. - PubMed
    1. Humbert M., Sitbon O., Chaouat A., et al. Survival in patients with idiopathic, familial, and anorexigen-associated pulmonary arterial hypertension in the modern management era. Circulation. 2010;122(2):156–163. - PubMed