. 2024 Oct:88:102012.
doi: 10.1016/j.molmet.2024.102012. Epub 2024 Aug 16.

Mitochondrial protein deacetylation by SIRT3 in osteoclasts promotes bone resorption with aging in female mice

Affiliations

Mitochondrial protein deacetylation by SIRT3 in osteoclasts promotes bone resorption with aging in female mice

Kimberly K Richardson et al. Mol Metab. 2024 Oct.

Abstract

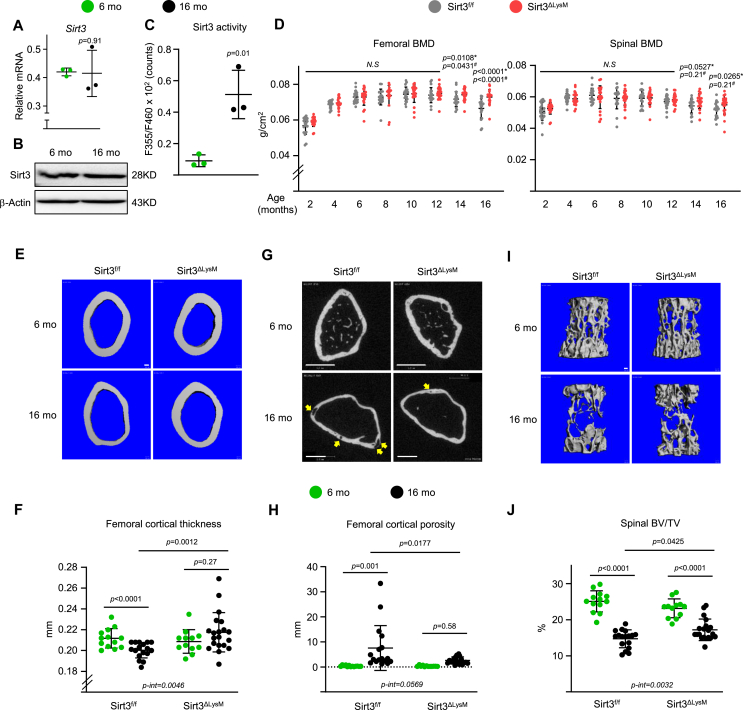
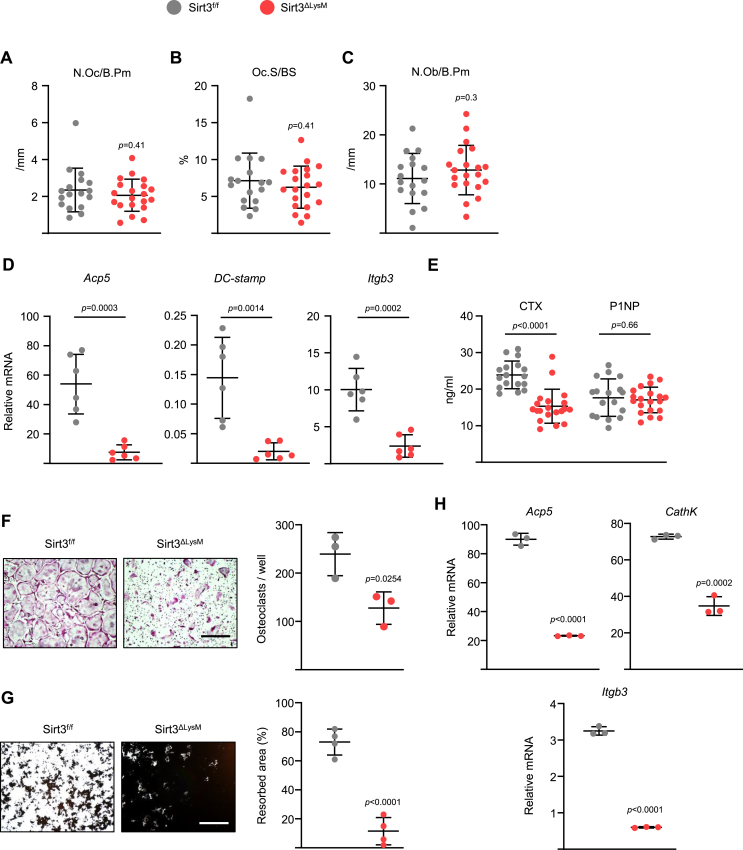
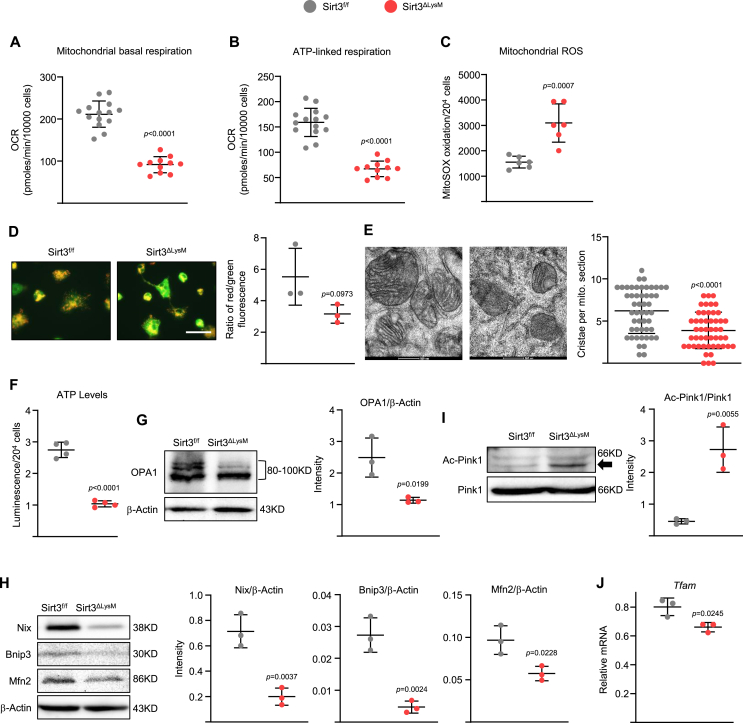
Objectives: The mitochondrial deacetylase sirtuin-3 (SIRT3) is necessary for the increased bone resorption and enhanced function of mitochondria in osteoclasts that occur with advancing age; how SIRT3 drives bone resorption remains elusive.

Methods: To determine the role of SIRT3 in osteoclast mitochondria, we used mice with conditional loss of Sirt3 in osteoclast lineage and mice with germline deletion of either Sirt3 or its known target Pink1.

Results: SIRT3 stimulates mitochondrial quality in osteoclasts in a PINK1-independent manner, promoting mitochondrial activity and osteoclast maturation and function, thereby contributing to bone loss in female but not male mice. Quantitative analyses of global proteomes and acetylomes revealed that deletion of Sirt3 dramatically increased acetylation of osteoclast mitochondrial proteins, particularly ATPase inhibitory factor 1 (ATPIF1), an essential protein for mitophagy. Inhibition of mitophagy via mdivi-1 recapitulated the effect of deletion of Sirt3 or Atpif1 in osteoclast formation and mitochondrial function.

Conclusions: Decreasing mitophagic flux in osteoclasts may be a promising pharmacotherapeutic approach to treat osteoporosis in older adults.

Keywords: Acetylation; Aging; Mitochondria; Osteoclasts; Proteomics; SIRT3.


Conflict of interest statement

Declaration of competing interest The authors declare that they have no known competing financial interests or personal relationships that could have appeared to influence the work reported in this paper.

Figures

Figure 1
Figure 1
Age-related bone loss requires osteoclast SIRT3 in female mice. (A) mRNA expression, (B) protein levels, and (C) enzymatic activity of SIRT3 in cultures of bone marrow-derived macrophages (BMMs) from 6- or 16-month-old female C57BL/6 mice treated with M-CSF (30 ng/mL) and RANKL (30 ng/mL) for 3 days. (D–J) A cohort of female Sirt3ΔLysM mice and Sirt3fl/fl littermate controls were aged to 16 months. Another cohort of female mice of the same genotypes euthanized at 6 months of age served as young controls. (D) Sequential bone mass density (BMD) measurements in the aging cohort by dual-energy x-ray absorptiometry (n = 19–20 animals/group). (E–F) Imaging and quantification of femoral bones from female Sirt3ΔLysM mice and wild-type littermates by micro-CT after sacrifice (n = 12–20 animals/group). Scale bar: 100 μm. (G–H) Imaging and quantification of cortical porosity at the distal metaphysis of the femur by micro-CT (n = 17–19 animals/group). Scale bar: 100 μm. (I–J) Imaging and quantification of vertebral bones from female Sirt3ΔLysM mice and wild-type littermates by micro-CT after sacrifice (n = 12–20 animals/group). Scale bar: 100 μm. Line and error bars represent mean ± SD. P values were determined using (A–C) Student's t-test or (F–J) 2-way ANOVA. Interaction terms generated by 2-way ANOVA are shown below each graph. (D) P values were determined using ∗, Student's t-test or #, repeated-measures ANOVA between Sirt3ΔLysM mice and Sirt3fl/fl littermate controls in the same age.
Figure 2
Figure 2
Conditional deletion of Sirt3 in LysM-Cre–targeted cells decreases bone resorption in aged female mice. (A–C) Number of osteoclasts (N.Oc/B.Pm) (A), osteoclast surface (Oc.S/BS) (B) and number of osteoblasts (N.Ob/B.Pm) (C) per endocortical bone surface of nondecalcified femur sections stained for TRAPase activity from 16-month-old female Sirt3ΔLysM mice and wild-type littermates (n = 17–20 animals/group). (D) qPCR of mRNA isolated from L1 vertebrae (n = 6 animals/group) obtained from 16-month-old female mice. (E) Serum concentration of a collagen degradation product (CTx) and N-terminal propeptide of type I procollagen (P1NP) in 16-month-old female Sirt3ΔLysM mice and wild-type littermates by ELISA (n = 17–20 animals/group). (F–H) BMMs were isolated from 16-month-old female Sirt3ΔLysM mice and wild-type littermates and were cultured with M-CSF (30 ng/mL) and RANKL (30 ng/mL) for 5 days. (F) Representative pictures (left) and number (right) of TRAP+ multinucleated osteoclasts generated from BMMs (triplicates of pooled cultures). Scale bar: 500 μm. (G) Representative pictures (left) and resorbed areas (right) of Von Kossa–stained bone biomaterial surface (triplicates). Scale bar: 500 μm. The resorbed areas appear white, and the areas of the mineralized surface that were not resorbed appear black. (H) Osteoclast marker levels in mRNA of cultured osteoclasts measured by qPCR (triplicate cultures). Line and error bars represent mean ± SD. P values were determined using Student's t-test. All measures were performed in cultured BMMs pooled from 4 to 5 mice/group and repeated at least twice.
Figure 3
Figure 3
Conditional deletion of Sirt3 in LysM-Cre–targeted cells decreases osteoclast mitophagy in aged female mice. BMMs were isolated from 16-month-old female Sirt3ΔLysM mice and wild-type littermates and were cultured with M-CSF (30 ng/mL) and RANKL (30 ng/mL) for 3 days. (A–B) Mitochondrial and ATP-linked respirations per cell, in osteoclasts, were measured by Seahorse (n = 8–14 wells/group). (C) MitoSOX to evaluate mitochondrial ROS production (n = 6 wells/group). (D) Representative pictures of osteoclasts stained with JC-1 (left), and quantification of mitochondrial membrane potential (right) (triplicates of pooled cultures). Scale bar: 500 μm. (E) Ultrastructural appearance of mitochondria of osteoclasts by TEM (left) and the number of cristae formation per mitochondria section (right) (triplicates of pooled cultures). (F) ATP levels (expressed as relative light units, RLU). (G–H) Representative mitochondrial protein levels by Western blot (left) and expression levels as the indicated ratio (right) (triplicates of pooled cultures). (I) Representative PINK1 acetylation levels by Western blot (left) and expression levels as the indicated ratio (right) (triplicate cultures). (J) Tfam levels in mRNA of cultured osteoclasts measured by qPCR (triplicate cultures). Line and error bars represent mean ± SD. P values were determined using Student's t-test. All measures were performed in cultured BMMs pooled from 4 to 5 mice/group and repeated at least twice.
Figure 4
Figure 4
Inhibition of mitophagy by mdivi-1 mimics the effects of Sirt3 deletion in aged osteoclasts. Osteoclasts developed in cultures of BMMs from 24-month-old female C57BL/6 mice treated with M-CSF (30 ng/mL) and RANKL (30 ng/mL) for 3 (A–G) or 5 days (H–J) in the presence of mdivi-1 (10 μM). (A) Representative mitochondrial protein levels by Western blot (left) and expression levels as the indicated ratio (right) (triplicate cultures). (B–G) Different fractions of mitochondrial and nonmitochondrial respirations per cell, in osteoclasts, measured by Seahorse (n = 14–16 wells/group). (H) Representative pictures (left) and number (right) of TRAP+ multinucleated osteoclasts (triplicate cultures). Scale bar: 500 μm. (I) Representative pictures (left) and resorbed areas (right) of Von Kossa–stained bone biomaterial surface (quadruplicate cultures). Scale bar: 500 μm. (J) Osteoclast marker levels in mRNA of cultured osteoclasts measured by qPCR (triplicate cultures). Line and error bars represent mean ± SD. P values were determined using Student's t-test (A–G) or 1-way ANOVA (H–J). All in vitro assays were performed in cultured BMMs pooled from more than 3 mice and repeated at least twice.
Figure 5
Figure 5
Deletion of Pink1 does not affect age-related bone loss. A cohort of female Pink1 knockout mice and littermate controls were aged to 16 months. Another cohort of female mice of the same genotypes euthanized at 6 months of age served as young controls. (A–B) Imaging and quantification of femoral bones from female Pink1 knockout mice and littermate controls by micro-CT after sacrifice (n = 7–20 animals/group). (C–G) Imaging and quantification of vertebral bones from female Pink1 knockout mice and littermate controls by micro-CT after sacrifice (n = 7–20 animals/group). (H–I) BMMs were isolated from 16-month-old female Pink1 knockout mice and littermate controls and were cultured with M-CSF (30 ng/mL) and RANKL (30 ng/mL) for 4 (H–I) or 3 days (J–L). (H) Pink1 and osteoclast marker levels in mRNA of cultured osteoclasts measured by qPCR (triplicate cultures). (I) Number of TRAP+ multinucleated osteoclasts (quadruplicate cultures). (J) Representative mitophagy protein levels by Western blot. (K–L) Mitochondrial and ATP-linked respirations per cell, in osteoclasts, were measured by Seahorse (n = 12–15 wells/group). Line and error bars represent mean ± SD. P values were determined using 2-way ANOVA (B–G) or Student's t-test (H–I and K–L). Interaction terms generated by 2-way ANOVA are shown below each graph. All in vitro measures were performed in cultured BMMs pooled from 4 to 5 mice/group and repeated at least twice.
Figure 6
Figure 6
Deletion of Sirt3 induces hyperacetylation of mitochondrial proteins in aged osteoclasts. (A–C) BMMs were isolated from 24-month-old female C57BL/6 mice (A–B) or 16-month-old female Sirt3ΔLysM mice and littermate controls (C) and were cultured with M-CSF (30 ng/mL) and RANKL (30 ng/mL) for 3 days. Representative blots showing the acetylation status of mitochondrial proteins in whole cell lysates by Western blot (left) and expression levels as the indicated ratio (right) (triplicate cultures). (D) Western blot analysis of protein isolated from femoral bone shafts (n = 4 animals/group) obtained from 16-month-old female mice. All Western blot represents a minimum of 3 independent experiments. (E–J) BMMs were isolated from 16-month-old female Sirt3 null mice and littermate controls and were cultured with M-CSF (30 ng/mL) and RANKL (30 ng/mL) for 3 days. (E–G) Quantitative analysis of the global proteome was performed with label-free tandem mass spectrometry (triplicate cultures). The fold change in total proteins is presented in volcano plots for the effects of RANKL treatment or genotype (E). Top 5 highly up- or down-regulated pathways (RANKL vs Vehicle) (F–G). (H–J) A comprehensive acetylome analysis was performed with 3 samples per group as described in the flow chart (H). The fold change in hyperacetylated proteins is presented in volcano plots for the effects of RANKL treatment or genotype (I). Top 10 hyper-acetylated proteins (Sirt3 KO vs WT). Asterisk indicates published sites (J). Line and error bars represent mean ± SD. P values were determined using Student's t-test.
Figure 7
Figure 7
SIRT3-induced ATPIF1 deacetylation activates osteoclast mitophagy in aged mice. (A–E, not B) BMMs from 24-month-old female C57BL/6 mice transduced with lentiviral vectors expressing control sh-RNA or sh-RNAs targeting the hyperacetylated proteins and cultured with RANKL for 5 days (A and C) or 3 days (D–G). (A) Representative pictures (left) and number (right) of TRAP+ multinucleated osteoclasts and Von Kossa–stained bone biomaterial surface. (triplicate cultures). Scale bar: 500 μm. (B) BMMs were isolated from 24-month-old female C57BL/6 mice and were cultured with M-CSF (30 ng/mL) and RANKL (30 ng/mL) for 3 days. Western blot analysis of expression of ATPIF1. (triplicate cultures). (C) Levels of mRNA of an osteoclast marker in cultured osteoclasts measured by qPCR. (triplicate cultures). (D–F) Different fractions of mitochondrial respiration per cell measured with Seahorse (n = 10–14 wells/group). (G) Western blot analysis of expression of mitophagy marker. (triplicate cultures). Line and error bars represent mean ± SD. P values were determined using Student's t-test. All in vitro assays were performed in cultured BMMs pooled from more than 3 mice and repeated at least twice.

References

    1. Zhao E., Xu H., Wang L., Kryczek I., Wu K., Hu Y., et al. Bone marrow and the control of immunity. Cell Mol Immunol. 2012;9(1):11–19. - PMC - PubMed
    1. Almeida M., O'Brien C.A. Basic biology of skeletal aging: role of stress response pathways. J Gerontol A Biol Sci Med Sci. 2013;68(10):1197–1208. - PMC - PubMed
    1. Teitelbaum S.L., Ross F.P. Genetic regulation of osteoclast development and function. Nat Rev Genet. 2003;4(8):638–649. - PubMed
    1. Boyle W.J., Simonet W.S., Lacey D.L. Osteoclast differentiation and activation. Nature. 2003;423(6937):337–342. - PubMed
    1. Takayanagi H. Osteoimmunology: shared mechanisms and crosstalk between the immune and bone systems. Nat Rev Immunol. 2007;7(4):292–304. - PubMed

MeSH terms