. 2024 Aug 18;15(1):7100.
doi: 10.1038/s41467-024-51229-5.

CDK12 controls transcription at damaged genes and prevents MYC-induced transcription-replication conflicts

Affiliations

CDK12 controls transcription at damaged genes and prevents MYC-induced transcription-replication conflicts

Laura Curti et al. Nat Commun. .

Abstract

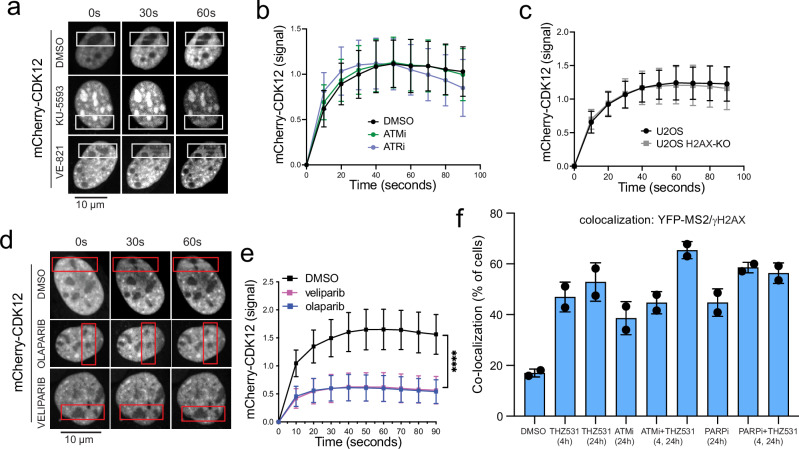
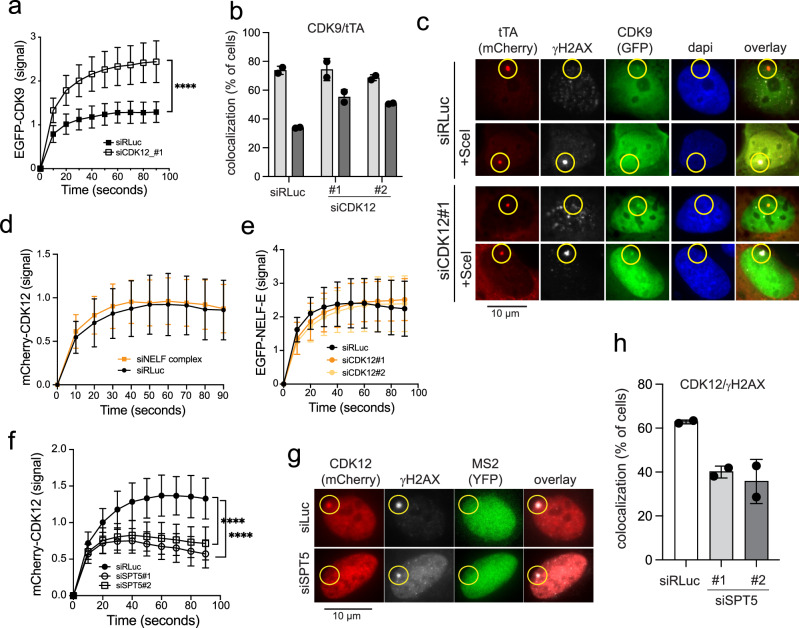
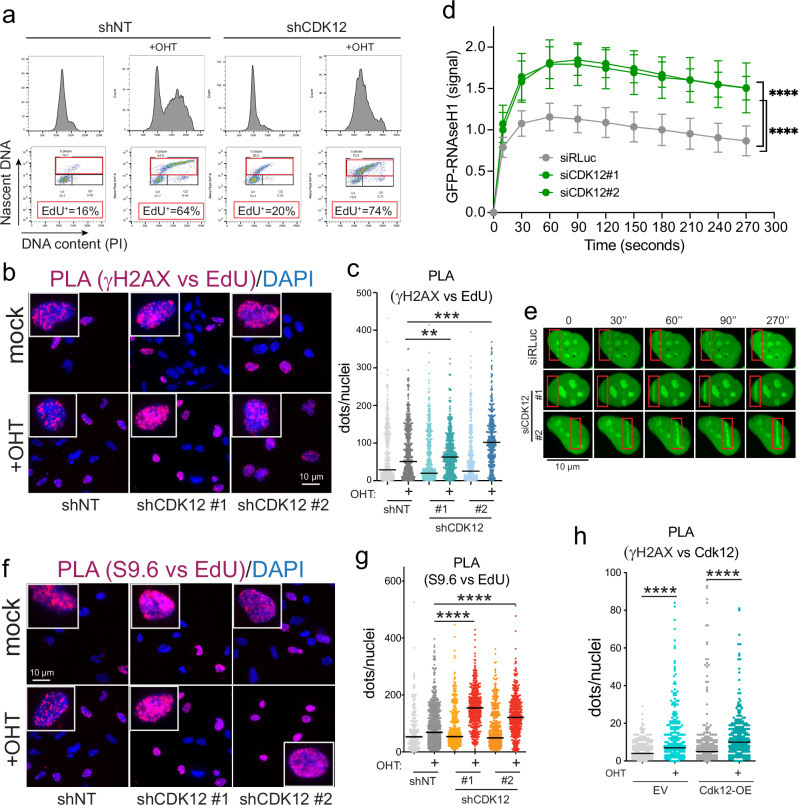
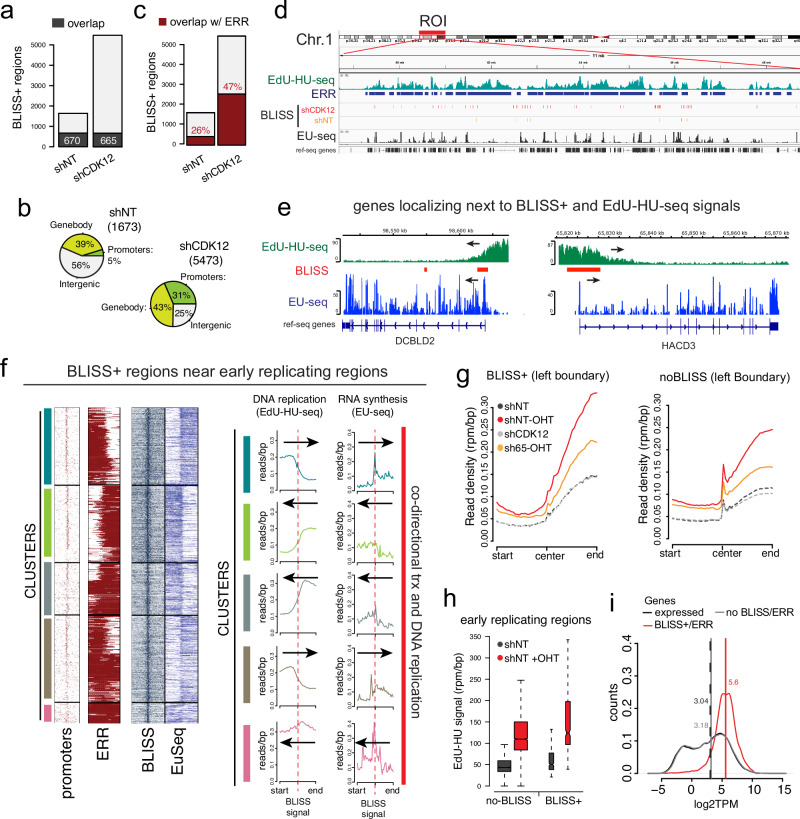
The identification of genes involved in replicative stress is key to understanding cancer evolution and to identify therapeutic targets. Here, we show that CDK12 prevents transcription-replication conflicts (TRCs) and the activation of cytotoxic replicative stress upon deregulation of the MYC oncogene. CDK12 was recruited at damaged genes by PARP-dependent DDR-signaling and elongation-competent RNAPII, to repress transcription. Either loss or chemical inhibition of CDK12 led to DDR-resistant transcription of damaged genes. Loss of CDK12 exacerbated TRCs in MYC-overexpressing cells and led to the accumulation of double-strand DNA breaks, occurring between co-directional early-replicating regions and transcribed genes. Overall, our data demonstrate that CDK12 protects genome integrity by repressing transcription of damaged genes, which is required for proper resolution of DSBs at oncogene-induced TRCs. This provides a rationale that explains both how CDK12 deficiency can promote tandem duplications of early-replicated regions during tumor evolution, and how CDK12 targeting can exacerbate replicative-stress in tumors.


Conflict of interest statement

S.C. and L.C. declare a patent application (IT102021000017414, PCT/IB2022/056112, grant date 03/08/2023). The remaining Authors declare no competing interests.

Figures

Fig. 1
Fig. 1. CDK12 is synthetic lethal with Myc activation.
a Dot plot of the normalized differential DDR score (y axis, Z-score for DDR) and the normalized differential viability (x axis, Z-score for viability) for each siRNA of the library targeting druggable genes (primary screen). A positive Z-score for DDR indicates higher DDR upon MycER activation compared to mock activated U2OS-MycER cells, while a negative viability Z-score indicates a reduction of viability compared to mock activated cells. Dashed lines indicate thresholds used to call the DDR and viability hits. b Venn diagram of all the hits identified in the two primary screens as DDR- and viability-hits. c Metascape enrichment network of the hits of the two primary screens (DDR and druggable genes). d Cell death in U2OS-MycER cells upon MycER activation (+OHT, 400 nM) and CDK12 knockdown by the indicated shRNAs. e, f WB analysis of DDR markers in U2OS-MycER cells upon MycER activation (+OHT, 400 nM) and (e) CDK12 knockdown or (f) CDK12 inhibition by THZ531. g WB analysis of DDR markers following treatment of multiple myeloma (KMS-11, OPM1) and Burkitt’s lymphoma (Raji, BL28) cell lines with THZ531 for 48 hours. Vinculin (VCL) was used as loading control. Lanes 1, 2, and 3 show independent replicates.
Fig. 2
Fig. 2. CDK12 silencing or inhibition rescues transcription at DNA-damaged genes.
a, b Bee swarm plots of single-cell nascent-RNA synthesis (by EU incorporation) in mock or UV-irradiated cells. Cells were pulsed with 0.5 M EU for 20 min. before collection. a U2OS cells: siLuc n = 1965 cells; siCDK12#1: n = 2320 cells; siCDK12#2: n = 3446 cells; siLc+UV: n = 2363 cells; siCDK12#1 + UV: n = 5003 cells; siCDK12#2 + UV: n = 2806 cells. b RPE1 cells: siLuc n = 4100 cells; siCDK12#1 n = 4090 cells; siCDK12#2: n = 4482 cells; siLc+UV: n = 5503 cells; siCDK12#1 + UV: n = 2897 cells; siCDK12#2 + UV: n = 4057 cells. ****: P value < 0.0001 (Kruskal Wallis test with multiple comparisons). c WB analysis. VCL is a loading control. d, e Representative IF-images (d) and bar plot (e) of the colocalization of mCherry-tTA-ER and YFP-MS2 signals upon silencing of CDK12 in U2OS-TRE-I-SceI-19 cells. Where indicated, cells were transfected with I-SceI (+SceI) to induce DSBs on the TRE-MS2 reporter. Average of two independent experiments. siRLuc: n = 58 cells, n = 109 cells; siCDK12#1: n = 97 cells, n = 117 cells; siCDK12#2: n = 48 cells, n = 94 cells; siRLuc+SceI: n = 64 cells, n = 109 cells; siCDK12#1+SceI: n = 70 cells, n = 102 cells; siCDK12#2+SceI: n = 67 cells, n = 76 cells. The error bar is the standard deviation. f, g As in d, e, but upon inhibition of CDK12. Average of two independent experiments. DMSO: n = 159 cells, n = 124 cells; THZ531: n = 123 cells, n = 93 cells; DMSO+SceI: n = 113 cells, n = 87 cells; THZ531+SceI: n = 111 cells, n = 96 cells. The error bar is the standard deviation. Source data are provided as a Source Data file.
Fig. 3
Fig. 3. CDK12 is recruited on DNA damaged sites proximal to transcribed genes.
a, b Analysis of proximity of CDK12 and γH2AX foci by PLA in U2OS cells upon CDK12 silencing (shCDK12) or mock (shNT, non-targeting). a Representative pictures of mock silenced cells (shNT). shNT: mock n = 284 cells; 30’ n = 317 cells; 4 h n = 301 cells. shCDK12: mock n = 283 cells; 30’ n = 303 cells; 4 h n = 310 cells. b Box plot of PLA signals (nuclear dots) at different times post-irradiation (10 Gy). The box extends from the 25th to 75th percentiles, the error bar indicates minimum and maximum. P values calculated by Mann-Whitney test. c Kinetics of recruitment of mCherry-CDK12 to laser-damaged sites in U2OS cells treated or not with 100 µM DRB or 1 µM triptolide (TPL). Left, representative pictures; the red boxes highlight the irradiated areas. Right, the time-series plot shows the average and the standard deviation. DMSO: n = 5 cells; DRB: n = 13 cells; TPL: n = 12 cells. ****: P-value < 0.0001 (Two way anova with sidak’s multiple comparisons test). d Colocalization of mCherry-CDK12 and γH2AX foci at SceI-induced DSBs in U2OS-TRE-I-SceI-19 cells treated or not with 100 µM DRB or 1 µM triptolide (TPL). Left, pictures of mCherry-CDK12 and γH2AX signals. Right, box plots of two independent experiments. MOCK n = 43 cells, n = 60 cells; DRB n = 52 cells, n = 61 cells; TPL n = 50 cells, n = 57 cells. e, f IF analysis of locus specific double strand breaks induced by CRISPR/Cas9 editing at select loci. The error bar is the standard deviation. e Representative images. f Bar plot reporting the average colocalization of CDK12 and γH2AX foci in DRB treated cells (average of two experiments). DMSO POLR1B −1kb: n = 28 cells, n = 31 cells; DRB POLR1B −1kb: n = 37 cells, n = 26 cells; DMSO POLR1B −2kb: n = 23 cells, n = 32 cells; DRB POLR1B: −2kb n = 29 cells, n = 30 cells; DMSO IFRD2: −1kb n = 27 cells, n = 29 cells; DRB IFRD2 −1kb: n = 28 cells, n = 25 cells; DMSO IFRD2 −2kb: n = 23 cells, n = 25 cells; DRB IFRD2 −2kb: n = 12 cells, n = 27 cells; DMSO MCM2 −1kb: n = 24 cells, n = 35 cells; DRB MCM2 −1kb: n = 21 cells, n = 28 cells; DMSO MCM2 −2kb: n = 23 cells, n = 27 cells; DRB MCM2 −2kb: n = 18 cells, n = 30 cells; DMSO DISTAL#1: n = 19 cells, n = 30 cells; DRB DISTAL#1: n = 23 cells, n = 24 cells. The error bar is the standard deviation. Source data are provided as a Source Data file.
Fig. 4
Fig. 4. PARP-dependent DDR-signaling is necessary for CDK12 recruitment to DNA-damaged sites.
a, b Recruitment of mCherry-CDK12 to laser-damaged sites in U2OS cells treated with ATMi (10 µM KU-5593) or ATRi (10 µM VE-821). a Irradiated areas are highlighted by a white frame. DMSO: n = 14 cells; ATMi: n = 17 cells; ATRi: n = 13 cells. The graph shows the average and the standard deviation. c Recruitment of mCherry-CDK12 to laser-damaged sites in H2AX knock-out cells. U2OS wt: n = 18 cells; U2OS KO: n = 26 cells. The graph shows the average and the standard deviation. d, e Recruitment of mCherry-CDK12 to laser-damaged sites in U2OS cells treated with 1 µM olaparib or 10 µM veliparib. d Irradiated areas are highlighted by a red frame. DMSO: n = 6 cells; veliparib: n = 27 cells; olaparib: n = 25 cells. The graph shows the average and the standard deviation. ****: P value < 0.0001 (Two way anova with sidak’s multiple comparisons test). f Nascent RNA analysis at the DNA-damaged TRE-MS2 reporter locus of U2OS-TRE-I-SceI-19 cells treated with the indicated compounds. DMSO: n = 124 cells, n = 130 cells; THZ531: 4 h n = 144 cells, n = 130 cells; THZ531: 24 h n = 150 cells, n = 146 cells; ATMi: 24 n = 132 cells, n = 115 cells; ATMi 4 h + THZ531: 24 h n = 129 cells, n = 101 cells; PARPi: n = 146 cells, n = 167 cells; PARPi 4 h + THZ531: 24 h n = 126 cells, n = 154 cells. The graph shows the average and the standard deviation. Source data are provided as a Source Data file.
Fig. 5
Fig. 5. CDK12 is recruited by SPT5 to prevent CDK9 loading to DNA-damaged sites.
a Silencing of CDK12 allows the recruitment of EGFP-CDK9 to laser-damaged DNA. siRLuc: n = 23 cells; siCDK12#1: n = 21 cells. The time-series graph shows the average and the standard deviation.****: P value < 0.0001 (Two way anova with sidak’s multiple comparisons test). b, c Colocalization of mCherry-tTA-ER and EGFP-CDK9 at the promoter of the MS2 reporter in U2OS-TRE-I-SceI-19 cells, at either un-damaged promoters (mock) or I-SceI cut promoters (+SceI). Loss of CDK12 expression enhances localization of CDK9 at the DNA damaged reporter. b Quantification of two independent experiments. siRLuc: n = 70 cells, n = 150 cells; siCDK12#1: n = 83 cells, n = 122 cells; siCDK12#2: n = 67 cells, n = 122 cells; siRLuc+SceI: n = 136 cells, n = 166 cells; siCDK12#1+SceI: n = 90 cells, n = 107 cells; siCDK12#2+SceI: n = 103 cells, n = 148 cells. The graph shows the average and the standard deviation. d Recruitment of mCherry-CDK12 at laser-damaged DNA in NELFc silenced. Silencing the NELF complex (NELFc) does not affect CDK12 recruitment to laser-damaged DNA. siRLuc: n = 13 cells; siNELF complex: n = 18 cells. The graph shows the average and the standard deviation. e NELF-E recruitment at laser-damaged DNA in CDK12 silenced cells. siRLuc: n = 7 cells; siCDK12#1: n = 10 cells; siCDK12#2: n = 18 cells. The graph shows the average and the standard deviation. f Recruitment of mCherry-CDK12 at laser-damaged DNA in SPT5 silenced cells. siSPT5 prevents the recruitment of CDK12 to laser-damaged loci. siRLuc: n = 18 cells; siSPT5#1: n = 21 cells; siSPT5#2: n = 19 cells. The graph shows the average and the standard deviation. ****: P value < 0.0001 (Two way anova with sidak’s multiple comparisons test). g, h Loss of mCherry-CDK12 localization at the I-SceI cut reporter locus of U2OS-TRE-I-SceI-19 cells, following SPT5 silencing. g Representative images. h Bar plot of the fraction of cells showing colocalization of mCherry-CDK12 and γH2AX. siRLuc: n = 123 cells, n = 135 cells; siSPT5#1: n = 126 cells, n = 136 cells; siSPT5#2: n = 118 cells, n = 119 cells. The graph shows the average and the standard deviation. Source data are provided as a Source Data file.
Fig. 6
Fig. 6. Loss of CDK12 enhances MYC-induced replicative stress.
a Cell cycle entry (12 hours post-mitotic release) of U2OS-MycER cells analyzed by FACS. b, c PLA to evaluate proximity of γH2AX and nascent DNA (EdU-labeled) upon MycER activation (+OHT) and CDK12 silencing. b Representative images. c Bee swarm plot. shNT: n = 437 cells (mock), n = 597 cells (+OHT), shCdk12#1: n = 617 cells (mock), n = 567 cells (+OHT), shCDK12#2: n = 438 cells (mock), n = 438 cells (+OHT). **: P value < 0.01, ***: P-value < 0.001(Kruskal Wallis test with multiple comparisons). d, e Live microscopy analysis of RNAseH1 recruitment to micro-irradiated DNA in U2OS cells silenced for CDK12. d Time-series graph shows the average and the standard deviation. ****: P value < 0.0001 (Two way anova with sidak’s multiple comparisons test). siRLuc n = 10 cells; siCDK12#1 n = 12 cells; siCDK12#2 n = 12 cells. e Representative images. f, g PLA to evaluate the proximity of RNA-DNA hybrids, stained with the S9.6 antibody and nascent DNA (EdU labeled). f Representative images (g) bee swarm plot. shNT: n = 211 cells (mock), 640 cells (+OHT), shCdk12#1: n = 404 cells (mock), n = 445 cells (+OHT), shCDK12#2: n = 538 cells (mock), n = 429 cells (+OHT). ****: P-value < 0.0001 (Kruskal Wallis test with multiple comparisons). h Bee swarm plot of PLA of CDK12 and γH2AX in U2OS-MycER cells. Where indicated (Cdk12-OE), cells were transfected with a plasmid encoding CDK12. EV: n = 534 cells (mock), n = 326 cells (+OHT), Cdk12-OE: n = 410 cells (mock), n = 333 cells (+OHT). ****: P-value < 0.0001 (Kruskal Wallis test with multiple comparisons). Source data are provided as a Source Data file.
Fig. 7
Fig. 7. Genome-wide mapping of transcription replication conflicts.
a BLISS+ regions identified upon MycER activation and CDK12 (shCDK12) or mock silencing (shNT). In dark gray is the fraction of BLISS+ regions identified in both the shNT and shCDK12 datasets. b Pie charts of the genomic distribution of BLISS+ regions. c Bar plot of the BLISS+ regions identified upon MycER activation and the fraction of BLISS+ regions overlapping with early replicating regions (ERR, indicated in brown). d Genome browser snapshot of the indicated chromosome 1 region (ROI) showing ERR, EdU-HU-seq and EU-seq signals (for MycER activated, shCDK12 cells), and BLISS+ regions (MycER activated cells). e Genome browser snapshots of representative genes identified next to a BLISS+ region and a ERR. Arrows indicate the direction of DNA replication (EdU-HU-seq) and transcription (EU-seq). f Left, clustered heatmaps of BLISS+ regions overlapping with ERR. Heatmaps show promoter position along with EdU-HU-seq (DNA replication), BLISS+ regions (DSBs) and EU-seq signals of 10 kb genomic ranges centered on the BLISS signal. The red bar highlights the clusters showing co-directional transcription and DNA synthesis. Right, signal distribution profiles of the regions of each cluster. Arrows indicate the direction of DNA synthesis (assessed by EdU-HU seq) and RNA synthesis (by EU-seq). g EdU-HU-seq signal profiles of the left boundary of ERRs overlapping with a BLISS+ region (left) or ERRs not overlapping with a BLISS+ region (right). h Box plot of the EdU-HU-seq signal shown in (g). No BLISS = 3236 regions; BLISS + = 398 regions. The box plot displays 95% of the distribution with the median, error bar indicates the minimum and maximum value. i RNA synthesis (EU-signal distribution) of genes next to ERR adjacent to BLISS+ regions (red line), all the expressed genes (black line) or the expressed genes adjacent to an ERR not associated to a BLISS+ region (gray line). Vertical bars indicate the median. Source data are provided as a Source Data file.

References

    1. Macheret, M. & Halazonetis, T. D. DNA replication stress as a hallmark of cancer. Annu Rev. Pathol.10, 425–448 (2015). 10.1146/annurev-pathol-012414-040424 - DOI - PubMed
    1. Burrell, R. A. et al. Replication stress links structural and numerical cancer chromosomal instability. Nature494, 492–496 (2013). 10.1038/nature11935 - DOI - PMC - PubMed
    1. Gaillard, H., Garcia-Muse, T. & Aguilera, A. Replication stress and cancer. Nat. Rev. Cancer15, 276–289 (2015). 10.1038/nrc3916 - DOI - PubMed
    1. Wilhelm, T., Said, M. & Naim, V. DNA Replication Stress and Chromosomal Instability: Dangerous Liaisons. Genes (Basel)11, 642 (2020). 10.3390/genes11060642 - DOI - PMC - PubMed
    1. Bowry, A., Kelly, R. D. W. & Petermann, E. Hypertranscription and replication stress in cancer. Trends Cancer7, 863–877 (2021). 10.1016/j.trecan.2021.04.006 - DOI - PubMed

MeSH terms