. 2024;44(11):455-472.
doi: 10.1080/10985549.2024.2387720. Epub 2024 Aug 18.

Control of Intestinal Stemness and Cell Lineage by Histone Variant H2A.Z Isoforms

Affiliations

Control of Intestinal Stemness and Cell Lineage by Histone Variant H2A.Z Isoforms

Jérémie Rispal et al. Mol Cell Biol. 2024.

Abstract

The histone variant H2A.Z plays important functions in the regulation of gene expression. In mammals, it is encoded by two genes, giving rise to two highly related isoforms named H2A.Z.1 and H2A.Z.2, which can have similar or antagonistic functions depending on the promoter. Knowledge of the physiopathological consequences of such functions emerges, but how the balance between these isoforms regulates tissue homeostasis is not fully understood. Here, we investigated the relative role of H2A.Z isoforms in intestinal epithelial homeostasis. Through genome-wide analysis of H2A.Z genomic localization in differentiating Caco-2 cells, we uncovered an enrichment of H2A.Z isoforms on the bodies of genes which are induced during enterocyte differentiation, stressing the potential importance of H2A.Z isoforms dynamics in this process. Through a combination of in vitro and in vivo experiments, we further demonstrated the two isoforms cooperate for stem and progenitor cells proliferation, as well as for secretory lineage differentiation. However, we found that they antagonistically regulate enterocyte differentiation, with H2A.Z.1 preventing terminal differentiation and H2A.Z.2 favoring it. Altogether, these data indicate that H2A.Z isoforms are critical regulators of intestine homeostasis and may provide a paradigm of how the balance between two isoforms of the same chromatin structural protein can control physiopathological processes.

Keywords: H2A.Z histone variant; differentiation; gene expression; intestinal epithelial homeostasis; proliferation.


Conflict of interest statement

There are no relevant financial or non-financial competing interests to report.

Figures
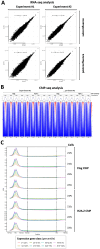
Figure 1.
Figure 1.
Validation of CRISPR-flagged Caco-2/15 cell lines cells and correlation between isoform recruitment and gene expression. (A) mRNA from subconfluent or 7-days postconfluent Z1-Flag or Z2-Flag Caco-2/15 cells were subjected to RNA-seq analysis and a DESEQ2 standardization was done. Correlations of RPKM counts between cell lines, either at subconfluent (upper panels) or postconfluent (lower panels) stages, in two RNA-seq experiments (left and right) are shown. Spearman’s correlation was done and indicated on graphs. (B) heatmaps for Transcription Start Site regions (−2kb to +2kb from the TSS) representing the enrichment in H2A.Z.1-Flag, H2A.Z.2-Flag or total H2A.Z for subconfluent (Sc) or postconfluent (Pc) Caco-2/15 cells with Flag-tagged H2A.Z.1 (Z1) or H2A.Z.2 (Z2), as indicated. Data from two ChIP-seq experiments have been analyzed and an heatmap classifying genes by the intensity of total H2A.Z signal around TSS is shown. The corresponding meta-profile of the analyzed TSS region is also presented above each heatmap. (C) Enrichment in H2A.Z.1-Flag, H2A.Z2-Flag or total H2A.Z all along genes depending on their expression levels. Genes were dispatched in eight classes of equal size and the average meta-profile of ChIP-seq data (from subconfluent (Sc) or postconfluent (Pc) genome-edited Caco-2/15 cells, as indicated) is shown for each class.
Figure 2.
Figure 2.
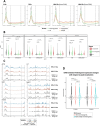
H2A.Z isoforms enrichment in gene bodies is higher on genes activated during differentiation. (A) Meta-profiles of H2A.Z.1, H2A.Z.2 or total H2A.Z ChIP-Seq signals on the most regulated genes during differentiation of subconfluent genome-edited Caco-2/15 cells. The 500 most activated genes during differentiation (TOP500 upregulated) and the 500 most repressed genes (TOP500 downregulated) were identified from RNA-seq data obtained in both subconfluent and 7 days postconfluent cells. Meta-profiles for these genes populations as well as for all genes (black) as a control are shown. (B) The mean signal around TSS and on gene body was calculated for each individual gene. Violin plots showing these values for TOP500 upregulated, downregulated or all gene populations are drawn. Wilcoxon tests using BH correction were applied and P values are indicated on the graphs. (C) Individual profiles of H2A.Z isoforms or total H2A.Z ChIP-Seq on the indicated housekeeping (left panels) and enterocyte-specific (right panels) genes. One replicate in shown for each ChIP-seq, the second one is shown in Supplementary material Figure 3F. (D) Impact of peaks abundance on TSS or Gene Body on gene expression during differentiation. Violin box plots represent the genome-wide mean for gene expression, in subconfluent flag-tagged cells, of all genes or genes enriched in peaks within their TSS or their Gene Body. Wilcoxon tests using BH correction were applied and results are indicated on the graphs.
Figure 3.
Figure 3.
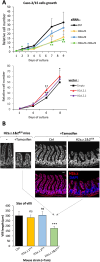
Essential redundant role of H2A.Z isoforms in intestinal epithelial renewal. (A) Cell growth assay were performed using Caco-2/15 cells transfected with indicated siRNA (upper panel) or expression vector (lower panel). Cell number was assessed at different times after transfection as indicated, and the mean and standard deviation from five independent experiments are represented. Statistical analysis was done using the Student’s t test (*< 0.05; **< 0.02). (B) Representative H2A.Z immunohistofluorescence (lower right panels, in red) of jejunal sections in control or double mutant H2a.z.1&2fl/fl mice, 10 days after the recombination induced by tamoxifen treatment. Nuclei are stained with DAPI (gray in upper panels or blue in lower panels). Scale bar represent 50 µm. Left panels are from H2a.z.1&2fl/fl mice with or without tamoxifen treatment. Nuclei are stained with DAPI (in gray). The graph represents measurements of the size of about 100 villi for each mouse. Genotypes of mice are stated below the diagram. Statistical analysis was done using the Student’s t test (***< 0.01).
Figure 4.
Figure 4.
H2A.Z isoforms are essential for proliferation and stemness. (A) Representative Ki67 immunohistofluorescence on jejunal sections of control or H2a.z.1&2fl/fl mice, 10 days after starting tamoxifen treatment. Nuclei are stained with DAPI in blue. Arrows indicate Ki67 negative cells in the crypt. Quantification of positive cell number was performed on at least 20 crypt-villus axis per genotype. Statistical analysis was done using the Student’s t test (**<0.02). (B) Same as in A for Olfm4 staining. Quantification was done by measuring global signal intensity from at least 20 crypt-villus axis per genotype. (C) Same as in A for Muc2 (in red) and sucrase-isomaltase (in green) staining. (D) Same as in A for Lys immunostaining. E: RT-qPCR on samples from H2a.z.1&2fl/fl organoids treated with (+) or without (−) Tat-CRE. The mean and standard deviation from five independent experiments is shown. Statistical analysis was done using the one-way Student’s t test of treated organoids compared to untreated are stated in the graphic (*< 0.05; **< 0.02).
Figure 5.
Figure 5.
Antagonistic control of enterocytes differentiation by H2A.Z.1 and H2A.Z.2. (A) Representative sucrase-isomaltase (SI) immunohistofluorescence of jejunal sections in mice from the indicated genotypes, 10 days after starting tamoxifen treatment. Nuclei are stained with DAPI in blue. Quantification was done by measuring global signal intensity from at least 20 crypt-villus axis per genotype. Statistical analysis was done using Student’s t test relative to wild-type (wt) condition and indicated in the graphic (**P < 0.02). The one-way Student’s t test P values for double KO tissues compared to H2A.Z.1-deficient ones are also indicated in the graph. (B) mRNA expression of SI and lactase (LPH) in Caco-2/15 cells, 3 days after the transfection of siRNA directed against H2A.Z.1, H2A.Z.2 or both. The mean and standard deviation from five independent experiments is represented. Statistical analysis was done using Student’s t test relative to control siRNA (Ctrl) condition and indicated in the graphic (P value: *< 0.05; **< 0.02). The one-way Student’s t test P values for double siRNA-transfected cells compared to H2A.Z.1-tagetting one are also indicated in the graph. (C) Firefly luciferase assays 2 days after transfection of H2A.Z.1 or H2A.Z.2-expressing vectors. Results were calculated relative to measurements of Renilla luciferase constitutively expressed from a normalizing cotransfected vector. The mean and standard deviation from three independent experiments is represented. Statistical analysis was done using Student’s t test and the P values relative to empty vector condition are indicated in the graphic (**< 0.02). (D) Endogenous SI mRNA expression 7 days after transfection of H2A.Z.1 or H2A.Z.2 -expressing vector. Total mRNA was extracted, reverse-transcribed and cDNA were analyzed by RT-qPCR. The mean and standard deviation from four independent experiments is represented. Statistical analysis was done using Student’s t test and the P values relative to empty vector condition are indicated in the graphic (**< 0.02).
Figure 6.
Figure 6.
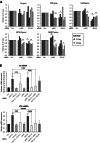
Modulating H2A.Z-related enterocyte differentiation by SRCAP and p400. (A) Incorporation of H2A.Z isoforms upon siRNA-mediated knockdown of p400 or SRCAP. Caco-2/15 cells genetically edited to express Flag-tagged H2A.Z isoforms were transfected with the indicated siRNA. 72 h later, chromatin immunoprecipitation was performed using anti-Flag antibody to assess enrichment of H2A.Z.1-Flag or H2A.Z.2-Flag. The amount of indicated promoters were then analyzed by qPCR and calculated relative to 1 for the control siRNA. Three independent experiments are shown. Statistical analysis was done using Student’s t test and the P values relative to control siRNA condition are indicated in the graphic (*< 0.05; **< 0.02). (B) SI and LPH mRNA expression in Caco-2/15 cells transfected with the various combinations of siRNAs, as indicated below the graphs. The mean and standard deviation from five independent experiments is represented. Statistical analysis was done using the Student’s t test. P values are indicated relative to control siRNA condition (*< 0.05; **< 0.02) or between other relevant conditions (numeric values).
Figure 7.
Figure 7.
The ratio between H2A.Z isoforms correlates with intestinal differentiation. (A) Caco-2/15 were induced to confluence and harvested at the indicated time. Enterocyte-differentiation markers and H2A.Z isoforms mRNAs were quantified. The H2A.Z.2/H2A.Z.1 mRNAs ratio is also shown. The mean and standard deviation from three independent experiments is shown. Statistical analysis was done using the Student’s t test vs day 2 and P values are indicated when < 0.1. (B) Expression of differentiation markers in isolated crypts or villi of wild-type mice. After epithelium fractionation as described in the Methods section, mRNA was extracted and expression of differentiation markers was analyzed by RT-qPCR. The mean and standard deviation from four mice is shown. Statistical analysis was done using the paired Student’s t test vs Crypts. (C) As in B, except that the expression of crypt/stem cell markers was analyzed. (D) As in B, except that the expression of H2.A.Z isoforms was assessed. The H2A.Z.2/H2A.Z.1 mRNAs ratio is also shown. (E) Model of control of intestinal epithelial homeostasis by H2A.Z isoform dynamic. In the crypt, the high quantity of total H2A.Z is essential for maintaining the undifferentiated state of cells by facilitating proliferation and maintaining stemness, and by inhibiting the differentiation. During the migration of cells along the villus, the decrease of H2A.Z coupled to the increase of H2A.Z.2/H2A.Z.1 ratio allows differentiation and favors the absorptive lineage.

References

    1. Rispal J, Escaffit F, Trouche D.. Chromatin dynamics in intestinal epithelial homeostasis: a paradigm of cell fate determination versus cell plasticity. Stem Cell Rev Rep. 2020;16:1062–1080. doi:10.1007/s12015-020-10055-0. - DOI - PMC - PubMed
    1. Long H, Zhang L, Lv M, Wen Z, Zhang W, Chen X, Zhang P, Li T, Chang L, Jin C, et al. . H2A.Z facilitates licensing and activation of early replication origins. Nature. 2020;577:576–581. doi:10.1038/s41586-019-1877-9. - DOI - PubMed
    1. Tong M, Lee K, Ezer D, Cortijo S, Jung J, Charoensawan V, Box MS, Jaeger KE, Takahashi N, Mas P, et al. . The evening complex establishes repressive chromatin domains via H2A.Z deposition. Plant Physiol. 2020;182:612–625. doi:10.1104/pp.19.00881. - DOI - PMC - PubMed
    1. Rispal J, Baron L, Beaulieu JF, Chevillard-Briet M, Trouche D, Escaffit F.. The H2A.Z histone variant integrates wnt signaling in intestinal epithelial homeostasis. Nat Commun. 2019;10:1827. doi:10.1038/s41467-019-09899-z. - DOI - PMC - PubMed
    1. Zhao B, Chen Y, Jiang N, Yang L, Sun S, Zhang Y, Wen Z, Ray L, Liu H, Hou G, et al. . Znhit1 controls intestinal stem cell maintenance by regulating H2A.Z incorporation. Nat Commun. 2019;10:1071. doi:10.1038/s41467-019-09060-w. - DOI - PMC - PubMed

Publication types