Multicenter Study
. 2025 Mar;27(3):527-536.
doi: 10.1002/ejhf.3424. Epub 2024 Aug 18.

Anthropometric measures and long-term mortality in non-ischaemic heart failure with reduced ejection fraction: Questioning the obesity paradox

Affiliations
Multicenter Study

Anthropometric measures and long-term mortality in non-ischaemic heart failure with reduced ejection fraction: Questioning the obesity paradox

Jawad H Butt et al. Eur J Heart Fail. 2025 Mar.

Abstract

Aims: Although body mass index (BMI) is the most commonly used anthropometric measure to assess adiposity, alternative indices such as the waist-to-height ratio may better reflect the location and amount of ectopic fat as well as the weight of the skeleton.

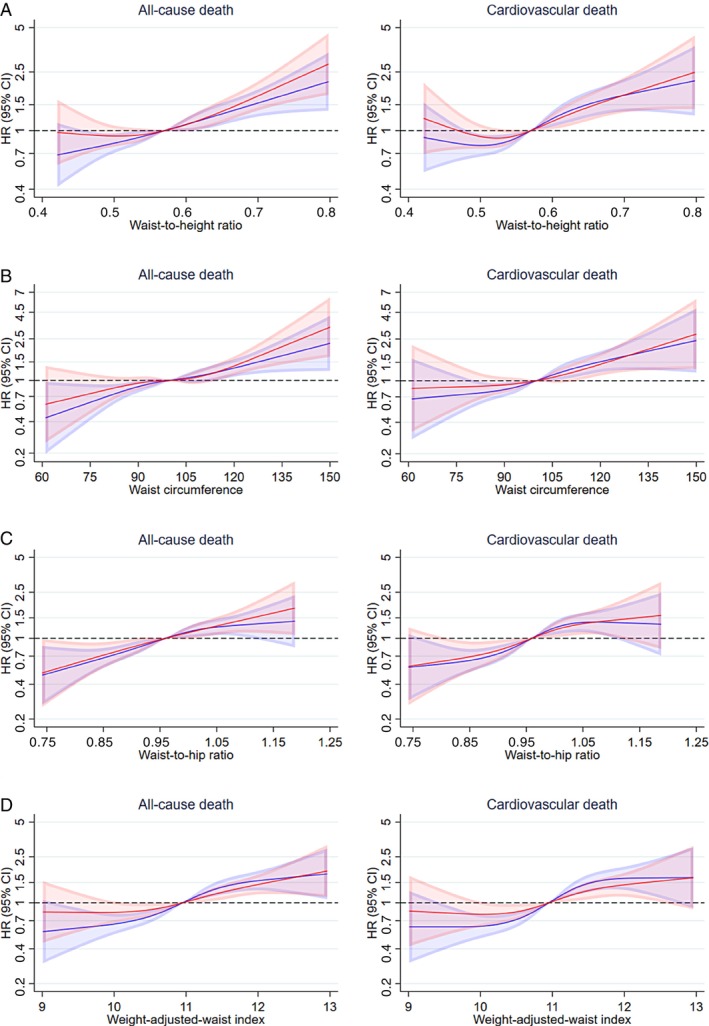
Methods and results: The prognostic value of several alternative anthropometric measures was compared with that of BMI in 1116 patients with non-ischaemic heart failure with reduced ejection fraction (HFrEF) enrolled in DANISH. The association between anthropometric measures and all-cause death was adjusted for prognostic variables, including natriuretic peptides. Median follow-up was 9.5 years (25th-75th percentile, 7.9-10.9). Compared to patients with a BMI 18.5-24.9 kg/m2 (n = 363), those with a BMI ≥25 kg/m2 had a higher risk of all-cause and cardiovascular death, although this association was only statistically significant for a BMI ≥35 kg/m2 (n = 91) (all-cause death: hazard ratio [HR] 1.78, 95% confidence interval [CI] 1.28-2.48; cardiovascular death: HR 2.46, 95% CI 1.69-3.58). Compared to a BMI 18.5-24.9 kg/m2, a BMI <18.5 kg/m2 (n = 24) was associated with a numerically, but not a significantly, higher risk of all-cause and cardiovascular death. Greater waist-to-height ratio (as an exemplar of indices not incorporating weight) was also associated with a higher risk of all-cause and cardiovascular death (HR for the highest vs. the lowest quintile: all-cause death: HR 2.11, 95% CI 1.53-2.92; cardiovascular death: HR 2.17, 95% CI 1.49-3.15).

Conclusion: In patients with non-ischaemic HFrEF, there was a clear association between greater adiposity and higher long-term mortality.

Clinical trial registration: ClinicalTrials.gov NCT00542945.

Keywords: Anthropometric measures; Body mass index; Clinical trial; Heart failure with reduced ejection fraction.


Figures

Figure 1
Figure 1
Outcomes according to body mass index. This figure shows the risk of all‐cause and cardiovascular death according to continuous body mass index. The solid line represents the hazard ratio (HR) and the shaded area the 95% confidence interval (CI). The reference is a body mass index of 25 kg/m2. The blue spline is adjusted for randomization. The red spline is adjusted for randomization, age, sex, cardiac resynchronization therapy (pre‐existing or planned), trial centre, systolic blood pressure, heart rate, estimated glomerular filtration rate, left ventricular ejection fraction, log of N‐terminal pro‐B‐type natriuretic peptide, New York Heart Association functional class, duration of heart failure, a history of diabetes, and atrial fibrillation.
Figure 2
Figure 2
(A) Outcomes according to waist‐to‐height ratio. This figure shows the risk of all‐cause and cardiovascular death according to continuous waist‐to‐height ratio. The solid line represents the hazard ratio (HR) and the shaded area the 95% confidence interval (CI). The reference is the median waist‐to‐height ratio. The blue spline is adjusted for randomization. The red spline is adjusted for randomization, age, sex, cardiac resynchronization therapy (pre‐existing or planned), trial centre, systolic blood pressure, heart rate, estimated glomerular filtration rate, left ventricular ejection fraction, log of N‐terminal pro‐B‐type natriuretic peptide, New York Heart Association functional class, duration of heart failure, a history of diabetes, and atrial fibrillation. (B) Outcomes according to waist circumference. This figure shows the risk of all‐cause and cardiovascular death according to continuous waist circumference. The solid line represents the HR and the shaded area the 95% CI. The reference is the median waist circumference. The blue spline is adjusted for randomization. The red spline is adjusted for randomization, age, sex, cardiac resynchronization therapy (pre‐existing or planned), trial centre, systolic blood pressure, heart rate, estimated glomerular filtration rate, left ventricular ejection fraction, log of N‐terminal pro‐B‐type natriuretic peptide, New York Heart Association functional class, duration of heart failure, a history of diabetes, and atrial fibrillation. (C) Outcomes according to waist‐to‐hip ratio. This figure shows the risk of all‐cause and cardiovascular death according to continuous waist‐to‐hip ratio. The solid line represents the HR and the shaded area the 95% CI. The reference is the median waist‐to‐hip ratio. The blue spline is adjusted for randomization. The red spline is adjusted for randomization, age, sex, cardiac resynchronization therapy (pre‐existing or planned), trial centre, systolic blood pressure, heart rate, estimated glomerular filtration rate, left ventricular ejection fraction, log of N‐terminal pro‐B‐type natriuretic peptide, New York Heart Association functional class, duration of heart failure, a history of diabetes, and atrial fibrillation. (D) Outcomes according to weight‐adjusted‐waist index. This figure shows the risk of all‐cause and cardiovascular death according to continuous weight‐adjusted‐waist index. The solid line represents the HR and the shaded area the 95% CI. The reference is the median weight‐adjusted‐waist index. The blue spline is adjusted for randomization. The red spline is adjusted for randomization, age, sex, cardiac resynchronization therapy (pre‐existing or planned), trial centre, systolic blood pressure, heart rate, estimated glomerular filtration rate, left ventricular ejection fraction, log of N‐terminal pro‐B‐type natriuretic peptide, New York Heart Association functional class, duration of heart failure, a history of diabetes, and atrial fibrillation.
Figure 3
Figure 3
(A) Outcomes according to relative fat mass. This figure shows the risk of all‐cause and cardiovascular death according to continuous relative fat mass. The solid line represents the hazard ratio (HR) and the shaded area the 95% confidence interval (CI). The reference is the median relative fat mass. The blue spline is adjusted for randomization. The red spline is adjusted for randomization, age, sex, cardiac resynchronization therapy (pre‐existing or planned), trial centre, systolic blood pressure, heart rate, estimated glomerular filtration rate, left ventricular ejection fraction, log of N‐terminal pro‐B‐type natriuretic peptide, New York Heart Association functional class, duration of heart failure, a history of diabetes, and atrial fibrillation. (B) Outcomes according to body roundness index. This figure shows the risk of all‐cause and cardiovascular death according to continuous body roundness index. The solid line represents the HR and the shaded area the 95% CI. The reference is the median body roundness index. The blue spline is adjusted for randomization. The red spline is adjusted for randomization, age, sex, cardiac resynchronization therapy (pre‐existing or planned), trial centre, systolic blood pressure, heart rate, estimated glomerular filtration rate, left ventricular ejection fraction, log of N‐terminal pro‐B‐type natriuretic peptide, New York Heart Association functional class, duration of heart failure, a history of diabetes, and atrial fibrillation. (C) Outcomes according to body shape index. This figure shows the risk of all‐cause and cardiovascular death according to continuous body shape index. The solid line represents the HR and the shaded area the 95% CI. The reference is the median body shape index. The blue spline is adjusted for randomization. The red spline is adjusted for randomization, age, sex, cardiac resynchronization therapy (pre‐existing or planned), trial centre, systolic blood pressure, heart rate, estimated glomerular filtration rate, left ventricular ejection fraction, log of N‐terminal pro‐B‐type natriuretic peptide, New York Heart Association functional class, duration of heart failure, a history of diabetes, and atrial fibrillation.

References

    1. Lopez‐Jimenez F, Almahmeed W, Bays H, Cuevas A, Di Angelantonio E, le Roux CW, et al. Obesity and cardiovascular disease: Mechanistic insights and management strategies. A joint position paper by the World Heart Federation and World Obesity Federation. Eur J Prev Cardiol 2022;29:2218–2237. 10.1093/eurjpc/zwac187 - DOI - PubMed
    1. Powell‐Wiley TM, Poirier P, Burke LE, Després JP, Gordon‐Larsen P, Lavie CJ, et al. Obesity and cardiovascular disease: A scientific statement from the American Heart Association. Circulation 2021;143:e984–e1010. 10.1161/CIR.0000000000000973 - DOI - PMC - PubMed
    1. McDonagh TA, Metra M, Adamo M, Gardner RS, Baumbach A, Böhm M, et al. 2021 ESC Guidelines for the diagnosis and treatment of acute and chronic heart failure: Developed by the Task Force for the diagnosis and treatment of acute and chronic heart failure of the European Society of Cardiology (ESC). With the special contribution of the Heart Failure Association (HFA) of the ESC. Eur J Heart Fail 2022;24:4–131. 10.1002/ejhf.2333 - DOI - PubMed
    1. Heidenreich PA, Bozkurt B, Aguilar D, Allen LA, Byun JJ, Colvin MM, et al. 2022 AHA/ACC/HFSA Guideline for the management of heart failure: A report of the American College of Cardiology/American Heart Association Joint Committee on Clinical Practice Guidelines. Circulation 2022;145:e895–e1032. 10.1161/CIR.0000000000001063 - DOI - PubMed
    1. Horwich TB, Fonarow GC, Clark AL. Obesity and the obesity paradox in heart failure. Prog Cardiovasc Dis 2018;61:151–156. 10.1016/j.pcad.2018.05.005 - DOI - PubMed

Publication types

MeSH terms

Associated data