. 2024 Oct 8;150(15):1199-1210.
doi: 10.1161/CIRCULATIONAHA.123.068111. Epub 2024 Aug 19.

Antisense Oligonucleotide Therapy for Calmodulinopathy

Affiliations

Antisense Oligonucleotide Therapy for Calmodulinopathy

Raul H Bortolin et al. Circulation. .

Abstract

Background: Calmodulinopathies are rare inherited arrhythmia syndromes caused by dominant heterozygous variants in CALM1, CALM2, or CALM3, which each encode the identical CaM (calmodulin) protein. We hypothesized that antisense oligonucleotide (ASO)-mediated depletion of an affected calmodulin gene would ameliorate disease manifestations, whereas the other 2 calmodulin genes would preserve CaM level and function.

Methods: We tested this hypothesis using human induced pluripotent stem cell-derived cardiomyocyte and mouse models of CALM1 pathogenic variants.

Results: Human CALM1F142L/+ induced pluripotent stem cell-derived cardiomyocytes exhibited prolonged action potentials, modeling congenital long QT syndrome. CALM1 knockout or CALM1-depleting ASOs did not alter CaM protein level and normalized repolarization duration of CALM1F142L/+ induced pluripotent stem cell-derived cardiomyocytes. Similarly, an ASO targeting murine Calm1 depleted Calm1 transcript without affecting CaM protein level. This ASO alleviated drug-induced bidirectional ventricular tachycardia in Calm1N98S/+ mice without a deleterious effect on cardiac electrical or contractile function.

Conclusions: These results provide proof of concept that ASOs targeting individual calmodulin genes are potentially effective and safe therapies for calmodulinopathies.

Keywords: antisense oligonucleotide; calcium; long QT syndrome; precision medicine; tachycardia, ventricular.


Conflict of interest statement

A.E.M. and D.K. are employees of Ionis Pharmaceuticals, which provided the ASOs used in this study. The other authors report no conflicts.

Figures

Figure 1.
Figure 1.. Human iPSC-CM models of CALM1F142L/+ and CALM1 inactivation.
A. Overall experimental outline. Sequencing traces from iPSCs. B. Lead II ECG of CALM1F142L/+ proband showing severely prolonged QT interval. C. Level of CALM1/2/3 transcripts, quantified by RTqPCR, normalized to GAPDH, and expressed as percent of non-treated control. D. Level of CaM protein, detected by capillary western. Left, representative data. Right, quantitative analysis. CaM was normalized to GAPDH and expressed relative to WTC. E. Multi-electrode array analysis of iPSC-CM field potential duration. Left, representative traces. Dotted lines indicate field potential duration. Right, quantitative analysis. F. Action potential duration of iPSC-CMs. Left, representative traces, recorded using Fluovolt voltage-sensitive dye. Right, quantitative analysis. G. Calcium transient duration and decay of iPSC-CMs. Left, representative traces, recorded using X-Rhod-1 Ca2+-sensitive dye. Right, quantitative analysis of Ca2+ transient duration at 90% recovery (CaTD90) and decay time. One way ANOVA with Holm-Sidak multiple comparison test: *, P<0.05; **, P<0.01; ***, P<0.001; ****, P<0.0001. ns, P≥0.05. Graphs indicate mean ± SD. For E-G, data were recorded under 1 Hz optical (E) or electrical (F, G) pacing. Panel A was created with Biorender.com. Each data point represents an independent well. Numbers at the bottom of bars indicate sample sizes.
Figure 2.
Figure 2.. Development and characterization of ASOs targeting CALM1.
A. iPSC-CMs were treated with ASOs at the indicated concentrations. CALM1, CALM2, and CALM3 transcript levels were measured by RT-qPCR seven days after 24 hours of ASO exposure. Data were normalized to GAPDH and expressed as a percentage of non-treated control (NT). Two-way ANOVA with Dunnett’s multiple comparison test vs non-treated (NT) control. n=3. B. RNA-seq of E-CALM1F142L/+ iPSC-CMs treated with control ASO or ASO1/3/4. Dotted lines indicate | log2 (FC) | = 1 and Padj = 0.05. CALM1, CALM2, and CALM3 transcripts are labeled and shown in red. n=3 per group. C. Effect of ASOs on calmodulin (CaM) protein in iPSC-CMs. Representative capillary western and quantification of relative CaM protein compared to WTC iPSC-CMs. WTC and NT data are the same as in Fig. 1D. One-way ANOVA with Holm-Sidak multiple comparison test. D. Effect of ASOs on cell viability, as assessed by cellular ATP levels. Two-way ANOVA with Dunnett’s multiple comparison test vs non-treated (NT) control. n=3. ns, P ≥ 0.05, *, P<0.05; **, P<0.01; ****, P<0.0001. Graphs indicate mean ± SD. ASO-C indicates the control ASO. Each data point represents an independent well. Numbers at the bottom of bars indicate sample sizes.
Fig. 3.
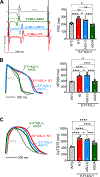
Fig. 3.. Effect of ASOs on iPSC-CM action potential and Ca2+ transient duration.
iPSC-CMs treated with 5 μM ASO. Data were recorded with 1 Hz optical (A) or electrical (B, C) pacing. Left, representative data. Right, quantitative analysis. A. Field potential duration, measured by multi-electrode array. B. Action potential duration at 90% recovery (APD90) was measured by optical imaging of cells loaded with Fluovolt. C. Ca2+ transient duration at 75% recovery (CaTD75) was measured by optical imaging of cells loaded with X-Rhod-1. One way ANOVA with Holm-Sidak multiple comparison test: *, P<0.05; **, P<0.01; ***, P<0.001; ****, P<0.0001. ns, P ≥ 0.05. Graphs indicate mean ± SD. WTC and NT data are the same as in Fig. 1E–G. Each data point represents an independent well. Numbers at the bottom of bars indicate sample sizes.
Fig. 4.
Fig. 4.. Efficacy of ASO treatment of Calm1N98S/+ mice.
A. Experimental outline. Mice were treated with Calm1-targeting ASO (50 mg/kg per dose) or vehicle (PBS) for 1 month. B. Calmodulin transcript levels in cardiac tissue after one month of therapy. Transcripts were measured by RT-qPCR, normalized to Gapdh, and expressed as percent of vehicle treatment. Unpaired t-test. Data shown as mean ± sd. C. Representative ECG traces from female Calm1N98S/+ mice treated with EpiCaf, before (Baseline) and after ASO therapy. Littermate control (Calm1+/+) mice are shown for comparison. D. Quantification of sustained bidirectional VT in Calm1N98S/+ mice before and after ASO therapy. E-F. Effect of ASO treatment on cardiac fractional shortening (FS) and heart rate, as measured by echocardiography on conscious mice. D-F: Paired t-test with Holm-Sidak multiple testing correction. **, P<0.01; ***, P<0.001; ****, P<0.0001. ns, P ≥ 0.05. Each data point represents one animal. Numbers above the category axis indicate sample sizes.
Fig. 5.
Fig. 5.. Effect of Calm1-targeting ASO on wild-type mice.
Calm1+/+ mice were treated with vehicle or Calm1-targeting ASO (mASO) for one month. A. Cardiac calmodulin transcript levels. Calm1, Calm2, and Calm3, normalized to Gapdh, were quantified by RT-qPCR, in expressed as percent of vehicle treatment. Unpaired t-test. B. Quantification of cardiac CaM protein. Protein levels were measured by capillary western. CaM was normalized to GAPDH and expressed relative to vehicle treatment. C-D. Echocardiography was performed to measure heart rate (HR) and fractional shortening (FS) before and after treatment. Paired t-test with Holm-Sidak multiple testing correction. E-F. Skeletal muscle calmodulin transcript labels and CaM protein were measured analogous to A-B. G. Treadmill endurance of vehicle and mASO-treated mice. Unpaired t-test. Numbers indicate sample sizes. Data are shown as mean ± sd. Each data point represents one animal. Numbers above the category axis indicate sample sizes.

References

    1. Scharner J, Aznarez I. Clinical Applications of Single-Stranded Oligonucleotides: Current Landscape of Approved and In-Development Therapeutics. Mol Ther. 2021;29:540–554. - PMC - PubMed
    1. Roberts TC, Langer R, Wood MJA. Advances in oligonucleotide drug delivery. Nat Rev Drug Discov. 2020;19:673–694. - PMC - PubMed
    1. Crooke ST, Baker BF, Crooke RM, Liang X-H. Antisense technology: an overview and prospectus. Nat Rev Drug Discov. 2021;20:427–453. - PubMed
    1. Kim J, Hu C, Moufawad El Achkar C, Black LE, Douville J, Larson A, Pendergast MK, Goldkind SF, Lee EA, Kuniholm A, Soucy A, Vaze J, Belur NR, Fredriksen K, Stojkovska I, Tsytsykova A, Armant M, DiDonato RL, Choi J, Cornelissen L, Pereira LM, Augustine EF, Genetti CA, Dies K, Barton B, Williams L, Goodlett BD, Riley BL, Pasternak A, Berry ER, Pflock KA, Chu S, Reed C, Tyndall K, Agrawal PB, Beggs AH, Grant PE, Urion DK, Snyder RO, Waisbren SE, Poduri A, Park PJ, Patterson A, Biffi A, Mazzulli JR, Bodamer O, Berde CB, Yu TW. Patient-Customized Oligonucleotide Therapy for a Rare Genetic Disease. N Engl J Med. 2019;381:1644–1652. - PMC - PubMed
    1. Prakash TP, Mullick AE, Lee RG, Yu J, Yeh ST, Low A, Chappell AE, Østergaard ME, Murray S, Gaus HJ, Swayze EE, Seth PP. Fatty acid conjugation enhances potency of antisense oligonucleotides in muscle. Nucleic Acids Res. 2019;47:6029–6044. - PMC - PubMed