. 2024 Aug 7;30(29):3488-3510.
doi: 10.3748/wjg.v30.i29.3488.

Leech Poecilobdella manillensis protein extract ameliorated hyperuricemia by restoring gut microbiota dysregulation and affecting serum metabolites

Affiliations

Leech Poecilobdella manillensis protein extract ameliorated hyperuricemia by restoring gut microbiota dysregulation and affecting serum metabolites

Xia Liu et al. World J Gastroenterol. .

Abstract

Background: Hyperuricemia (HUA) is a public health concern that needs to be solved urgently. The lyophilized powder of Poecilobdella manillensis has been shown to significantly alleviate HUA; however, its underlying metabolic regulation remains unclear.

Aim: To explore the underlying mechanisms of Poecilobdella manillensis in HUA based on modulation of the gut microbiota and host metabolism.

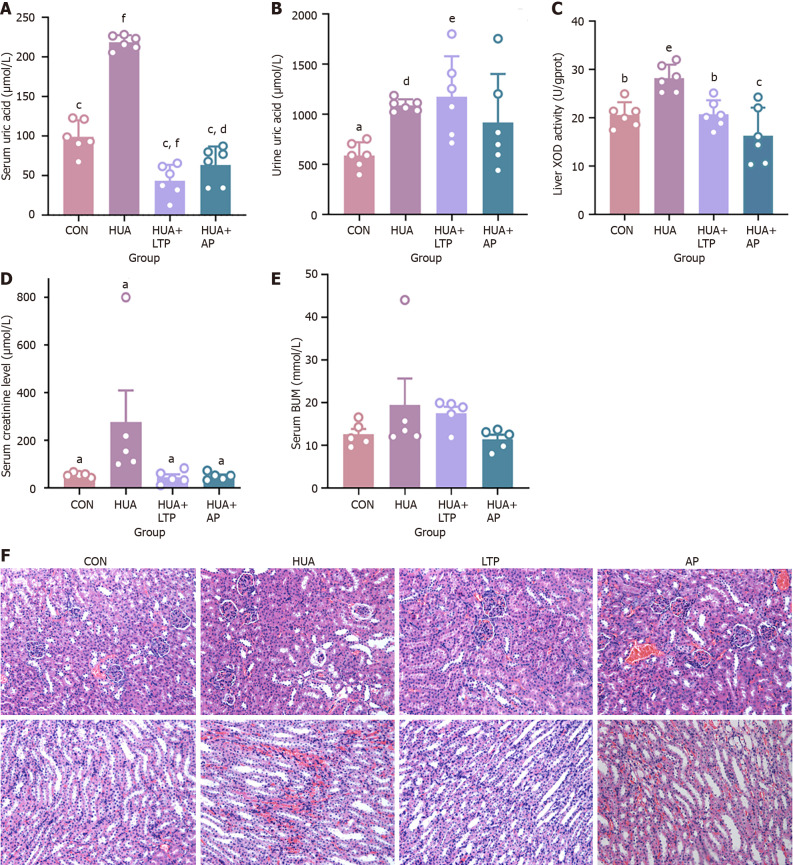
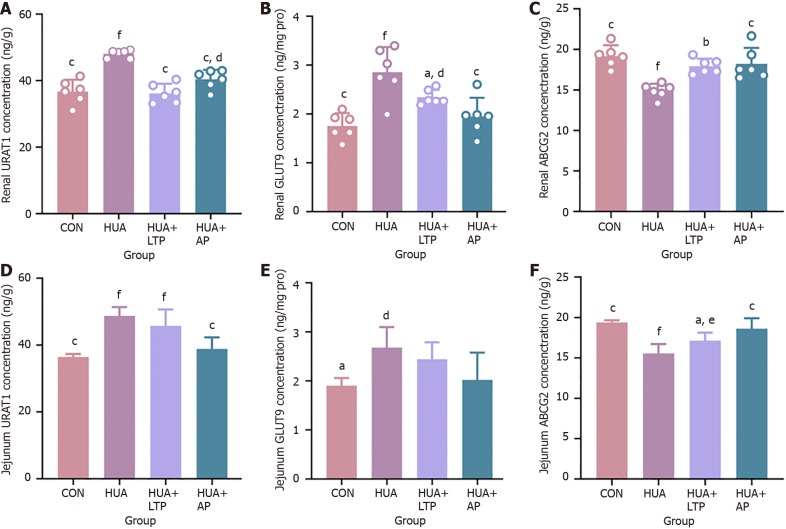
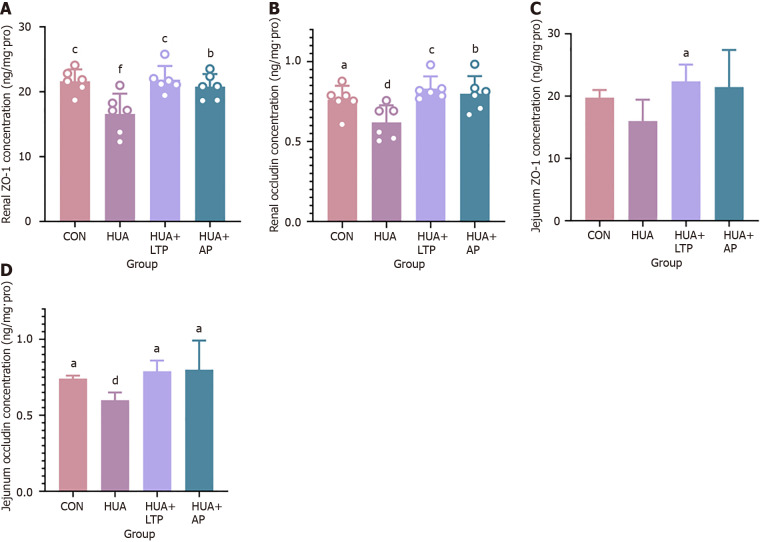
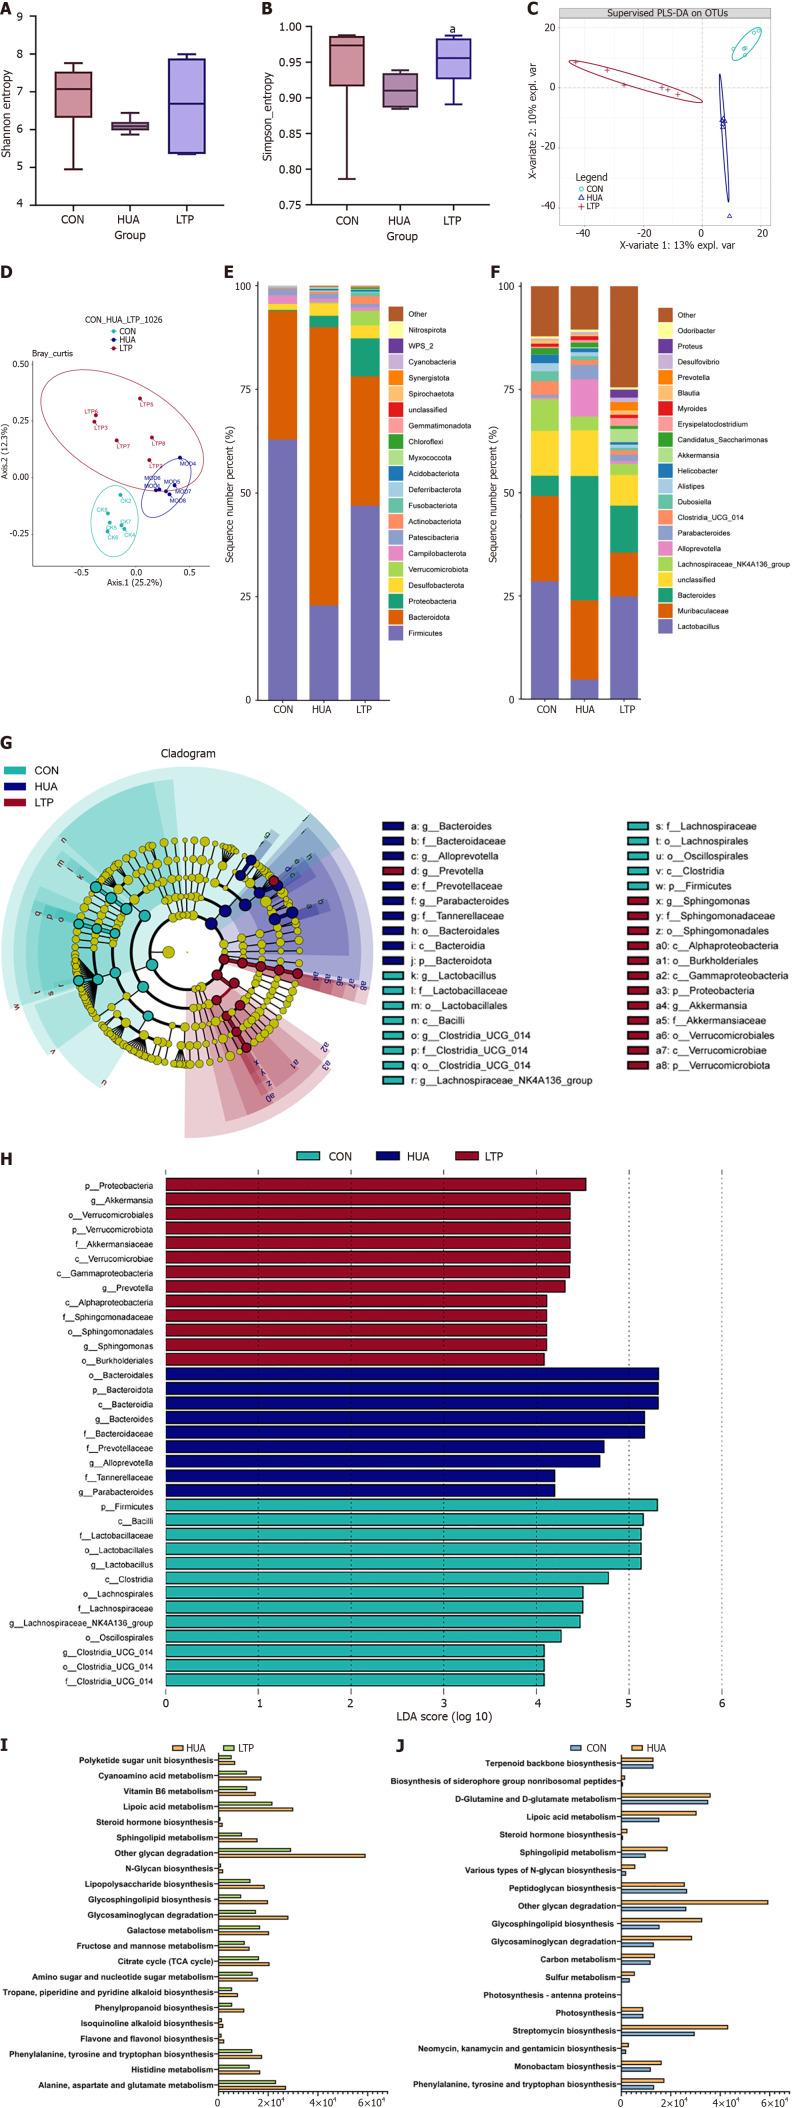
Methods: A mouse model of rapid HUA was established using a high-purine diet and potassium oxonate injections. The mice received oral drugs or saline. Additionally, 16S rRNA sequencing and ultra-high performance liquid chromatography with quadrupole time-of-flight mass spectrometry-based untargeted metabolomics were performed to identify changes in the microbiome and host metabolome, respectively. The levels of uric acid transporters and epithelial tight junction proteins in the renal and intestinal tissues were analyzed using an enzyme-linked immunosorbent assay.

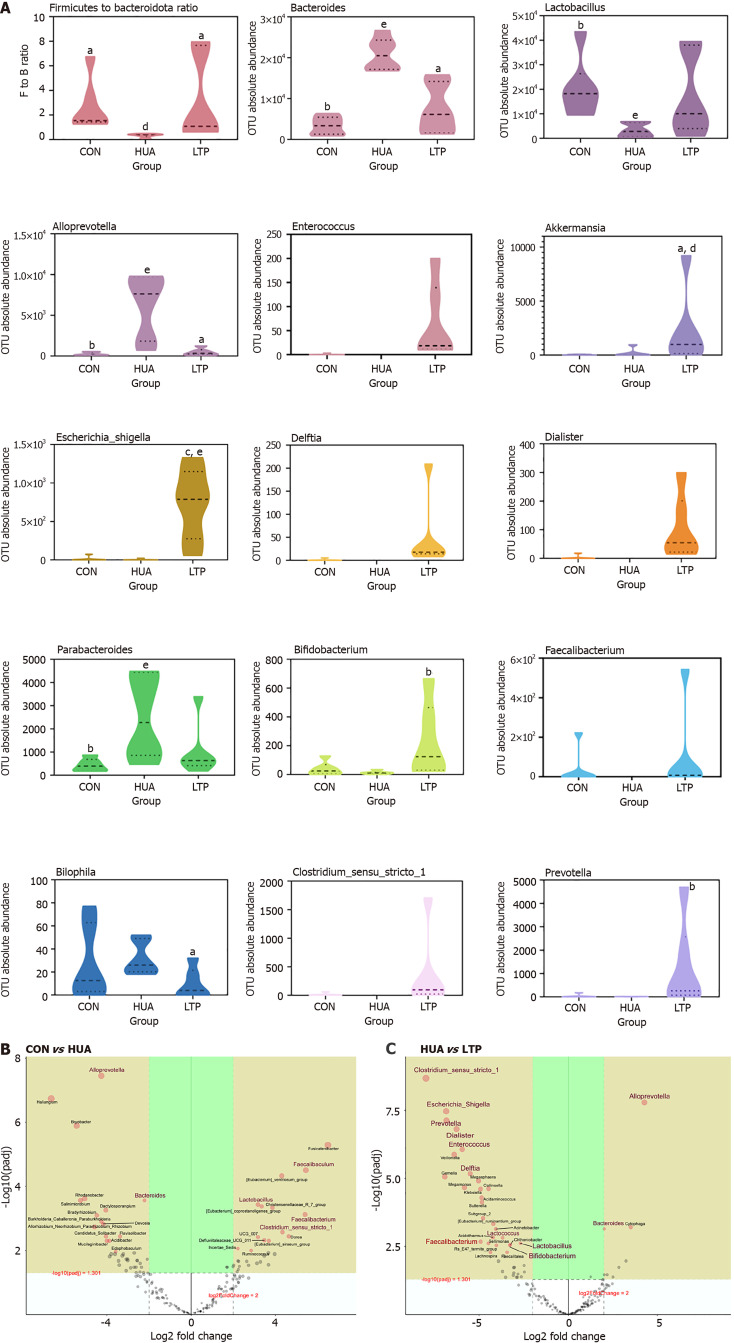
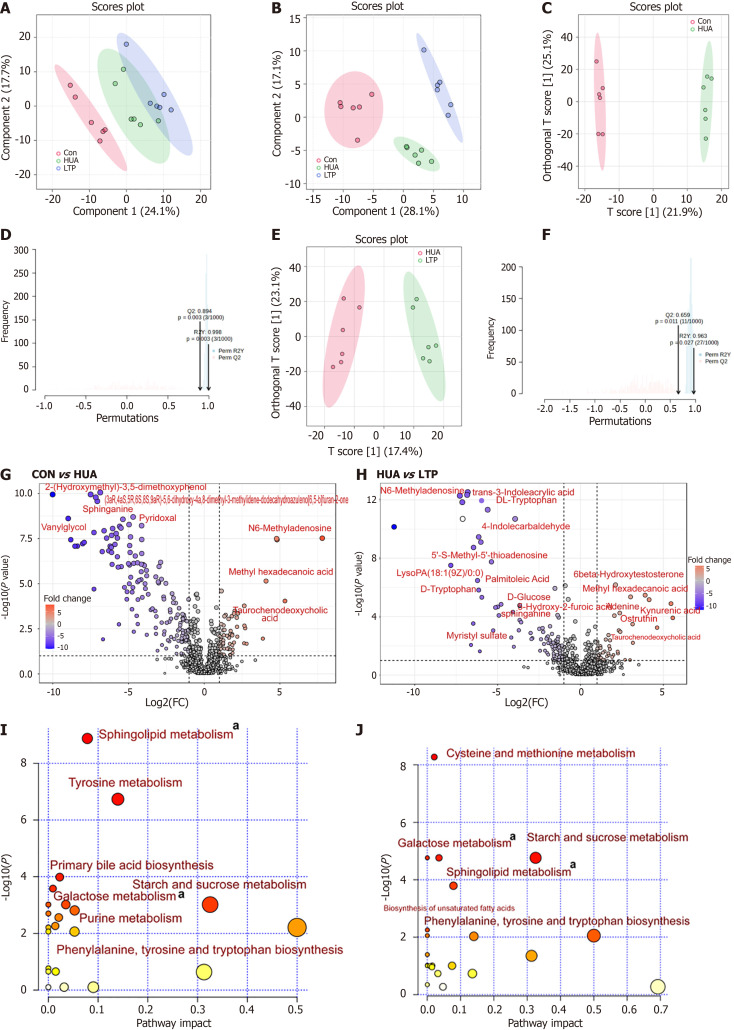
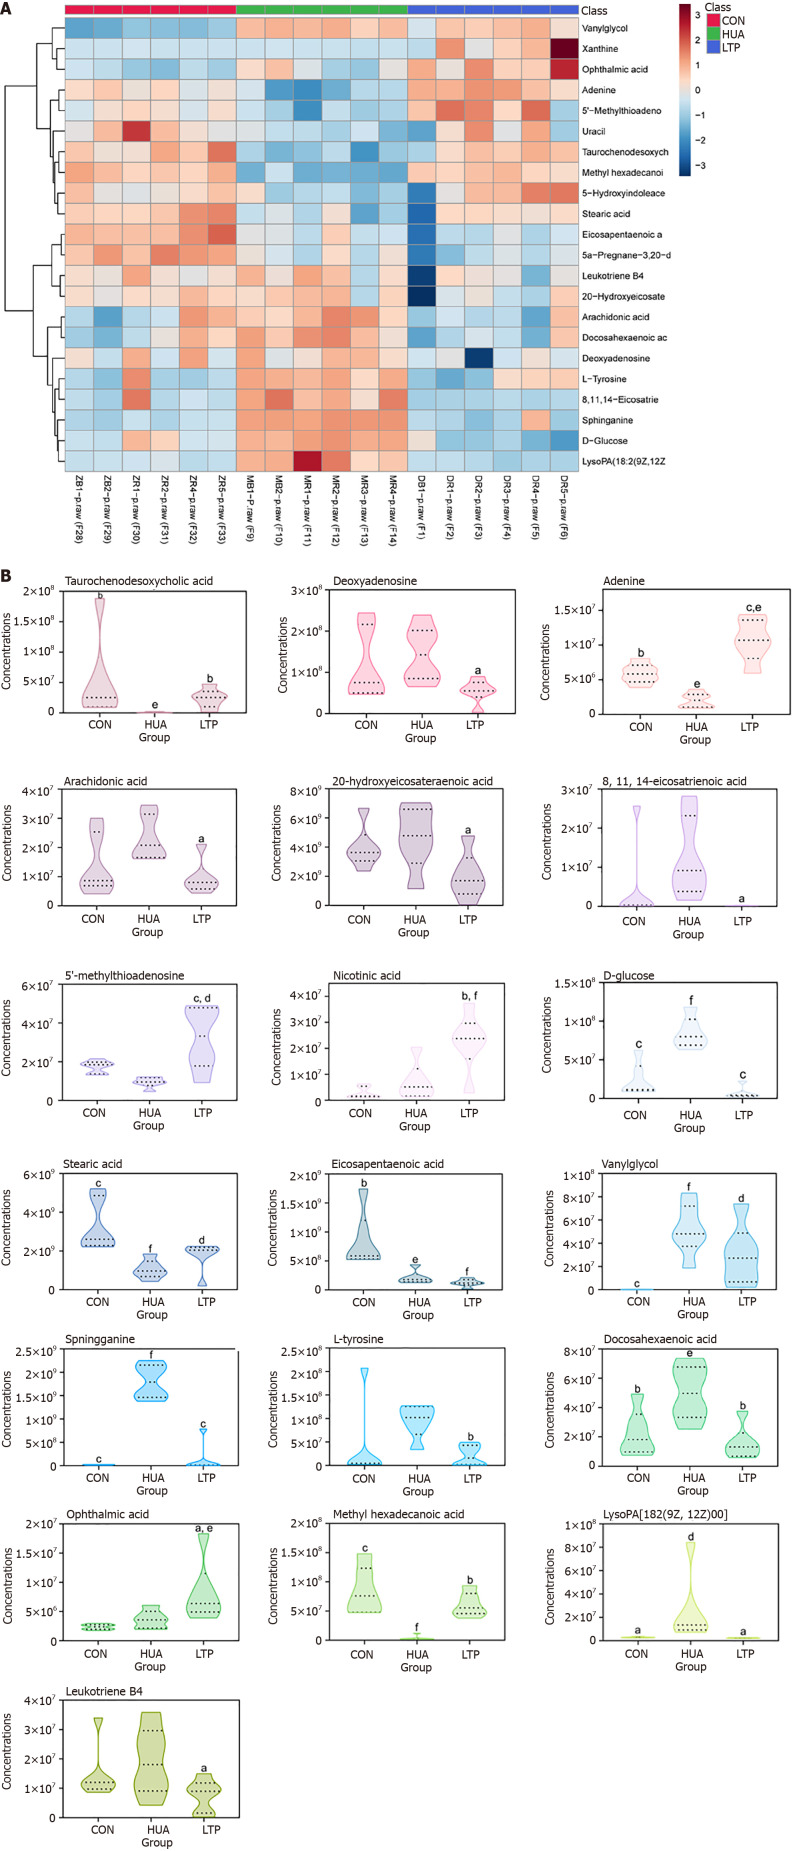
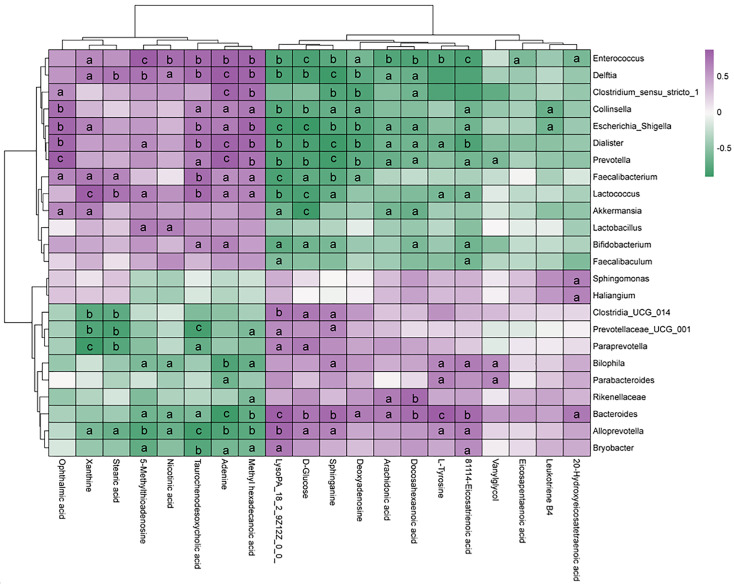
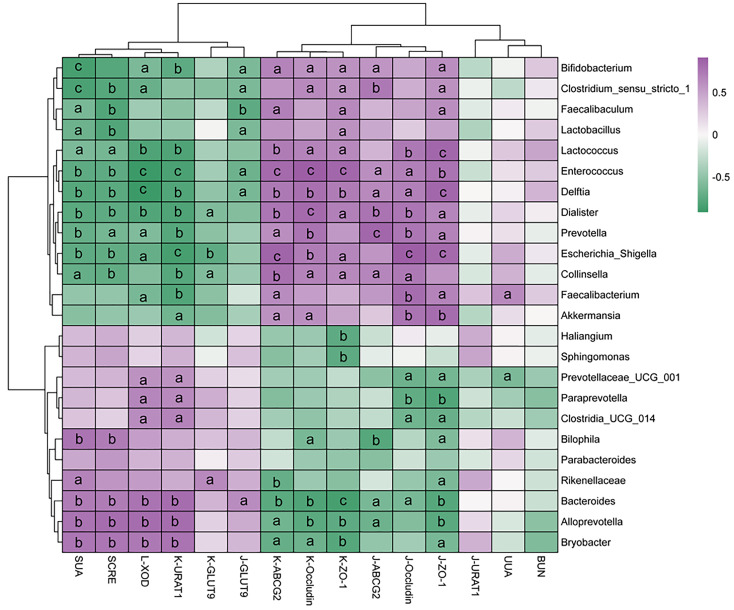
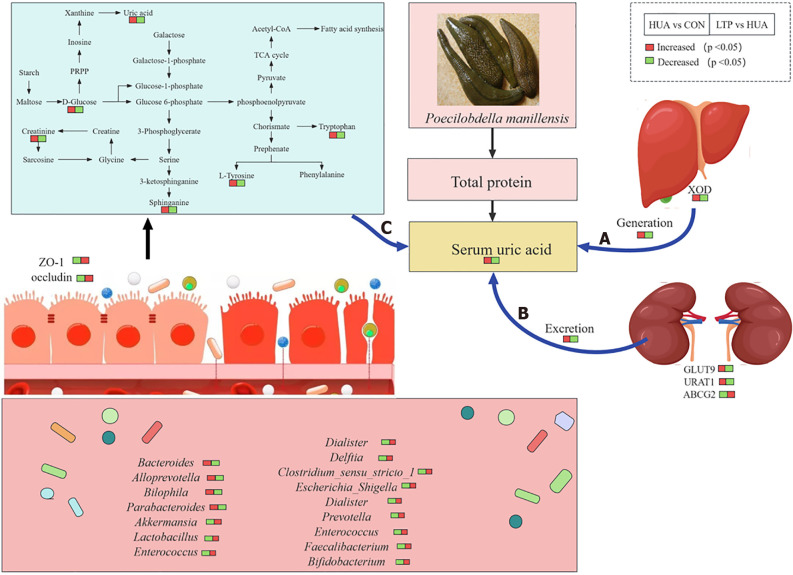
Results: The protein extract of Poecilobdella manillensis lyophilized powder (49 mg/kg) showed an enhanced anti-trioxypurine ability than that of allopurinol (5 mg/kg) (P < 0.05). A total of nine bacterial genera were identified to be closely related to the anti-trioxypurine activity of Poecilobdella manillensis powder, which included the genera of Prevotella, Delftia, Dialister, Akkermansia, Lactococcus, Escherichia_Shigella, Enterococcus, and Bacteroides. Furthermore, 22 metabolites in the serum were found to be closely related to the anti-trioxypurine activity of Poecilobdella manillensis powder, which correlated to the Kyoto Encyclopedia of Genes and Genomes pathways of cysteine and methionine metabolism, sphingolipid metabolism, galactose metabolism, and phenylalanine, tyrosine, and tryptophan biosynthesis. Correlation analysis found that changes in the gut microbiota were significantly related to these metabolites.

Conclusion: The proteins in Poecilobdella manillensis powder were effective for HUA. Mechanistically, they are associated with improvements in gut microbiota dysbiosis and the regulation of sphingolipid and galactose metabolism.

Keywords: Galactose metabolism pathway; Gut microbiota; Hyperuricemia; Metabolism; Multi-omics; Poecilobdella manillensis; Sphingolipid metabolism pathway.


Conflict of interest statement

Conflict-of-interest statement: All the authors report no relevant conflicts of interest for this article.

Figures

Figure 1
Figure 1
Effect of leech Poecilobdella manillensis total protein extract treatment on hyperuricemia. A: Serum uric acid levels; B: Urine uric acid levels; C: Liver xanthine oxidase activity; D: Serum creatinine levels; E: Blood urea nitrogen levels; F: Renal tissue hematoxylin and eosin staining pathology under 200 × magnification. Statistical significance determined by ANOVA is indicated as follows: aP < 0.05 vs hyperuricemia model group (HUA); bP < 0.01 vs HUA; cP < 0.001 vs HUA; dP < 0.05 vs normal control group (CON); eP < 0.01 vs CON; fP < 0.001 vs CON. CON: Normal control group; HUA: Hyperuricemia model group; AP: Allopurinol treatment group; LTP: Leech Poecilobdella manillensis total protein extract treatment group; XOD: Xanthine oxidase; BUN: Blood urea nitrogen.
Figure 2
Figure 2
Effect of leech Poecilobdella manillensis total protein extract on facilitating uric acid excretion, evaluated by enzyme-linked immunosorbent assay. A: Renal urate transporter 1 (URAT1) concentration level; B: Renal glucose transporter 9 (GLUT9) concentration level; C: Renal ATP-binding cassette transporter G2 (ABCG2) concentration level; D: Jejunum URAT1 concentration level; E: Jejunum GLUT9 concentration level; F: Jejunum ABCG2 concentration level. Statistical significance determined by ANOVA is indicated as follows: aP < 0.05 vs hyperuricemia model group (HUA); bP < 0.01 vs HUA; cP < 0.001 vs HUA; dP < 0.05 vs normal control group (CON); eP < 0.01 vs CON; fP < 0.001 vs CON. Sample sizes: Renal tissue n = 6 for each group; Jejunum tissue n = 4 for each group. CON: Normal control group; HUA: Hyperuricemia model group; AP: Allopurinol treatment group; LTP: Leech Poecilobdella manillensis total protein extract treatment group; URAT1: Urate transporter 1; GLUT9: Glucose transporter 9; ABCG2: ATP-binding cassette transporter G2.
Figure 3
Figure 3
Effect of leech Poecilobdella manillensis total protein extract on epithelial tight junction proteins, evaluated by enzyme-linked immunosorbent assay. A: Renal zonula occludens-1 (ZO-1) concentration level; B: Renal occludin concentration level; C: Jejunum ZO-1 concentration level; D: Jejunum occludin concentration level. Statistical significance determined by ANOVA is indicated as follows: aP < 0.05 vs hyperuricemia model group (HUA); bP < 0.01 vs HUA; cP < 0.001 vs HUA; dP < 0.05 vs normal control group (CON); fP < 0.001 vs CON. Sample sizes: Renal tissue n = 6 for each group; Jejunum tissue n = 4 for each group. CON: Normal control group; HUA: Hyperuricemia model group; AP: Allopurinol treatment group; LTP: Leech Poecilobdella manillensis total protein extract treatment group; ZO-1: Zonula occludens-1.
Figure 4
Figure 4
Leech Poecilobdella manillensis total protein extract alters the gut microbiota in potassium oxonate-induced hyperuricemia mice. A: Shannon index across three groups; B: Simpson index across three groups; C: Partial least squares discriminant analysis of three groups; D: Principal coordinate analysis of three groups; E: Distribution plot of relative abundance at the phylum level of bacteria; F: Distribution plot of relative abundance at the genus level of bacteria; G: Cladogram from linear discriminant analysis effect size (LEfSe) analysis identifying highly differentiated taxa from phylum to genus levels; H: Linear discriminant analysis graph from LefSe analysis identifying highly differentiated taxa from phylum to genus levels; I: Predicted functional pathways of gut microbiota in hyperuricemia model group (HUA) vs leech Poecilobdella manillensis total protein extract treatment group; J: Predicted functional pathways of gut microbiota in normal control group vs HUA. Statistical significance is indicated as follows: aP < 0.05 vs hyperuricemia model group. Sample size: n = 6 per group. CON: Normal control group; HUA: Hyperuricemia model group; LTP: Leech Poecilobdella manillensis total protein extract treatment group; LDA: Linear discriminant analysis.
Figure 5
Figure 5
Effect of leech Poecilobdella manillensis total protein extract on vital microbial genus. A: The absolute abundance of vital microbial genera in all groups, assessed through the Kruskal-Wallis ANOVA; B and C: Significant differences between each two groups at the genus level of gut microbiota, determined by DESeq2 method [B: normal control group vs hyperuricemia model group (HUA); C: HUA vs leech Poecilobdella manillensis total protein extract treatment group; n = 6 for each group]. Statistical significance is indicated as follows: aP < 0.05 vs hyperuricemia model group (HUA); bP < 0.01 vs HUA; cP < 0.001 vs HUA; dP < 0.05 vs normal control group (CON); eP < 0.01 vs CON. CON: Normal control group; HUA: Hyperuricemia model group; LTP: Leech Poecilobdella manillensis total protein extract treatment group.
Figure 6
Figure 6
Leech Poecilobdella manillensis total protein extract alters the plasma metabolites in potassium oxonate-induced hyperuricemia mice. A and B: Partial least squares discriminant analysis (PLS-DA) score plots for normal control group (CON), hyperuricemia model group (HUA), and leech Poecilobdella manillensis total protein extract treatment group (LTP) in positive and negative ion mode, respectively; C and D: Score plots and permutation tests of orthogonal PLS-DA (OPLS-DA) between the HUA and CON groups; E and F: Score plots and permutation tests of OPLS-DA between the LTP and HUA groups; G: Volcano plot showing most significant metabolites identified by univariate analysis between the HUA and CON groups; H: Volcano plot showing most significant metabolites identified by univariate analysis between the LTP and HUA groups; I: Summary plot for pathway analysis of CON vs HUA; J: Summary plot for pathway analysis of LTP vs HUA, a pathways coexisted in both the microbiota and metabolome. CON: Normal control group; HUA: Hyperuricemia model group; LTP: Leech Poecilobdella manillensis total protein extract treatment group; FC: Fold change.
Figure 7
Figure 7
Effect of leech Poecilobdella manillensis total protein extract on vital metabolites. A: Heatmaps showing the trends in differential metabolites between groups; B: The concentrations of vital metabolites for all groups, assessed through the Kruskal-Wallis ANOVA. Statistical significance is indicated as follows: aP < 0.05 vs hyperuricemia model group (HUA); bP < 0.01 vs HUA; cP < 0.001 vs HUA; dP < 0.05 vs normal control group (CON); eP < 0.01 vs CON; fP < 0.001 vs CON. CON: Normal control group; HUA: Hyperuricemia model group; LTP: Leech Poecilobdella manillensis total protein extract treatment group.
Figure 8
Figure 8
Correlation analysis between the gut microbiota and metabolites from hyperuricemia and leech Poecilobdella manillensis total protein extract groups. The R values are represented by gradient colors, where purple cells indicate positive correlations and green cells indicate negative correlations, respectively. Statistical significance is denoted as follows: aP < 0.05, bP < 0.01, cP < 0.001.
Figure 9
Figure 9
Correlation analysis between gut microbiota and hyperuricemia-related parameters. The R values are represented by gradient colors, where purple cells indicate positive correlations and green cells indicate negative correlations, respectively. Statistical significance is denoted as follows: aP < 0.05, bP < 0.01, cP < 0.001. BUN: Blood urea nitrogen; UUA: Urinary uric acid; ZO-1: Zonula occludens-1; URAT1: Urate transporter 1; GLUT9: Glucose transporter 9; ABCG2: ATP-binding cassette transporter G2; XOD: Xanthine oxidase; SCRE: Serum creatinine; SUA: Serum uric acid.
Figure 10
Figure 10
Mechanisms associated with treatment of Poecilobdella manillensis for hyperuricemia. A: decreased of uric acid generation in liver by reducing levels of xanthine oxidase; B: Reduction of uric acid excretion from kidney by regulating the expression of glucose transporter 9, urate transporter 1, and ATP-binding cassette transporter G2; C: Improvement of gut microbiota dysbiosis and regulation of sphingolipid metabolism and galactose metabolism. CON: Normal control group; HUA: Hyperuricemia model group; LTP: Leech Poecilobdella manillensis total protein extract treatment group; ZO-1: Zonula occludens-1; URAT1: Urate transporter 1; GLUT9: Glucose transporter 9; ABCG2: ATP-binding cassette transporter G2; XOD: Xanthine oxidase.

Similar articles

Cited by

References

    1. Zhao H, Chen X, Zhang L, Meng F, Zhou L, Pang X, Lu Z, Lu Y. Lacticaseibacillus rhamnosus Fmb14 prevents purine induced hyperuricemia and alleviate renal fibrosis through gut-kidney axis. Pharmacol Res. 2022;182:106350. - PubMed
    1. Li S, Liu X, Jia X, Fang M, Yang Q, Gong Z. Assessment of the temporal trend and daily profiles of the dietary purine intake among Chinese residents during 2014 to 2021. Front Nutr. 2023;10:1259053. - PMC - PubMed
    1. Yanai H, Adachi H, Hakoshima M, Katsuyama H. Molecular Biological and Clinical Understanding of the Pathophysiology and Treatments of Hyperuricemia and Its Association with Metabolic Syndrome, Cardiovascular Diseases and Chronic Kidney Disease. Int J Mol Sci. 2021;22 - PMC - PubMed
    1. McCormick N, Lin K, Yokose C, Lu N, Zhang Y, Choi HK. Unclosing Premature Mortality Gap Among Patients With Gout in the US General Population, Independent of Serum Urate and Atherosclerotic Cardiovascular Risk Factors. Arthritis Care Res (Hoboken) 2024;76:691–702. - PMC - PubMed
    1. Agus A, Clément K, Sokol H. Gut microbiota-derived metabolites as central regulators in metabolic disorders. Gut. 2021;70:1174–1182. - PMC - PubMed

LinkOut - more resources