. 2024 Jul 8;27(8):110477.
doi: 10.1016/j.isci.2024.110477. eCollection 2024 Aug 16.

Fission yeast Bgs1 glucan synthase participates in the control of growth polarity and membrane traffic

Affiliations

Fission yeast Bgs1 glucan synthase participates in the control of growth polarity and membrane traffic

Mariona Ramos et al. iScience. .

Abstract

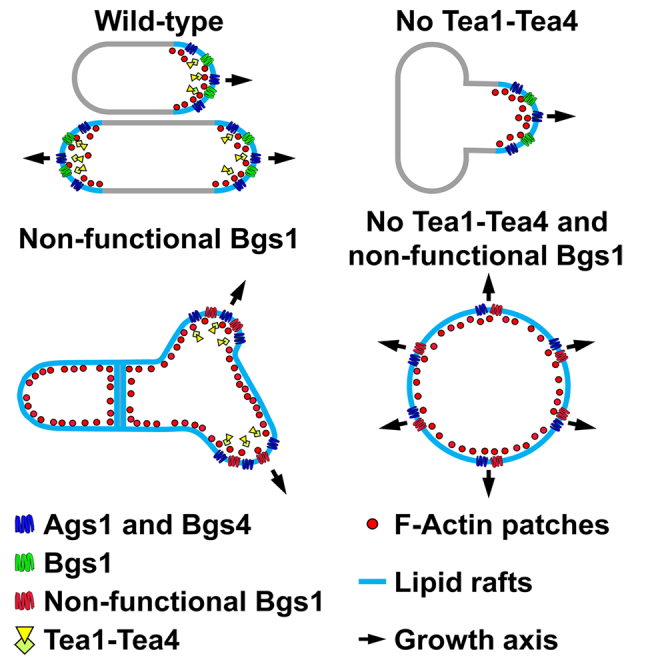
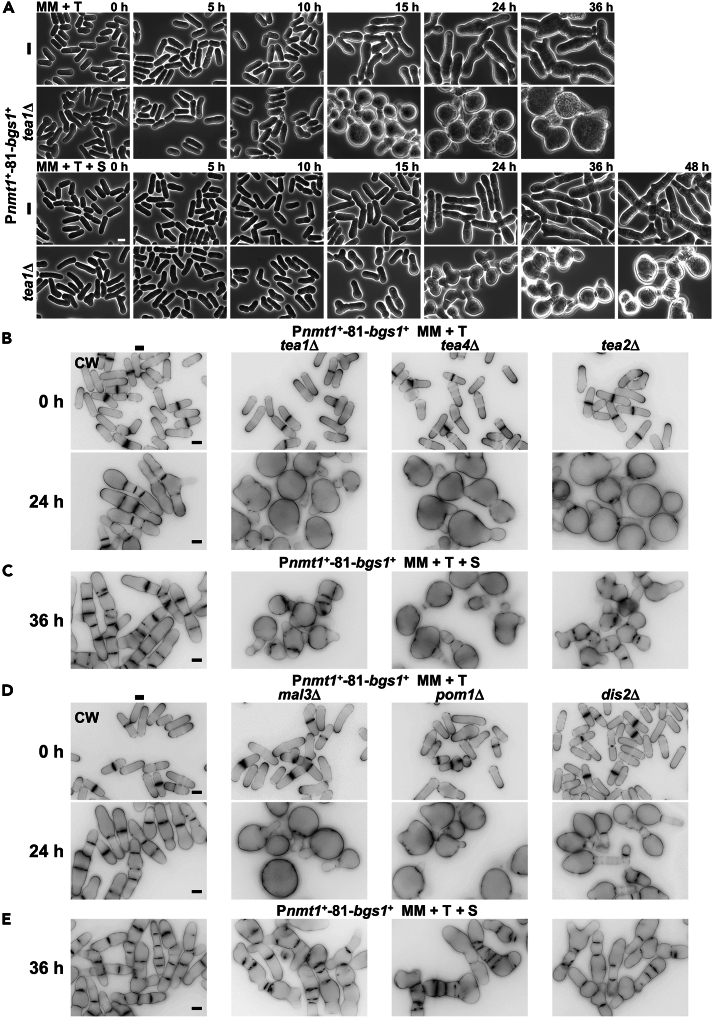
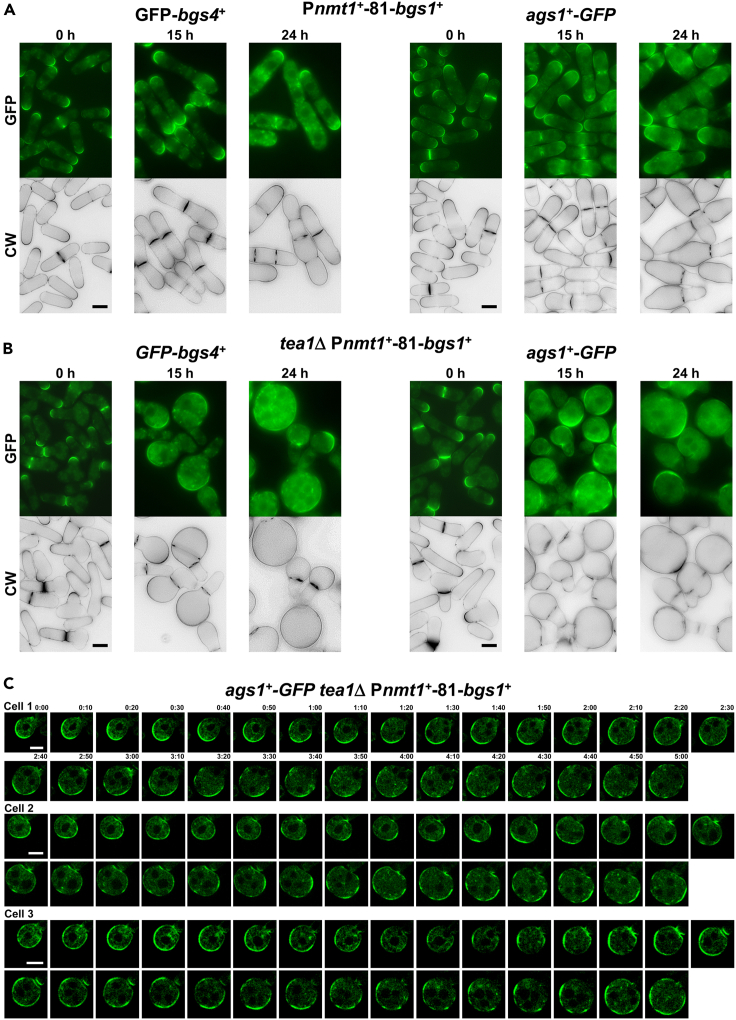
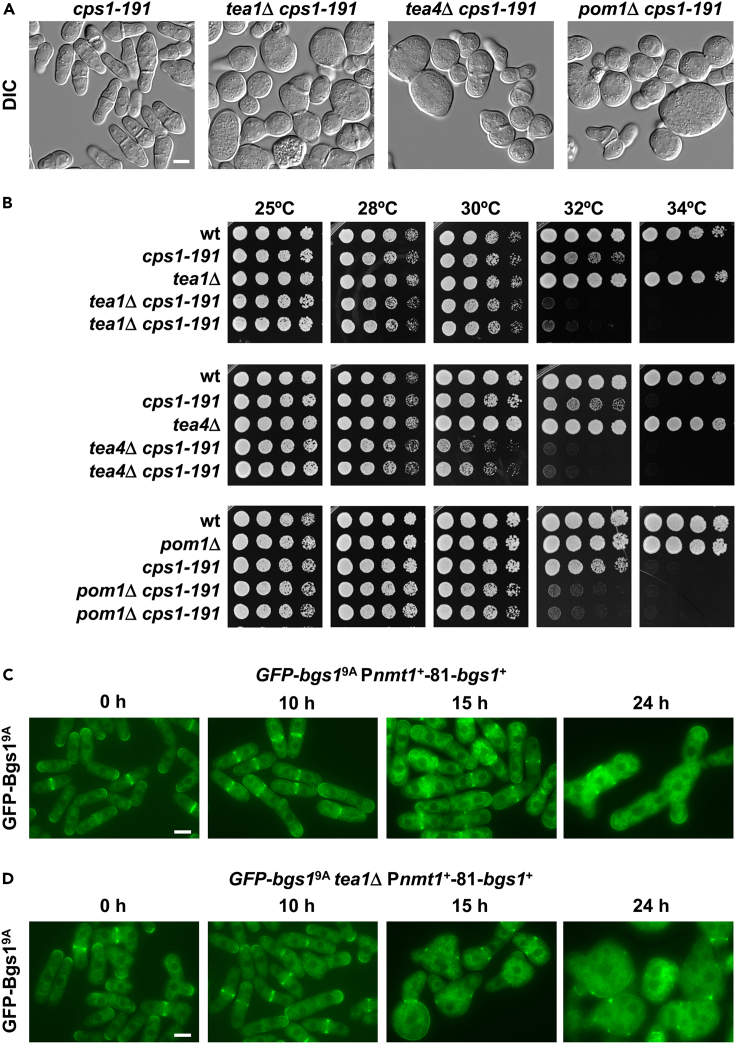
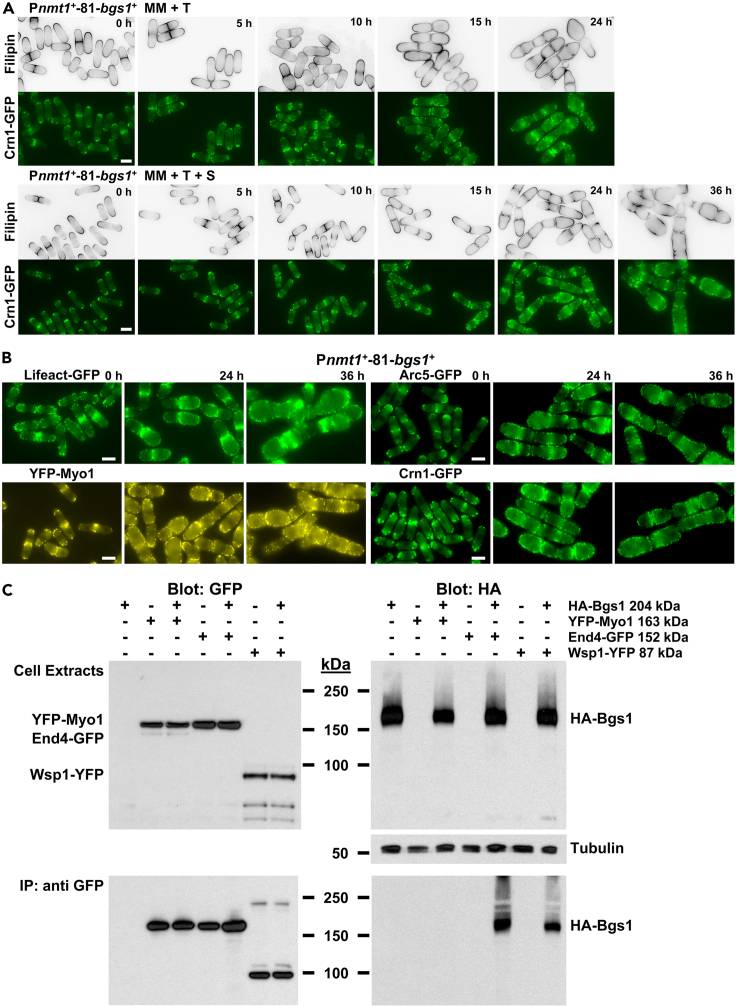
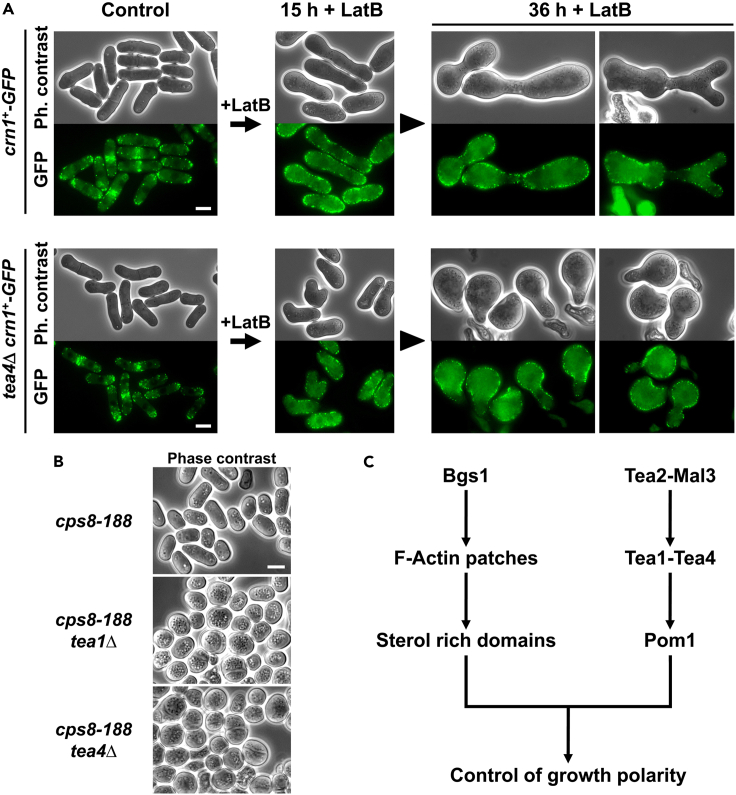
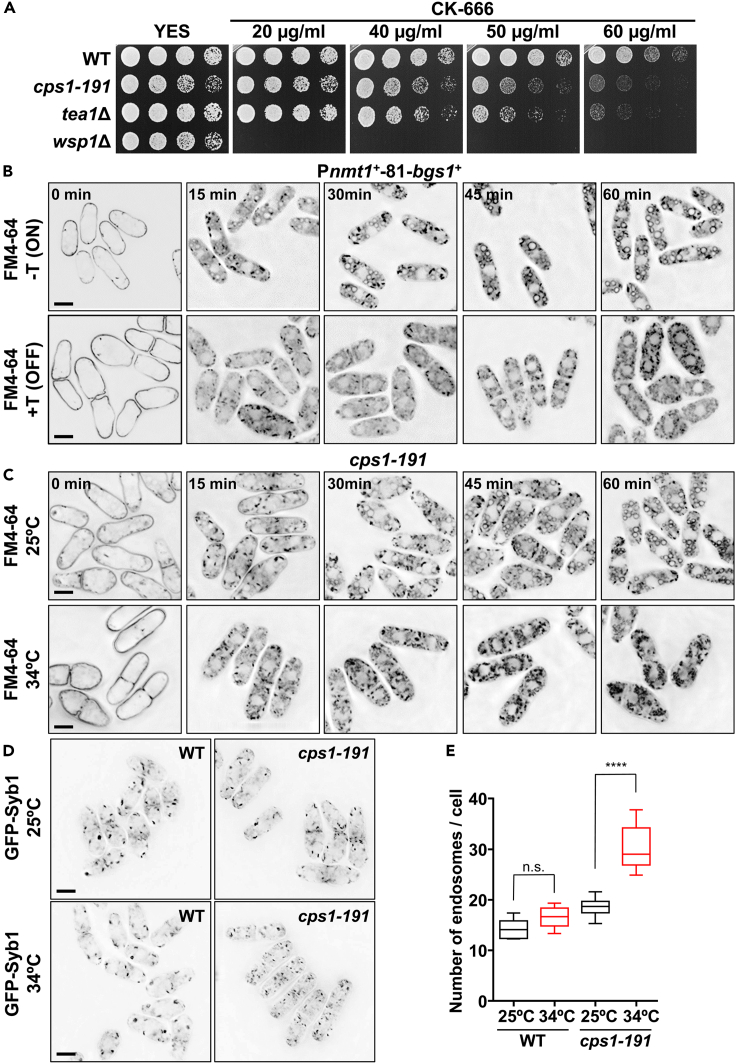
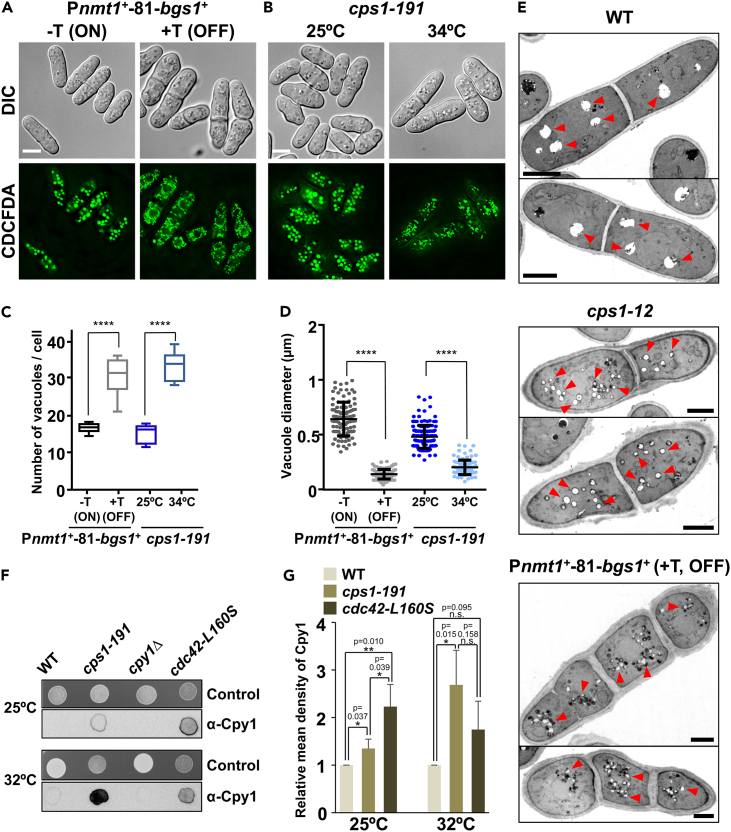
Rod-shaped fission yeast grows through cell wall expansion at poles and septum, synthesized by essential glucan synthases. Bgs1 synthesizes the linear β(1,3)glucan of primary septum at cytokinesis. Linear β(1,3)glucan is also present in the wall poles, suggesting additional Bgs1 roles in growth polarity. Our study reveals an essential collaboration between Bgs1 and Tea1-Tea4, but not other polarity factors, in controlling growth polarity. Simultaneous absence of Bgs1 function and Tea1-Tea4 causes complete loss of growth polarity, spread of other glucan synthases, and spherical cell formation, indicating this defect is specifically due to linear β(1,3)glucan absence. Furthermore, linear β(1,3)glucan absence induces actin patches delocalization and sterols spread, which are ultimately responsible for the growth polarity loss without Tea1-Tea4. This suggests strong similarities in Bgs1 functions controlling actin structures during cytokinesis and polarized growth. Collectively, our findings unveil that cell wall β(1,3)glucan regulates polarized growth, like the equivalent extracellular matrix in neuronal cells.

Keywords: Functional aspects of cell biology; Mycology; Organizational aspects of cell biology.


Conflict of interest statement

The authors declare no competing interests.

Figures

None
Graphical abstract
Figure 1
Figure 1
Bgs1 cooperates with the Tea1-Tea4 complex and Pom1 kinase in the essential control of growth polarity (A) Time course phase contrast micrographs of control and tea1Δ cells carrying bgs1+ under the control of the thiamine-repressible nmt1+-81 promoter (Pnmt1+-81-bgs1+). Cells were grown to early log-phase at 28°C in minimal medium (MM) without thiamine (bgs1+ ON, − T) and without (upper panels) or with 1.3 M sorbitol (+S, lower panels). The cells were then transferred to MM with thiamine (bgs1+ OFF, + T) either in the absence (MM + T, upper panels) or presence of sorbitol (MM + T + S, lower panels) and imaged for phase contrast at the indicated times with thiamine (0, 5, 10, 15, 24, and 36 h for MM + T, and the same times plus 48 h for MM + T + S). (B and C) Fluorescence micrographs of calcofluor white (CW)-stained control, tea1Δ, tea4Δ, and tea2Δ cells carrying bgs1+ under the control of the nmt1+-81 promoter. Cells were grown to early log-phase at 28°C in MM (B) or MM + S (C). Then, the cells were transferred to MM + T (B) or MM + T + S (C) and imaged for CW fluorescence at the indicated times with thiamine (0 and 24 h for MM + T, and 36 h for MM + T + S). (D and E) Control, mal3Δ, pom1Δ, and dis2Δ cells carrying Pnmt1+-81-bgs1+ were grown to early log-phase at 28°C in MM (D) or MM + S (E), transferred to MM + T (D) or MM + T + S (E), and imaged as in B and C at the indicated times with thiamine (0 and 24 h for MM + T, and 36 h for MM + T + S). Scale bars, 5 μm. See also Figure S1 and Table S1.
Figure 2
Figure 2
The joint absence of Bgs1 and Tea1 alters the location of the other glucan synthases Bgs4 and Ags1 (A and B) Fluorescence micrographs of CW-stained Pnmt1+-81-bgs1+ (A) and tea1Δ Pnmt1+-81-bgs1+ (B) cells carrying either GFP-bgs4+ (left panels) or ags1+-GFP (right panels). Cells were grown to early log-phase at 28°C in MM, transferred to MM + T, and imaged for CW and GFP fluorescences using time course microscopy at the indicated times with thiamine (0, 15, and 24 h). (C) Time-lapse sequences from the onset of formation of spherical cells and spreading of Ags1-GFP (cell 1) to create enlarged rounded cells maintaining Ags1-GFP around the cell. Early log-phase ags1+-GFP tea1Δ Pnmt1+-81-bgs1+ cells grown at 28°C in MM were transferred to MM + T for 15 h and imaged for 5 h through GFP fluorescence time-lapse video microscopy. Elapsed time is shown in hours and minutes. Scale bars, 5 μm. See also Figures S2 and S3.
Figure 3
Figure 3
Bgs1 loss of function, with the GFP-Bgs1 mutant protein remaining correctly localized, in the absence of Tea1 causes the same loss of growth polarity phenotype as that of simultaneous absence of Bgs1 and Tea1 (A) Differential interference contrast (DIC) micrographs showing the morphology of early log-phase cps1-191, tea1Δ cps1-191, tea4Δ cps1-191, and pom1Δ cps1-191 mutant cells grown at 25°C in YES medium, shifted to 30°C for 24 h, and imaged. cps1-191 is a thermosensitive mutant allele of bgs1+. (B) Cell growth of wild-type (WT) and cps1-191, tea1Δ, and tea1Δ cps1-191 mutant cells in YES solid medium at different temperatures (25, 28, 30, 32°C, and 34°C). Cells were spotted (5 μL, A600 of 1.0) at 1/4 dilutions on YES agar plates and grown for 3 days. (C and D) Time course fluorescence micrographs of Pnmt1+-81-bgs1+ (C) and tea1Δ Pnmt1+-81-bgs1+ (D) cells carrying the non-functional correctly localized Bgs19A mutant version tagged with GFP (GFP-bgs19A(1136-1144)). Cells were grown at 28°C in MM, transferred to MM + T, and imaged for GFP fluorescence using time course microscopy at the indicated times with thiamine (0, 10, 15, and 24 h). Scale bars, 5 μm. See also Figures S3 and S4.
Figure 4
Figure 4
Bgs1 controls the localization of sterol-rich membrane (SRM) domains and actin patches, and physically interacts with the actin patch components Wsp1 and End4, but not with Myo1 (A) Time course fluorescence micrographs of filipin-stained Pnmt1+-81-bgs1+ cells carrying crn1+-GFP. Early log-phase cells grown at 28°C in MM (upper panels) or MM + S (lower panels) either in the absence or presence of thiamine, were stained with filipin to observe sterol-rich membrane (SRM) domains and imaged for filipin and coronin Crn1-GFP fluorescences using time course microscopy at the indicated times with thiamine (0, 5, 10, 15, and 24 h for MM + T, and the same times plus 36 h for MM + T + S). (B) Fluorescence micrographs of Pnmt1+-81-bgs1+ cells carrying either Lifeact-GFP, arc5+-GFP, YFP-myo1+, or crn1+-GFP to visualize actin patches. Cells were grown to early log-phase at 28°C in MM + S, transferred to MM + T + S, and imaged for GFP or YFP fluorescence using time course microscopy at the indicated times with thiamine (0, 24, and 36 h). Scale bars, 5 μm. (C) Extracts of cells expressing HA-Bgs1 and either YFP-Myo1, End4-GFP, or Wsp1-YFP were immunoprecipitated with polyclonal anti-GFP antibodies, and the precipitates were probed with monoclonal anti-HA or anti-GFP antibodies. Expression of YFP-Myo1, End4-GFP, Wsp1-YFP and HA-Bgs1 in cell extracts was analyzed by western blot with monoclonal anti-GFP or anti-HA antibodies. The extracts were also probed with monoclonal anti-α-tubulin antibody as the loading control. See also Figures S5 and S6.
Figure 5
Figure 5
Actin patches polarization is responsible for the control of growth polarity together with the Tea1-Tea4 complex (A) Phase contrast and GFP fluorescence micrographs of WT and tea4Δ cells carrying crn1+-GFP. Cells were grown at 28°C in YES medium (control), then a low concentration of Latrunculin B (LatB, 20 μM) to cause the delocalization but not depolymerization of actin patches was added, and the cells were imaged for phase contrast and GFP fluorescence using time-course microscopy at the indicated times with LatB (0, 15, and 36 h). (B) Phase contrast micrographs showing the rod shape or rounded morphology of cps8-188, tea1Δ cps8-188, and tea4Δ cps8-188 mutant cells. Cells were grown to stationary phase at 28°C on MM plates for 8 days and imaged. cps8-188 is a thermosensitive mutant allele of the actin gene act1+. Scale bars, 5 μm. (C) Scheme of the essential cooperation between Bgs1 and the specific Tea1-Tea4 complex in the control and maintenance of growth polarity. See also Figures S5–S7.
Figure 6
Figure 6
Bgs1 is required for endocytosis and the correct formation of endosomes and vacuoles (A) Cell growth of WT, cps1-191, tea1Δ, and wsp1Δ cells in YES solid medium with different concentrations of the Arp2/3 complex inhibitor CK-666. Cells were spotted (5 μL, A600 of 1.0) at 1/4 dilutions on YES agar plates and grown for 3 days at 30°C. (B) Kinetics of FM4-64 internalization in Pnmt1+-81-bgs1+ cells grown at 28°C in MM (bgs1+ ON, -T, upper panels) and transferred to MM + T for 15 h (bgs1+ OFF, +T, lower panels). The cells were imaged for FM4-64 fluorescence using time-course microscopy at the indicated times with FM4-64 (0, 15, 30, 45, and 60 min). (C) Kinetics of FM4-64 internalization in cps1-191 mutant cells grown in MM at permissive 25°C (upper panels) and restrictive 34°C for 4 h (lower panels). The cells were imaged as in B. (D) Fluorescence micrographs of WT and cps1-191 mutant cells carrying the endosome marker GFP-Syb1. Cells were grown in MM to early log-phase at permissive 25°C (upper panels) and restrictive 34°C for 4h (lower panels), and imaged for GFP fluorescence microscopy. Scale bars, 5 μm. (E) Boxplot showing the quantification of the number of GFP-Syb1 labeled endosomes per cell in images as in D (n = 100 cells). The asterisks indicate the significant statistical difference between paired strains analyzed by the Student’s test: ∗p < 0.05; ∗∗p < 0.01; ∗∗∗p < 0.001; ∗∗∗∗p < 0.0001; n. s.: not significant (p > 0.05). Error bars indicate standard deviation (SD). See also Figure S8.
Figure 7
Figure 7
Bgs1 depletion or loss of function causes fragmented vacuoles and miss-sorting of the carboxypeptidase Y Cpy1 to the vacuole (A and B) DIC and fluorescence micrographs of CDCFDA-stained vacuoles of (A) Pnmt1+-81-bgs1+ cells grown at 28°C in MM (bgs1+ ON, -T) and transferred to MM + T for 15 h (bgs1+ OFF, +T), and (B) cps1-191 mutant cells grown in MM at permissive 25°C and restrictive 34°C for 4 h. Scale bars, 5 μm. (C) Boxplot showing the quantification of the number of vacuoles per cell in images as in A and B (n = 100 cells). (D) Quantification of the diameter of the vacuoles in images as in A and B (n = 100 vacuoles). The asterisks indicate the significant statistical difference between paired strains analyzed by the Student’s test: ∗p < 0.05; ∗∗p < 0.01; ∗∗∗p < 0.001; ∗∗∗∗p < 0.0001; n. s.: not significant (p > 0.05). (E) Transmission electron micrographs of WT (upper panels) and cps1-12 mutant (middle panels) cells grown at 28°C in MM, and of Pnmt1+-81-bgs1+ cells grown at 28°C in MM + T + S for 24 h (bgs1+ OFF, +T, lower panels). cps1-12 is a thermosensitive mutant allele of bgs1+. Red arrowhead, vacuoles. Scale bars, 2 μm. (F) Colony immunoblot assay with anti-carboxypeptidase Y monoclonal antibody (lower panels) of WT and cps1-191 mutant cells spotted onto nitrocellulose membranes (5 μL, A600 of 2.0) laid on YES agar plates, and grown at permissive 25°C and restrictive 32°C for 24 h. The cpy1Δ strain was included as the negative control, and the cdc42L160S mutant strain as the positive control. As a control for the assayed colonies, the same cells were spotted on YES agar and grown at 25°C and 32°C for 24 h (upper panels). (G) Bar chart depicting mean density values relative to WT levels of carboxypeptidase Cpy1 secretion in the colony immunoblot assays of F (mean of three independent experiments). Error bars indicate standard deviation (SD). The asterisks indicate the significant statistical difference between paired strains analyzed by the Student’s test with three (n = 3) independent dot blot experiments: ∗p < 0.05; ∗∗p < 0.01; n. s.: not significant (p > 0.05). Error bars indicate standard deviation (SD). See also Figure S8.

Similar articles

References

    1. Macara I.G., McCaffrey L. Cell polarity in morphogenesis and metastasis. Philos. Trans. R. Soc. Lond. B Biol. Sci. 2013;368 doi: 10.1098/rstb.2013.0012. - DOI - PMC - PubMed
    1. Etienne-Manneville S. Cdc42--the centre of polarity. J. Cell Sci. 2004;117:1291–1300. doi: 10.1242/jcs.01115. - DOI - PubMed
    1. Rincón S.A., Estravis M., Pérez P. Cdc42 regulates polarized growth and cell integrity in fission yeast. Biochem. Soc. Trans. 2014;42:201–205. doi: 10.1042/BST20130155. - DOI - PubMed
    1. Mollinedo F. Lipid raft involvement in yeast cell growth and death. Front. Oncol. 2012;2:140. doi: 10.3389/fonc.2012.00140. - DOI - PMC - PubMed
    1. Takeshita N., Higashitsuji Y., Konzack S., Fischer R. Apical sterol-rich membranes are essential for localizing cell end markers that determine growth directionality in the filamentous fungus Aspergillus nidulans. Mol. Biol. Cell. 2008;19:339–351. doi: 10.1091/mbc.e07-06-0523. - DOI - PMC - PubMed

LinkOut - more resources