. 2024 Jul 4;27(8):110466.
doi: 10.1016/j.isci.2024.110466. eCollection 2024 Aug 16.

Monitoring GPCR conformation with GFP-inspired dyes

Affiliations

Monitoring GPCR conformation with GFP-inspired dyes

Anatoliy Belousov et al. iScience. .

Abstract

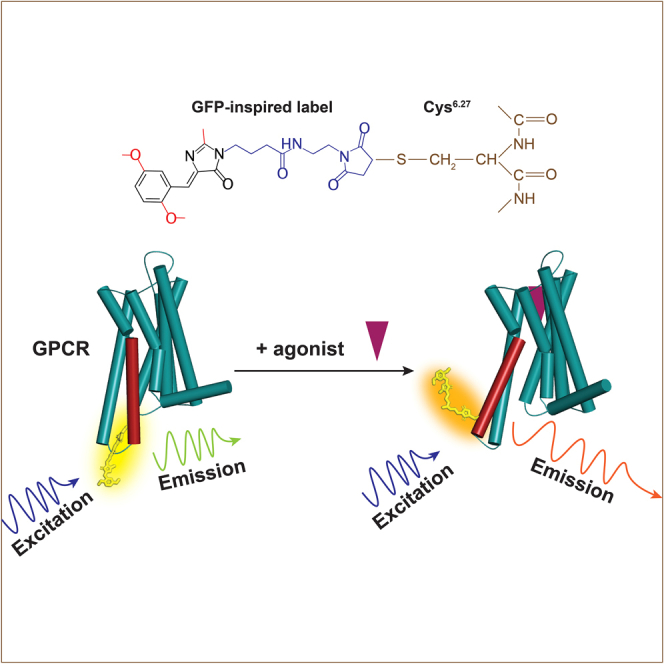
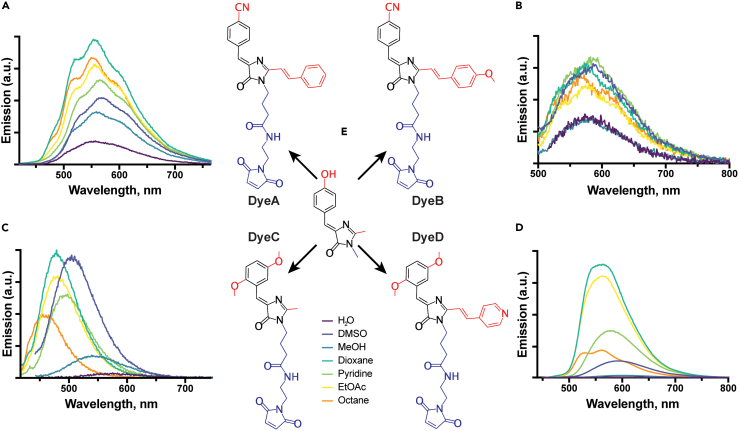
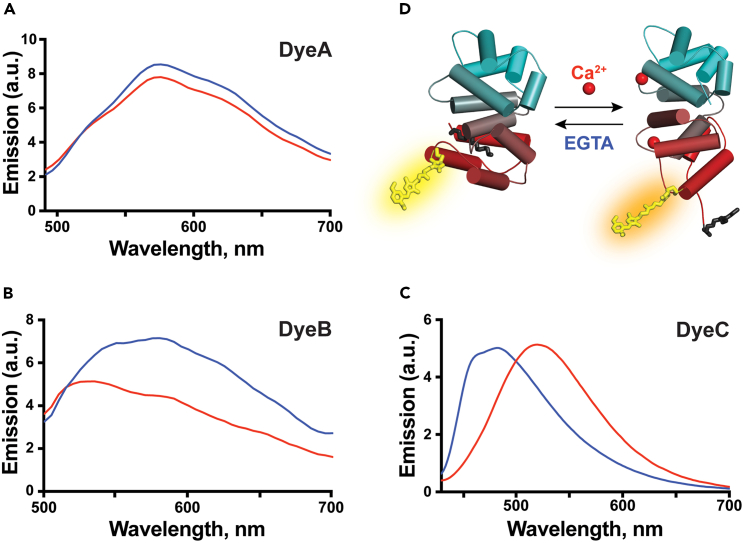
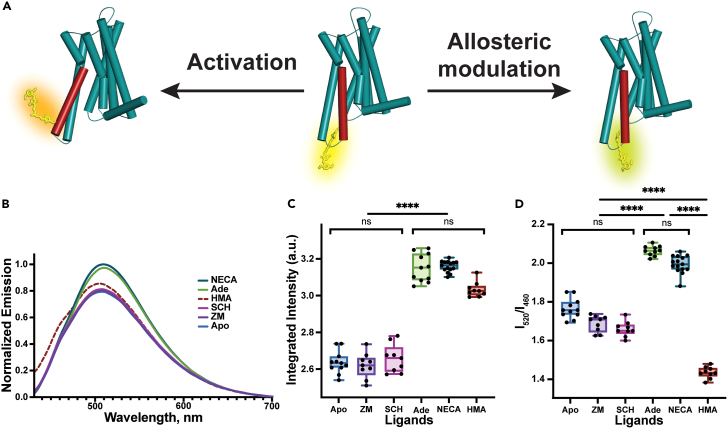
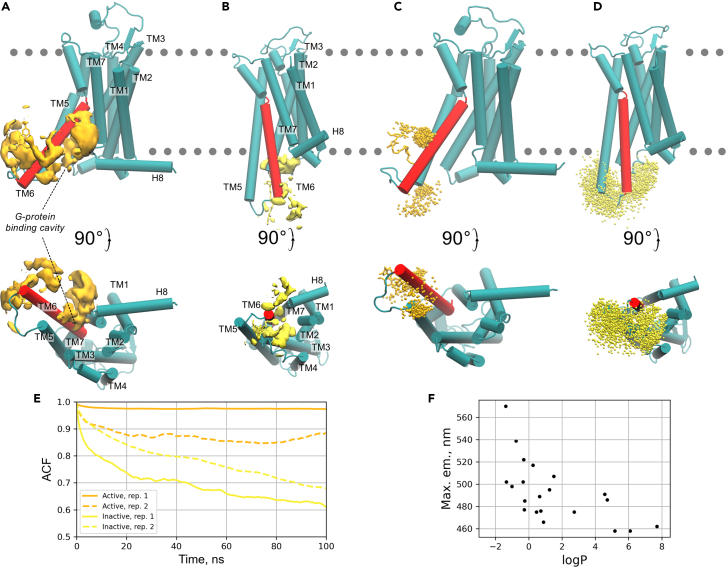
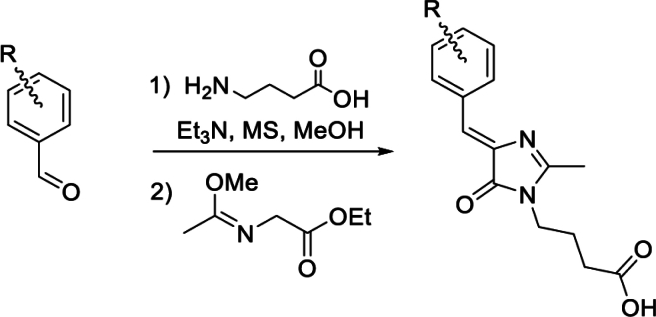
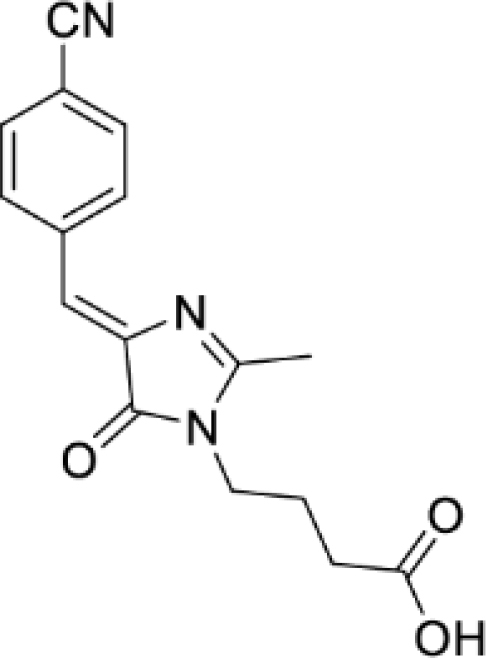
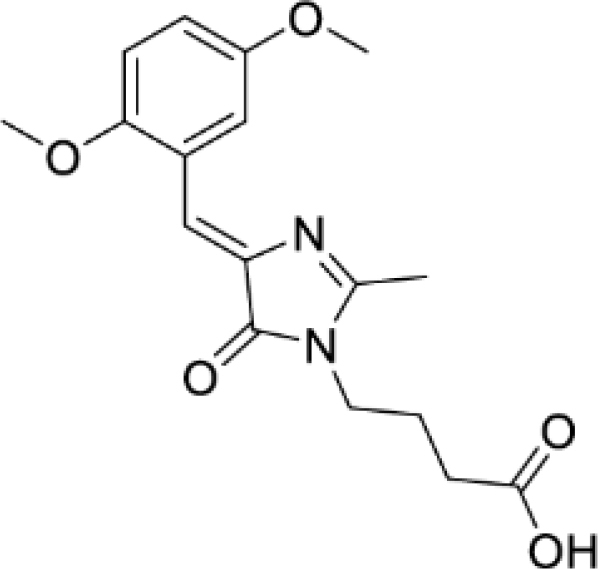
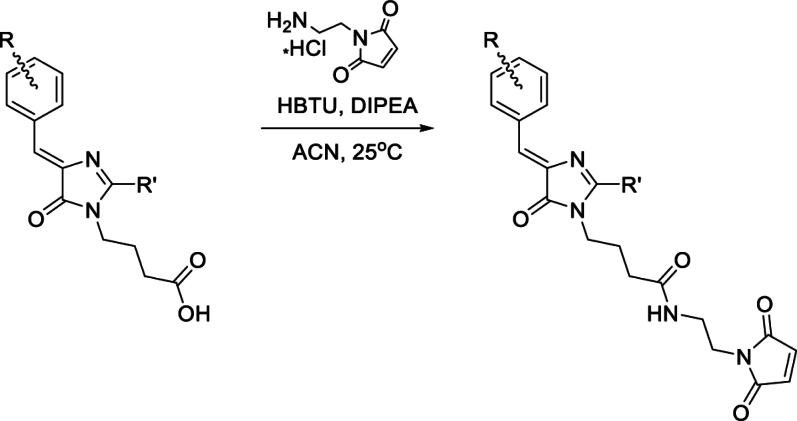
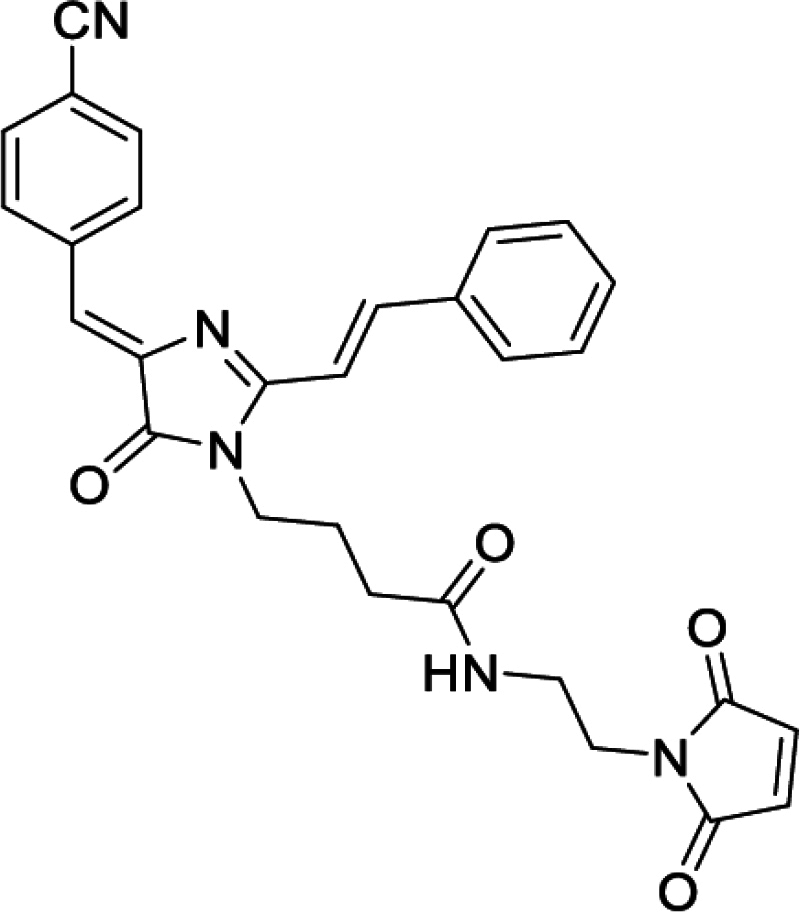
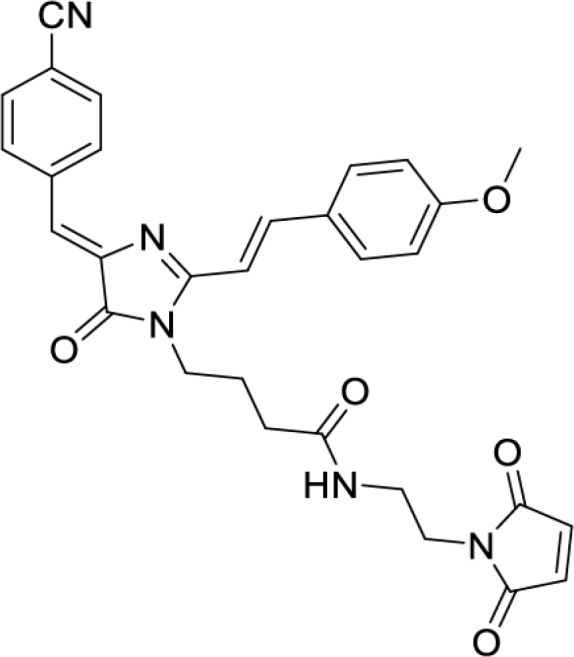
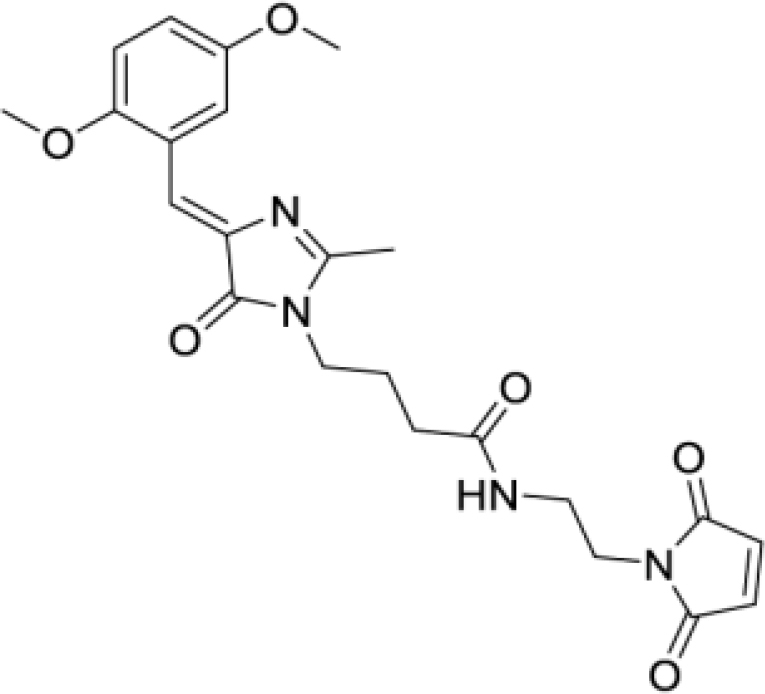
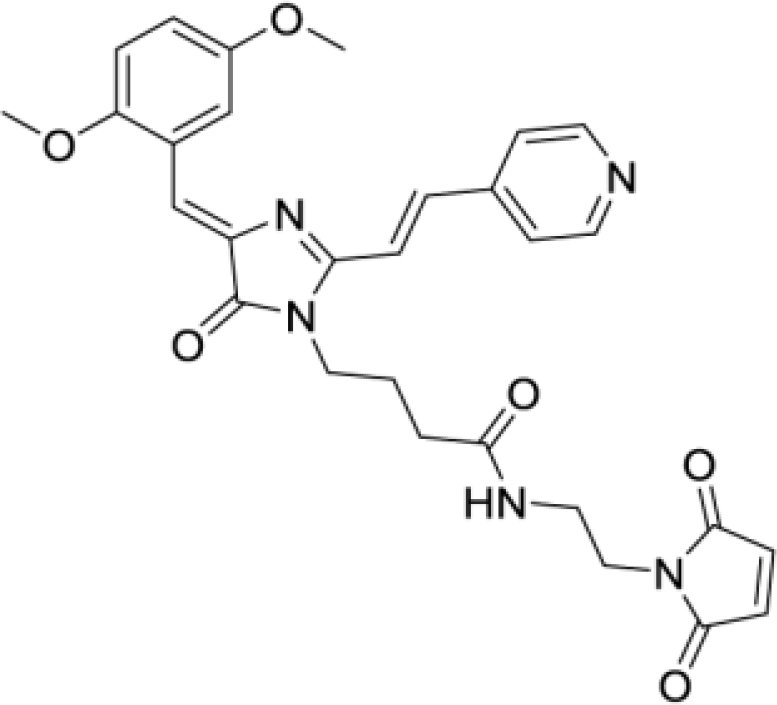
Solvatochromic compounds have emerged as valuable environment-sensitive probes for biological research. Here we used thiol-reactive solvatochromic analogs of the green fluorescent protein (GFP) chromophore to track conformational changes in two proteins, recoverin and the A2A adenosine receptor (A2AAR). Two dyes showed Ca2+-induced fluorescence changes when attached to recoverin. Our best-performing dye, DyeC, exhibited agonist-induced changes in both intensity and shape of its fluorescence spectrum when attached to A2AAR; none of these effects were observed with other common environment-sensitive dyes. Molecular dynamics simulations showed that activation of the A2AAR led to a more confined and hydrophilic environment for DyeC. Additionally, an allosteric modulator of A2AAR induced distinct fluorescence changes in the DyeC spectrum, indicating a unique receptor conformation. Our study demonstrated that GFP-inspired dyes are effective for detecting structural changes in G protein-coupled receptors (GPCRs), offering advantages such as intensity-based and ratiometric tracking, redshifted fluorescence spectra, and sensitivity to allosteric modulation.

Keywords: Biochemistry; Biophysics; Structural biology.


Conflict of interest statement

The authors declare no competing interests.

Figures

None
Graphical abstract
Figure 1
Figure 1
Dye structures and their emission spectra in various solvents (A–D) Changes of the emission fluorescence spectra for free DyeA (A), DyeB (B), DyeC (C), and DyeD (D) in solvents with different polarity and viscosity. The excitation wavelengths were 410 nm (DyeA), 430 nm (DyeB), 380 nm (DyeC), and 420 nm (DyeD). Complete results and additional information for the tested dyes are provided in Table S1. (E) The HBDI fluorescent core is shown in the center and four dyes as its derivatives; the maleimide groups, responsible for cysteine interaction, are colored in blue; the fluorescent core modifications are colored in red.
Figure 2
Figure 2
Ca2+-induced conformational and spectral changes of Rec labeled with DyeA, DyeB, and DyeC (A–C) The Ca2+-induced response of Rec with three BDI-derived labels (DyeA, DyeB, and DyeC). Blue curves correspond to samples in the presence of 100 μM CaCl2, and red curves correspond to calcium-free samples with 100 μM of chelator EGTA. The protein concentration was maintained at 10 μM. Excitation wavelengths were 440 nm, 460 nm, and 410 nm for DyeA, DyeB, and DyeC, respectively. (D) Structural rearrangements of labeled Rec induced by calcium ions. The structures of the calcium-free and calcium-bound forms are based on PDB IDs 1IKU and 1JSA, respectively., DyeC attached to the single native cysteine (C39) in Rec is shown in yellow, and the myristoyl group at the N terminus of Rec is shown in black. Rec is colored in a gradient from red on its N terminus to cyan on the C terminus.
Figure 3
Figure 3
Structural and spectral changes of A2AARL225C-DyeC induced by various ligands (A) Schematic representation of structural changes caused by agonists and the allosteric modulator HMA in A2AARL225C-DyeC. Structures of the active and inactive A2AAR are sketched from PDB IDs 6GDG and 3RFM, respectively., Agonist binding results in an outward shift of the intracellular part of the TM6. The structural effects of the allosteric modulator HMA remain unknown. (B) Emission spectra of A2AARL225C-DyeC bound to antagonists (ZM241385 and SCH58261), agonists (NECA and adenosine), allosteric modulator (HMA), and in the apo state. (C) Variation of the integrated intensity of A2AARL225C-DyeC bound to different ligands. The integrated intensity is quantified as the area under the fluorescence emission spectrum from 430 to 700 nm. (D) Variation of the intensity ratio I520/I460 for different ligands. Each condition in C and D was measured at least 9 times with protein from at least three independent purifications; each protein sample was mixed with the ligand independently. The data represent the mean ± SD. The protein concentration was maintained at 10 μM; all ligands were added at a saturating concentration of 100 μM. The significance level is given according to the ordinary one-way ANOVA with the post hoc Tukey HSD test: ∗∗p < 0.005, ∗p < 0.05, ns, not significant..
Figure 4
Figure 4
Molecular dynamics simulations of A2AARL225C-DyeC (A and B) Isosurfaces (yellow) delineate the low-free-energy regions (at +25 kJ/mol level relative to the global free energy minimum) explored by the proximal carbon atom of the dimethoxybenzene ring of DyeC label in the active (A) and inactive (B) states in metadynamics simulations. The A2AARL225C helices are labeled from TM1 to H8 (TM6 is colored in red), the G-protein binding site is labeled in the active state. (C and D) Positions of the dimethoxybenzene ring of the DyeC label in the active (C) and inactive (D) complexes throughout the unbiased (i.e., without any external forces applied) MD simulations shown every 0.1 ns as orange/yellow dots, respectively. Each system was simulated for 1,000 ns in two replicates. The positions of the lipid head groups are schematically indicated by the gray dotted line. (E) Autocorrelation functions (ACFs) calculated for a vector describing the DyeC label position in the unbiased simulations shown in (C) and (D). Higher values of ACF suggest slower reorientational dynamics of the label. Results for two replicates in the active/inactive states are shown in orange/yellow. (F) Correlation between fluorescence emission maximum of DyeC in different solvents and their partition coefficient, logP. The logP values were obtained from the PubChem/Chemeo databases, and provided in Table S1. The inverse correlation implies that the translocation of DyeC into the region of the polar head groups of lipids, as observed in the simulations of the active state, leads to a red shift in the fluorescence emission maximum.
None
None
None
None
None
None
None
None
None
None
None
None

References

    1. Zimmer M. Green fluorescent protein (GFP): applications, structure, and related photophysical behavior. Chem. Rev. 2002;102:759–781. - PubMed
    1. Walker C.L., Lukyanov K.A., Yampolsky I.V., Mishin A.S., Bommarius A.S., Duraj-Thatte A.M., Azizi B., Tolbert L.M., Solntsev K.M. Fluorescence imaging using synthetic GFP chromophores. Curr. Opin. Chem. Biol. 2015;27:64–74. - PubMed
    1. Smirnov A.Y., Perfilov M.M., Zaitseva E.R., Zagudaylova M.B., Zaitseva S.O., Mishin A.S., Baranov M.S. Design of red-shifted and environment-sensitive fluorogens based on GFP chromophore core. Dyes Pigm. 2020;177
    1. Ermakova Y.G., Sen T., Bogdanova Y.A., Smirnov A.Y., Baleeva N.S., Krylov A.I., Baranov M.S. Pyridinium Analogues of Green Fluorescent Protein Chromophore: Fluorogenic Dyes with Large Solvent-Dependent Stokes Shift. J. Phys. Chem. Lett. 2018;9:1958–1963. - PubMed
    1. Perfilov M.M., Zaitseva E.R., Smirnov A.Y., Mikhaylov A.A., Baleeva N.S., Myasnyanko I.N., Mishin A.S., Baranov M.S. Environment-sensitive fluorogens based on a GFP chromophore structural motif. Dyes Pigm. 2022;198

LinkOut - more resources