. 2024 Aug 2:15:1410082.
doi: 10.3389/fimmu.2024.1410082. eCollection 2024.

Hypoxia-inducible factor-1α promotes macrophage functional activities in protecting hypoxia-tolerant large yellow croaker (Larimichthys crocea) against Aeromonas hydrophila infection

Affiliations

Hypoxia-inducible factor-1α promotes macrophage functional activities in protecting hypoxia-tolerant large yellow croaker (Larimichthys crocea) against Aeromonas hydrophila infection

Yibo Zhang et al. Front Immunol. .

Abstract

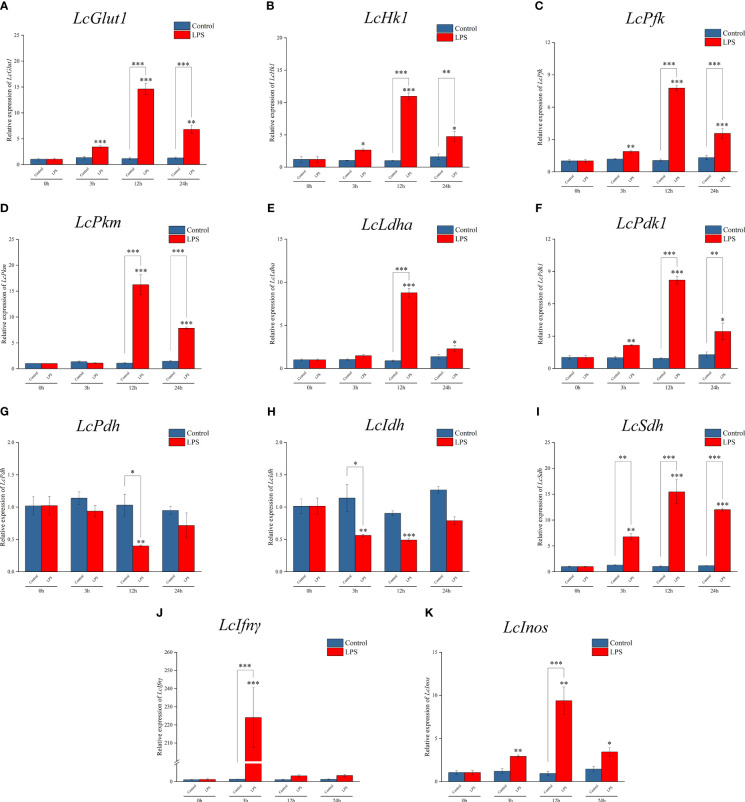
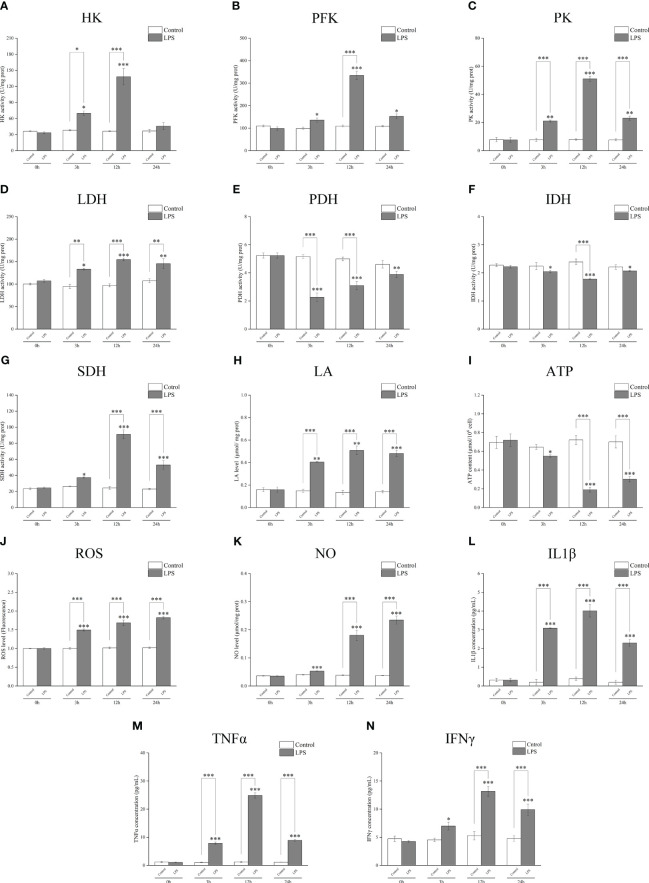
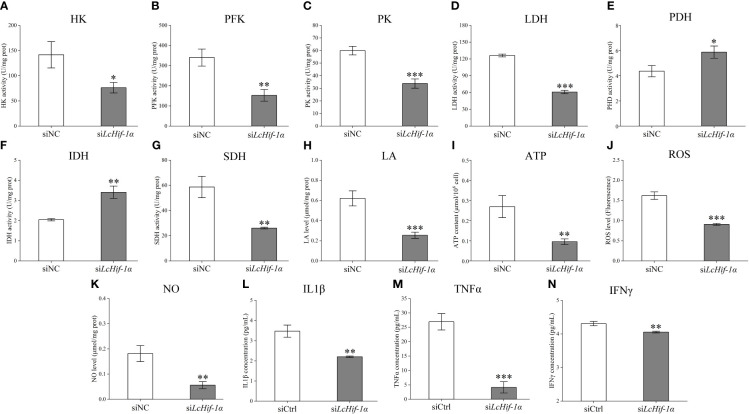
The immune system requires a high energy expenditure to resist pathogen invasion. Macrophages undergo metabolic reprogramming to meet these energy requirements and immunologic activity and polarize to M1-type macrophages. Understanding the metabolic pathway switching in large yellow croaker (Larimichthys crocea) macrophages in response to lipopolysaccharide (LPS) stimulation and whether this switching affects immunity is helpful in explaining the stronger immunity of hypoxia-tolerant L. crocea. In this study, transcript levels of glycolytic pathway genes (Glut1 and Pdk1), mRNA levels or enzyme activities of glycolytic enzymes [hexokinase (HK), phosphofructokinase (PFK), pyruvate kinase (PK), and lactate dehydrogenase A (LDHA)], aerobic respiratory enzymes [pyruvate dehydrogenase (PDH), isocitrate dehydrogenase (IDH), and succinate dehydrogenase (SDH)], metabolites [lactic acid (LA) and adenosine triphosphate (ATP)], levels of bactericidal products [reactive oxygen species (ROS) and nitric oxide (NO)], and transcripts and level changes of inflammatory factors [IL1β, TNFα, and interferon (IFN) γ] were detected in LPS-stimulated L. crocea head kidney macrophages. We showed that glycolysis was significantly induced, the tricarboxylic acid (TCA) cycle was inhibited, and metabolic reprogramming occurred, showing the Warburg effect when immune cells were activated. To determine the potential regulatory mechanism behind these changes, LcHIF-1α was detected and found to be significantly induced and transferred to the nucleus after LPS stimulation. LcHif-1α interference led to a significant reduction in glycolytic pathway gene transcript expression, enzyme activity, metabolites, bactericidal substances, and inflammatory factor levels; a significant increase in the aerobic respiration enzymes; and decreased migration, invasion, and phagocytosis. Further ultrastructural observation by electron microscopy showed that fewer microspheres contained phagocytes and that more cells were damaged after LcHif-1α interference. LcHif-1α overexpression L. crocea head kidney macrophages showed the opposite trend, and promoter activities of Ldha and Il1β were significantly enhanced after LcHif-1α overexpression in HEK293T cells. Our data showed that LcHIF-1α acted as a metabolic switch in L. crocea macrophages and was important in polarization. Hypoxia-tolerant L. crocea head kidney showed a stronger Warburg effect and inhibited the TCA cycle, higher metabolites, and bactericidal substance levels. These results collectively revealed that LcHif-1α may promote the functional activities of head kidney macrophages in protecting hypoxia-tolerant L. crocea from Aeromonas hydrophila infection.

Keywords: Larimichthys crocea; glycolysis; immunity; macrophages; metabolic reprogramming.


Conflict of interest statement

The authors declare that the research was conducted in the absence of any commercial or financial relationships that could be construed as a potential conflict of interest.

Figures

Figure 1
Figure 1
Expression patterns of metabolic and immune-related genes in Larimichthys crocea head kidney macrophages after LPS stimulation. mRNA expressions of LcGlut1 (A), LcHk1 (B), LcPfk (C), LcPkm (D), LcLdha (E), LcPdk1 (F), LcPdh (G), LcIdh (H), LcSdh (I), LcIfnγ (J), and LcInos (K) in macrophages at 0 h, 3 h, 12 h, and 24 h following LPS stimulation or the control (n = 3). LPS, lipopolysaccharide. “*” indicates P < 0.05, “**” indicates P < 0.01, and “***” indicates P < 0.001.
Figure 2
Figure 2
Changes in LcHIF-1α and LcCOX2 protein in Larimichthys crocea head kidney macrophages after LPS stimulation. Changes in the level of LcHIF-1α (A, B, D) and LcCOX2 (A, C, E) mRNA (n = 3) and protein expression in macrophages after 0-, 3-, 12-, and 24-h incubation with LPS. Subcellular localization of LcHIF-1α in macrophages exposed to LPS for 12 h (F). LPS, lipopolysaccharide. “*” indicates P < 0.05,“**” indicates P < 0.01, and “***” indicates P < 0.001. The different letters indicate significant differences (P < 0.05).
Figure 3
Figure 3
Detection of the activities of the key metabolic enzymes and levels of metabolites and inflammatory factors in Larimichthys crocea head kidney macrophages after LPS stimulation. Changes in activities of HK (A), PFK (B), PK (C), LDH (D), PDH (E), IDH (F), and SDH (G) and levels of LA (H), ATP (I), ROS (J), NO (K), IL1β (L), TNFα (M), and IFNγ (N) in macrophages after 0 h, 3 h, 12 h, and 24 h of LPS incubation (n = 3). LPS, lipopolysaccharide; HK, hexokinase; PFK, phosphofructokinase; PK, pyruvate kinase; LDH, lactate dehydrogenase; PDH, pyruvate dehydrogenase; IDH, isocitrate dehydrogenase; SDH, succinate dehydrogenase; LA, lactic acid; ATP, adenosine triphosphate; ROS, reactive oxygen species; NO, nitric oxide. “*” indicates P < 0.05,“**” indicates P < 0.01, and “***” indicates P < 0.001.
Figure 4
Figure 4
Changes in expressions of LcHIF-1α and LcCOX2 in Larimichthys crocea head kidney macrophages after LcHif-1α interference or overexpression following 12-h LPS stimulation. Changes in level of LcHif-1α mRNA expression (n = 3) and LcHIF-1α and LcCOX2 protein expression in macrophages after LcHif-1α interference (A) or overexpression (B) following 12-h LPS stimulation. Subcellular localization of LcHif-1α in macrophages after LcHif-1α interference or overexpression following 12-h LPS stimulation (C). DIC, differential interference contrast; LPS, lipopolysaccharide. “*” indicates P < 0.05,“**” indicates P < 0.01, and “***” indicates P < 0.001.
Figure 5
Figure 5
Expression patterns of metabolic and immune-related genes in Larimichthys crocea head kidney macrophages after LcHif-1α interference following 12-h LPS stimulation. mRNA expressions of LcGlut1 (A), LcHk1 (B), LcPfk (C), LcPkm (D), LcLdha (E), LcPdk1 (F), LcPdh (G), LcIdh (H), LcSdh (I), LcCox2 (J), LcIl1β (K), LcTnfα (L), LcIfnγ (M), and LcInos (N) in macrophages after LcHif-1α interference following 12-h LPS stimulation (n = 3). LPS, lipopolysaccharide. “*” indicates P < 0.05,“**” indicates P < 0.01, and “***” indicates P < 0.001.
Figure 6
Figure 6
Detection of the activities of the key metabolic enzymes and levels of metabolites and inflammatory factors in Larimichthys crocea head kidney macrophages after LcHif-1α interference following 12-h LPS stimulation. Changes in activities of HK (A), PFK (B), PK (C), LDH (D), PDH (E), IDH (F), and SDH (G) and levels of LA (H), ATP (I), ROS (J), NO (K), IL1β (L), TNFα (M), and IFNγ (N) in macrophages after LcHif-1α interference following 12-h LPS stimulation (n = 3). LPS, lipopolysaccharide; HK, hexokinase; PFK, phosphofructokinase; PK, pyruvate kinase; LDH, lactate dehydrogenase; PDH, pyruvate dehydrogenase; IDH, isocitrate dehydrogenase; SDH, succinate dehydrogenase; LA, lactic acid; ATP, adenosine triphosphate; ROS, reactive oxygen species; NO, nitric oxide. “*” indicates P < 0.05,“**” indicates P < 0.01, and “***” indicates P < 0.001.
Figure 7
Figure 7
Functional activity of Larimichthys crocea head kidney macrophages after LcHif-1α interference following 12-h LPS stimulation. Laser confocal microscopy analysis of ROS change in macrophages after LcHif-1α interference following 12-h LPS stimulation (A). Analysis of migration (B), invasion (C), and phagocytosis (D) of macrophages after LcHif-1α interference or overexpression (E–H) following 12-h LPS stimulation (n = 3). DCFH-DA, dichloro-dihydro-fluorescein diacetate; DIC, differential interference contrast; MFI, mean fluorescence intensity; TMRM, tetramethyl rhodamine methyl ester; LPS, lipopolysaccharide; ROS, reactive oxygen species. “*” indicates P < 0.05,“**” indicates P < 0.01, and “***” indicates P < 0.001.
Figure 8
Figure 8
Phagocytosis of Larimichthys crocea head kidney macrophages after LcHif-1α interference following 12-h LPS stimulation. (A, B) The ultrastructure of L. crocea head kidney macrophages transfected with siNC and stimulated by LPS for 12 h. (C, D) The ultrastructure of L. crocea head kidney macrophages transfected with siLcHif-1α and stimulated by LPS for 12 h. N, nucleus; NO, nucleoli; L, lysosome; P, phagocyte; AL, autolysosome; M, mitochondria; MC, mitochondrial crest; ER, endoplasmic reticulum; EB, phagocytic microsphere. The red dashed ellipse shows the concave nuclear membrane. LPS, lipopolysaccharide.
Figure 9
Figure 9
Changes in transcriptional activities of LcLdha and LcIl1β promoters after LcHif-1α overexpression of HEK293T. Changes in transcription activity of LcLdha promoter after LcHif-1α overexpression in HEK293T after 12-h LPS stimulation (A). Changes in transcription activity of LcIl1β promoter after LcHif-1α overexpression in HEK293T after 12-h LPS stimulation (B) (n = 3). LPS, lipopolysaccharide. “*” indicates P < 0.05,“**” indicates P < 0.01, and “***” indicates P < 0.001.
Figure 10
Figure 10
Changes of LcHIF-1α and LcCOX2 protein, activities of the key metabolic enzymes, and levels of metabolites and inflammatory factors in the head kidney of hypoxia-tolerant population (T) and normal population (N) of Larimichthys crocea after Aeromonas hydrophila infection. Changes in LcHif-1α and LcCOX2 protein (A–E); activities of HK (F), PFK (G), PK (H), LDH (I), PDH (J), IDH (K), and SDH (L); and levels of LA (M), ATP (N), ROS (O), NO (P), IL1β (Q), TNFα (R), and IFNγ (S) in the head kidney of N and T after A. hydrophila infection for 24 h (n = 3). LPS, lipopolysaccharide; HK, hexokinase; PFK, phosphofructokinase; PK, pyruvate kinase; LDH, lactate dehydrogenase; PDH, pyruvate dehydrogenase; IDH, isocitrate dehydrogenase; SDH, succinate dehydrogenase; LA, lactic acid; ATP, adenosine triphosphate; ROS, reactive oxygen species; NO, nitric oxide. “*” indicates P < 0.05,“**” indicates P < 0.01, and “***” indicates P < 0.001.
Figure 11
Figure 11
Proposed working model of HIF-1α promotes macrophage functional activities in protecting hypoxia-tolerant Larimichthys crocea against Aeromonas hydrophila infection. LcHIF-1α induced by LPS; LPS leading to the nuclear translocation of LcHIF-1α, which promotes levels of glycolytic pathway enzymes and glycolytic metabolites and inhibits the aerobic respiratory enzymes, making macrophages show Warburg effect. LcHIF-1α enhances levels of bactericidal products, inflammatory factors, and M1-type maker genes and plays a role in migration, invasion, and phagocytosis of macrophages to achieve its M1 polarization state and sterilization ability. LcHIF-1α controls the transcription of LcLdha and LcIl1β by binding to their promoter. LcHIF-1α may be involved in the metabolic transformation of macrophages in the head kidney of the T of L. crocea and promote its functional activity and defense against A. hydrophila infection. The red arrows indicate the enhancing effects, and the green arrows show the suppressing effects.

References

    1. Zhang ZX, Wang ZY, Fang M, Ye K, Tang X, Zhang DL. Genome-wide association analysis on host resistance against the rotten body disease in a naturally infected population of large yellow croaker larimichthys crocea . Aquaculture. (2022) 548:737615. doi: 10.1016/j.aquaculture.2021.737615 - DOI
    1. Wang Q-F, Shen W-L, Hou C-C, Liu C, Wu X-F, Zhu J-Q. Physiological responses and changes in gene expression in the large yellow croaker larimichthys crocea following exposure to hypoxia. Chemosphere. (2017) 169:418–27. doi: 10.1016/j.chemosphere.2016.11.099 - DOI - PubMed
    1. Ding J, Zhang Y, Wang J, Liu C, Gao X, Wu Y, et al. . Genome-wide association study identified candidate snps and genes associated with hypoxia tolerance in large yellow croaker (Larimichthys crocea). Aquaculture. (2022) 560:738472. doi: 10.1016/j.aquaculture.2022.738472 - DOI
    1. Ding J, Liu C, Luo S, Zhang Y, Gao X, Wu X, et al. . Transcriptome and physiology analysis identify key metabolic changes in the liver of the large yellow croaker (Larimichthys crocea) in response to acute hypoxia. Ecotoxicol Environ Saf. (2020) 189:109957. doi: 10.1016/j.ecoenv.2019.109957 - DOI - PubMed
    1. Ding J, Gao Z, Wang J, Zhang Y, Wang X, Wu X, et al. . Genome-wide association and transcriptome analysis provide the snps and molecular insights into the hypoxia tolerance in large yellow croaker (Larimichthys crocea). Aquaculture. (2023) 573:739547. doi: 10.1016/j.aquaculture.2023.739547 - DOI

MeSH terms

Substances

LinkOut - more resources