

Assessing energy efficiency, regional disparities in production technology, and factors influencing total factor energy productivity change in the agricultural sector of China
- PMID: 39157320
- PMCID: PMC11328041
- DOI: 10.1016/j.heliyon.2024.e35043
Assessing energy efficiency, regional disparities in production technology, and factors influencing total factor energy productivity change in the agricultural sector of China
Abstract
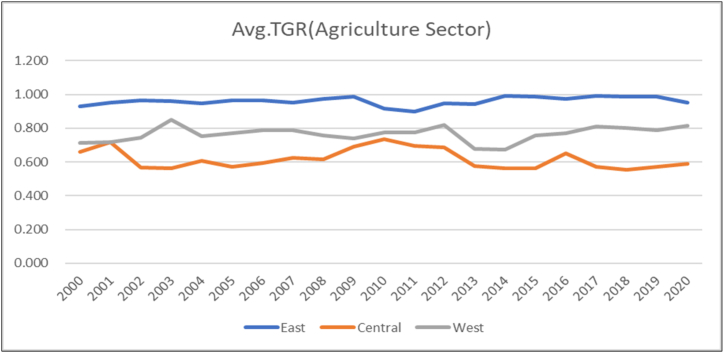
Efficiently utilizing the energy resources in the agriculture sector to produce more agricultural output with minimum environmental degradation is a shared global challenge. The Chinese government has introduced various policies aimed at enhancing energy efficiency (EE) and total factor energy productivity (TFEP) while addressing regional technological disparities in the agricultural sector. This study utilized DEA Super-SBM, Meta frontier Analysis, and the Malmquist-Luenberger index to assess energy efficiency, changes in total factor energy productivity, and the regional technology gap ratio (TGR) across 30 provinces in mainland China and three distinct regions during the period from 2000 to 2020. The findings reveal that the average EE in China's agricultural sector is 0.8492, indicating that, on average, there is a 15.08 % potential for improvement in EE growth within the sector. Qinghai (1.5828), Shanghai (1.3716), and Hainan (1.3582) are found to be the top 3 performers with the highest EE levels. The Eastern region demonstrates high excellence in EE, with a value of 1.0532. The TGR value of Zhejiang indicates the superior production technology utilized in the agriculture sector to utilize energy resources efficiently. Except for Zhejiang, the TGR of Liaoning, Jiangsu, Shanghai, Guangdong, Ningxia, and Hainan is above 0.96 and near 1, indicating superior production technology in the agriculture sector of China. The Technology Gap Ratio (TGR) of China's eastern region is superior to that of the central and western regions, consistently approaching 1. This suggests that the eastern provinces possess more advanced agricultural technologies, allowing them to optimize resource utilization for maximum output. The Malmquist-Luenberger index (MLI) score of 1.103 indicates a 10.3 % growth in the total factor energy productivity of China's agricultural sector. Further analysis reveals that this growth is primarily driven by technological change (TC), with a TC value of 1.080 surpassing the efficiency change (EC) value of 1.028. Among the three agricultural regions, the eastern region exhibits the highest total factor energy productivity. Specifically, Zhejiang (1.23), Shanghai (1.197), Liaoning (1.184), and Hebei (1.147) are identified as the top performers in total factor energy productivity growth in China's agricultural sector. Additionally, the Kruskal-Wallis test confirmed statistically significant differences in EE and TGR among the three regions.
Keywords: Agricultural sector; Chinese provinces; Energy efficiency; Technology gap ratio; Total factor energy productivity.
© 2024 The Author(s).
Conflict of interest statement
The authors declare that they have no known competing financial interests or personal relationships that could have appeared to influence the work reported in this paper.
Figures


References
-
- Anwar A., Sinha A., Sharif A., Siddique M., Irshad S., Anwar W., Malik S. The nexus between urbanization, renewable energy consumption, financial development, and CO2 emissions: evidence from selected Asian countries. Environ. Dev. Sustain. 2022 doi: 10.1007/s10668-021-01716-2. - DOI
-
- Wang J., Zhou F., Xie A. The impact of integrated development of agriculture and tourism on rural ecological environment quality. Wireless Commun. Mobile Comput. 2022 doi: 10.1155/2022/6113324. - DOI
-
- Kalogiannidis S., Papadopoulou C.I., Loizou E., Chatzitheodoridis F. Risk, vulnerability, and resilience in agriculture and their impact on sustainable rural economy development: a case study of Greece. Agriculture. 2023 doi: 10.3390/agriculture13061222. - DOI
-
- Solanki S., Singh S., Inumula K.M. Agricultural exports and performance of agricultural firms in India: an empirical analysis using system GMM. Asian Econ. Financ. Rev. 2022 doi: 10.55493/5002.V12I2.4431. - DOI
LinkOut - more resources
Full Text Sources
Miscellaneous
