. 2024 Jul;3(7):857-868.
doi: 10.1038/s44161-024-00489-x. Epub 2024 Jun 18.

Assessing the arrhythmogenic propensity of fibrotic substrate using digital twins to inform a mechanisms-based atrial fibrillation ablation strategy

Affiliations

Assessing the arrhythmogenic propensity of fibrotic substrate using digital twins to inform a mechanisms-based atrial fibrillation ablation strategy

Kensuke Sakata et al. Nat Cardiovasc Res. 2024 Jul.

Abstract

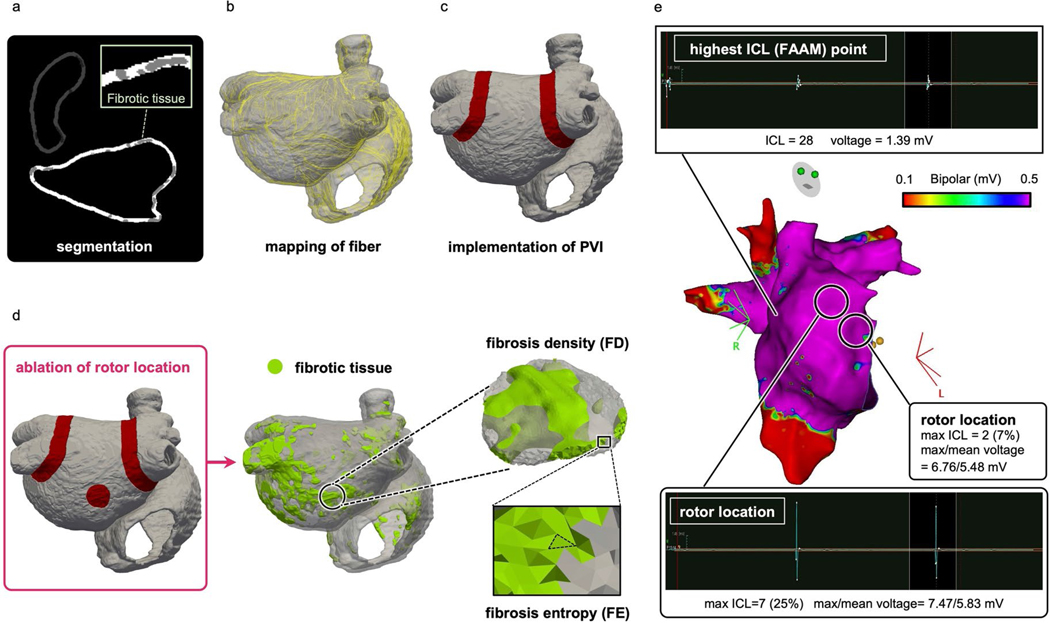
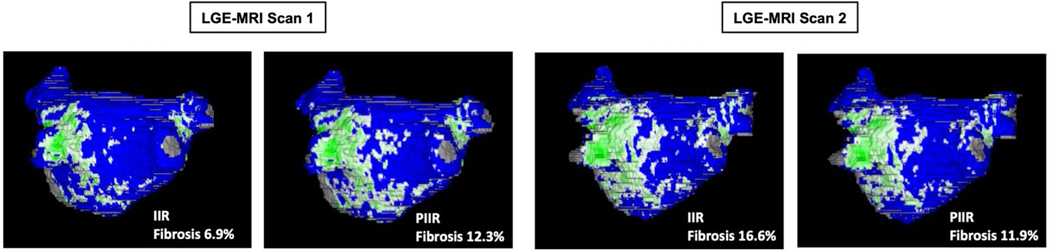
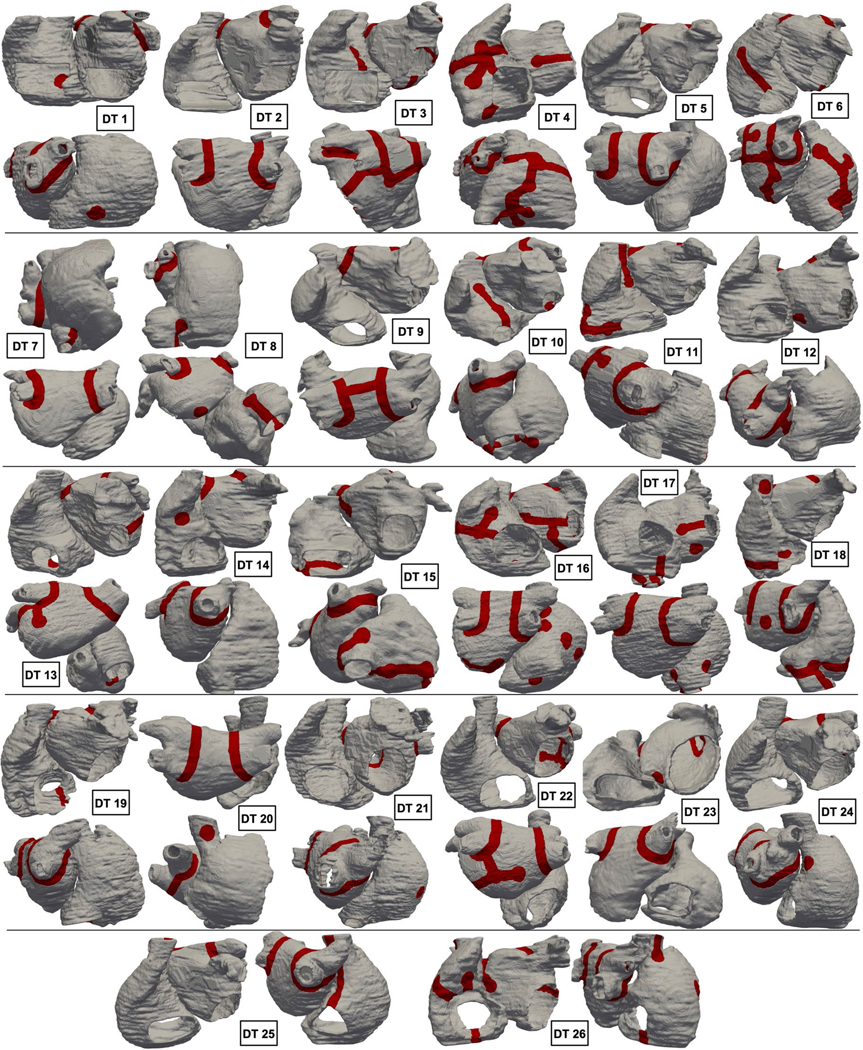
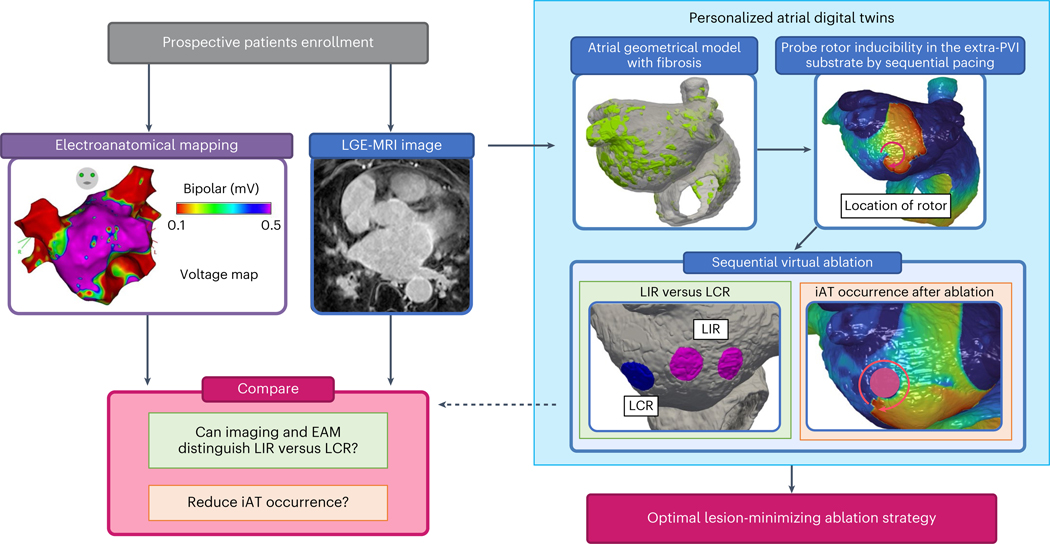
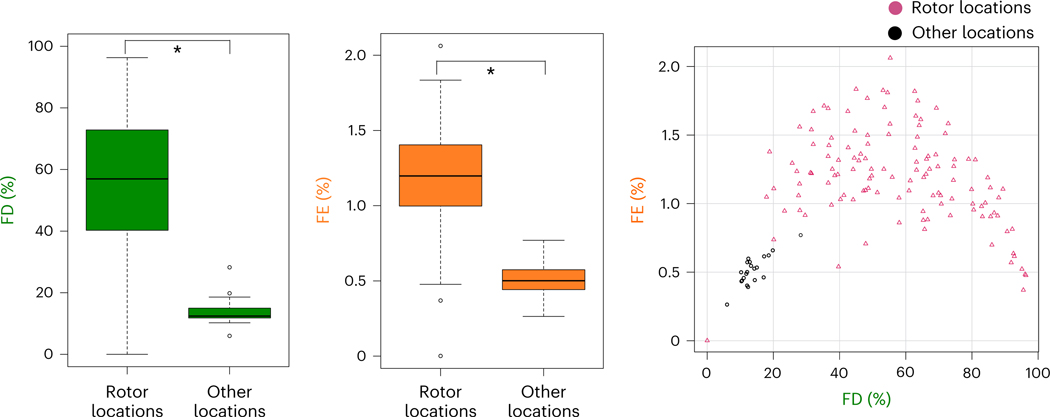
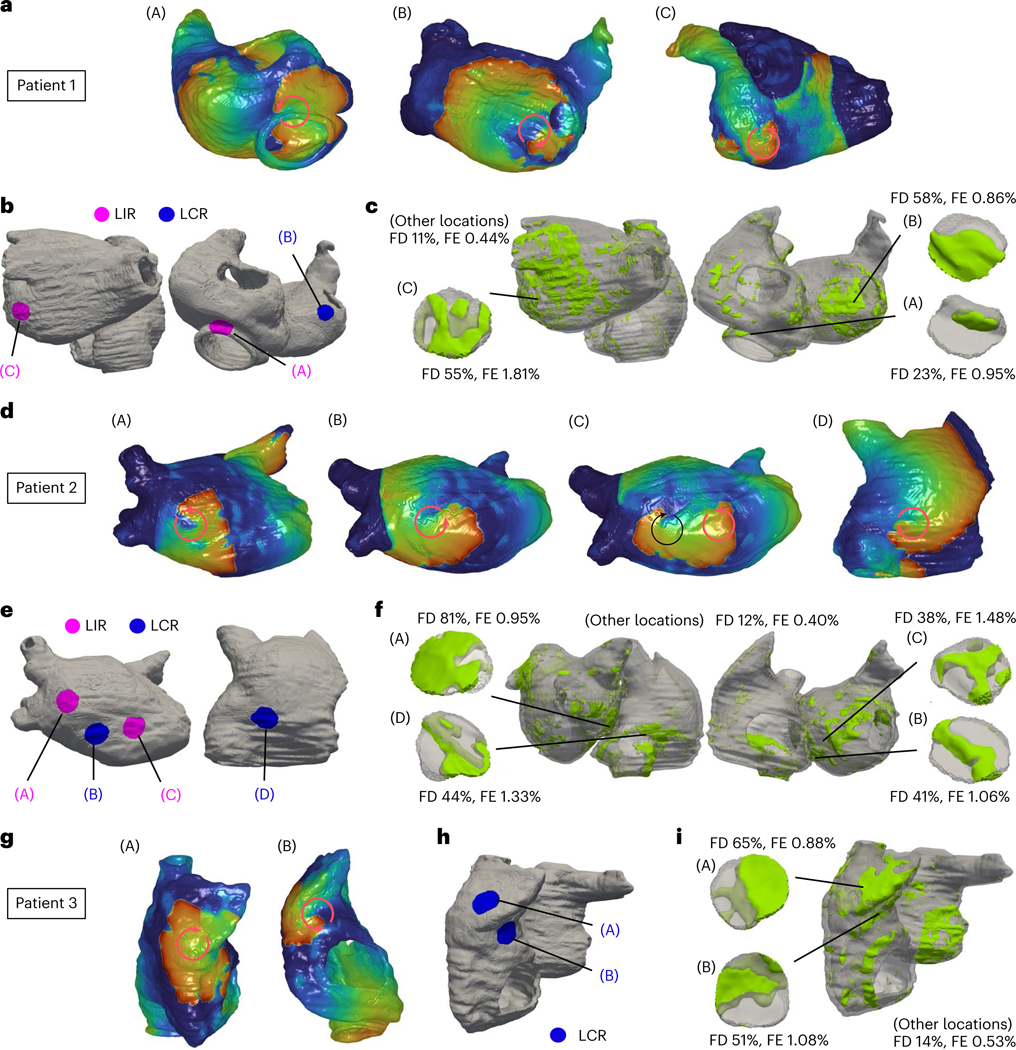
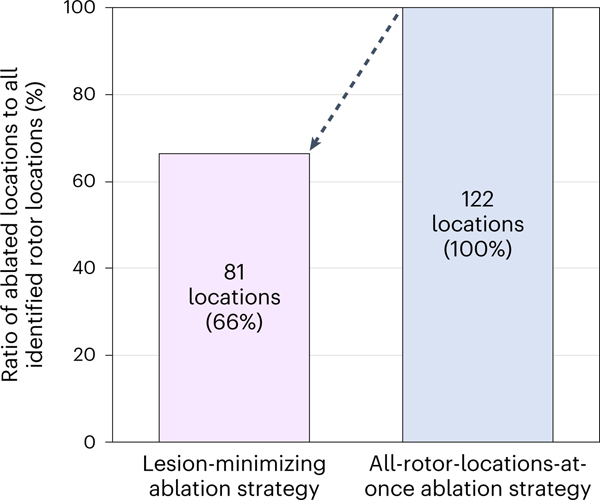
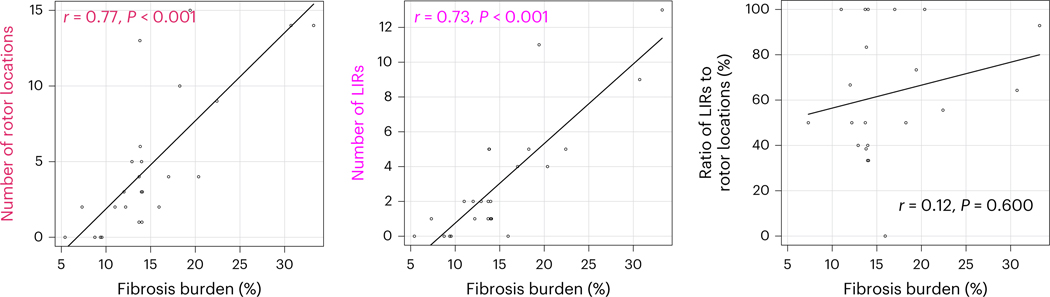
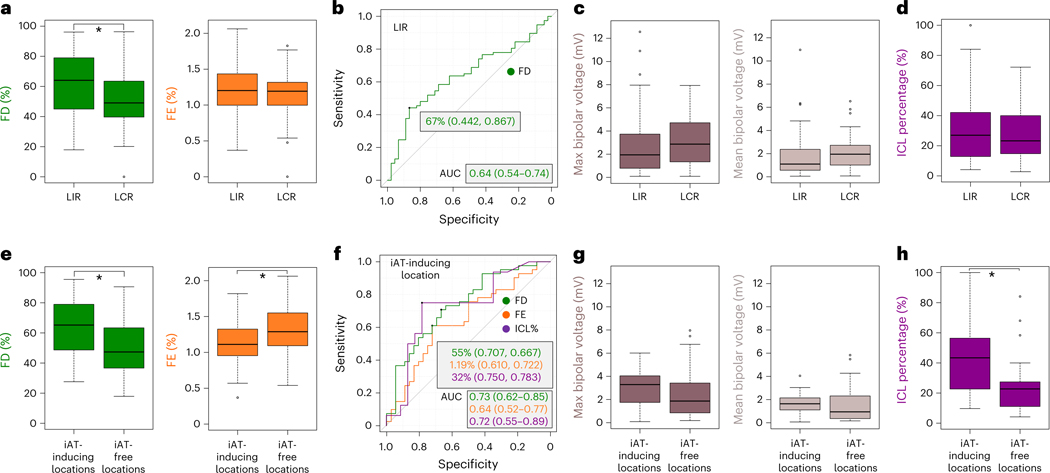
Atrial fibrillation (AF), the most common heart rhythm disorder, may cause stroke and heart failure. For patients with persistent AF with fibrosis proliferation, the standard AF treatment-pulmonary vein isolation-has poor outcomes, necessitating redo procedures, owing to insufficient understanding of what constitutes good targets in fibrotic substrates. Here we present a prospective clinical and personalized digital twin study that characterizes the arrhythmogenic properties of persistent AF substrates and uncovers locations possessing rotor-attracting capabilities. Among these, a portion needs to be ablated to render the substrate not inducible for rotors, but the rest (37%) lose rotor-attracting capabilities when another location is ablated. Leveraging digital twin mechanistic insights, we suggest ablation targets that eliminate arrhythmia propensity with minimum lesions while also minimizing the risk of iatrogenic tachycardia and AF recurrence. Our findings provide further evidence regarding the appropriate substrate ablation targets in persistent AF, opening the door for effective strategies to mitigate patients' AF burden.


Figures

Extended Data Fig. 1 |
Extended Data Fig. 1 |. Distribution of extra-PVI rotor locations in the 12 atrial regions.
a: Rotor locations. b: LIRs and LCRs.
Extended Data Fig. 2 |
Extended Data Fig. 2 |. Ablation lesions in three representative DTs (Patients 1–3).
Distance between ablated rotor location (red circles) and non-conductive barriers including PVI lines (red lines) is shown with black arrows.
Extended Data Fig. 3 |
Extended Data Fig. 3 |. Difference in fibrosis distribution between redo and de novo procedures.
a: Comparison of FD (green) and FE (orange) values at rotor locations in patients with redo and de-novo procedures; 65% (44–80) vs. 49% (37–64) for FD (redo, n = 74; de-novo, n = 48; independent samples; data are presented as median (Q1-Q3) with min and max; U = 2300, p = 0.006; two-sided Mann-Whitney U test without adjustments); 1.09% (0.91–1.28) vs. 1.34% (1.20–1.54) for FE (redo, n = 74; de-novo, n = 48; independent samples; data are presented as median (Q1-Q3) with min and max; U = 948, p = 0.000015; two-sided Mann-Whitney U test without adjustments). *p < 0.05. b: The nine of the 13 patients with redo procedure included in the analysis had 74 extra-PVI rotors in total. The FD was significantly higher at LIRs than LCRs; 71% (57–85) vs. 48% (39–60) (LIRs, n = 46; LCRs, n = 28; independent samples; data are presented as median (Q1-Q3) with min and max; U = 955, p = 0.0004; two-sided Mann-Whitney U test without adjustments). The FE at LIRs was comparable to that at LCRs; 1.08% (0.91–1.32) vs. 1.09% (0.93–1.25) (LIRs, n = 46; LCRs, n = 28; independent samples; data are presented as median (Q1-Q3) with min and max; U = 645, p = 0.996; two-sided Mann-Whitney U test without adjustments). Regarding iAT, the FD at the former was significantly higher than that at the latter; 69% (56–81) vs. 49% (38–62) (iAT-inducing locations, n = 29; iAT-free locations, n = 14; independent samples; data are presented as median (Q1-Q3) with min and max; U = 319, p = 0.002; two-sided Mann-Whitney U test without adjustments). Moreover, the FE was significantly lower at the former than the latter; 1.06% (0.91–1.19) vs. 1.24% (1.10–1.67) for FE (iAT-inducing locations, n = 29; iAT-free locations, n = 14; independent samples; data are presented as median (Q1-Q3) with min and max; U = 115, p = 0.022; two-sided Mann-Whitney U test without adjustments). The remaining 4 patients with redo procedure did not have extra-PVI targets. *p < 0.05. c: For patients with de-novo procedures, the 12 out of 13 patients had 48 extra-PVI rotors in total. Both the FD and FE at LIRs were comparable to those at LCRs; 48% (34–64) vs. 53% (43–64) for FD; 1.38% (1.21–1.55) vs. 1.25% (1.11–1.49) for FE (LIR, n = 31; LCRs, n = 17; independent samples; data are presented as median (Q1-Q3) min and max; U = 238, p = 0.594 and U = 305, p = 0.381, respectively; two-sided Mann-Whitney U test without adjustments). Similarly, among 34 rotor locations in the extra-PVI substrate, both the FD and FE at the former were also comparable to those at the latter; 55% (45–65) vs. 46% (37–62) for FD; 1.38% (1.21–1.63) vs. 1.35% (1.13–1.50) for FE (iAT-inducing locations, n = 12; iAT-free locations, n = 22; independent samples; data are presented as median (Q1-Q3) with min and max; U = 167, p = 0.217 and U = 151, p = 0.511, respectively; two-sided Mann-Whitney U test without adjustments). However, compared to the sample size of rotor locations identified in patients with redo procedures, the smaller sample size of those identified in patients with the de novo procedures makes it difficult to interpret.
Extended Data Fig. 4 |
Extended Data Fig. 4 |. Difference in iAT occurrence at ablated rotor locations in one patient.
Top panel: An induced rotor with counterclockwise propagation (upper row), and a planar propagation around the lesion without iAT occurrence. Pacing sites are the same pre- and post-ablation (lower row). Bottom panel: Another induced rotor with clockwise propagation (upper row), and iAT occurrence with clockwise macro-reentry around the lesion following a unidirectional conduction block at the vicinity of the lesion (lower row).
Extended Data Fig. 5 |
Extended Data Fig. 5 |. Personalized atrial DTs.
a: Bi-atrial segmentation of LGE-MRI images with fibrotic tissue in gray. b: Fiber mapping (yellow lines) in a DT. c: Implementation of PVI ablation lines (red). d: Calculation of FD and FE at ablated rotor locations (red circle). e: Top image: Voltage amplitude and FAAM potentials of bipolar electrograms with the highest ICL percentage recorded at the mapping point. Middle image: An EAM map created using the CARTO system. Bottom image: Voltage amplitude and FAAM potentials of bipolar electrograms at rotor locations.
Extended Data Fig. 6 |
Extended Data Fig. 6 |. Reproducibility of LA fibrosis assessment using IIR and PIIR methods.
The patient had two atrial 3D LGE scans during the same MRI session. Each scan was independently segmented by two experienced operators. IIR method with the widely used IIR threshold of 1.22 gave considerably different fibrosis values (6.9% and 16.6%) for scan 1 and 2. Whereas, the PIIR method gave similar fibrosis values (12.3% and 11.9%) for both scans. The PIIR threshold for scan 1 was 1.164 and the PIIR threshold for scan 2 was 1.263.
Extended Data Fig. 7 |
Extended Data Fig. 7 |. Final lesion-minimizing ablation sets for the patients in the cohort.
Lesions are shown in red.
Fig. 1 |
Fig. 1 |. Overview of the combined prospective clinical and personalized DT study.
In patients with PsAF enrolled prospectively, LGE-MRI images were acquired before the ablation procedure (blue panel, left). EAM maps were acquired during the procedure (purple panel, left). Right, light blue box, personalized digital twinning. A personalized atrial DT was constructed from LGE-MRI (top left image), and locations capable of sustaining rotors in the extra-PVI substrate were identified (top right image). LIRs, those capable of giving rise to sustained rotors and the preferred ablation targets for non-inducibility, are discerned from LCRs, those that lose their rotor-attracting capabilities when another rotor is eliminated (image within the green panel), and the likelihood of iAT occurrence at ablation locations is investigated (image within the orange panel). FD and FE values and EAM data were analyzed at these locations to uncover the features of LIRs and LCRs and of iAT-inducing locations (cranberry panel, left).
Fig. 2 |
Fig. 2 |. Fibrosis distribution at rotor locations identified in DT substrates.
Left, FD values in the substrate (rotor locations, n = 122; other locations, n = 21; independent samples; data are presented as median (Q1–Q3) with minimum and maximum; P = 1.22 × 10⁻¹²; two-sided Mann–Whitney U-test without adjustments). *P < 0.05. Middle, FE values in the substrate (rotor locations, n = 122; other locations, n = 21; independent samples; data are presented as median (Q1–Q3) with minimum and maximum; P = 1.67 × 10⁻¹¹; two-sided Mann–Whitney U-test without adjustments). Right, FD and FE values at rotor locations (cranberry triangles) and other locations (black circles).
Fig. 3 |
Fig. 3 |. Personalized DTs and ablation strategy for three representative patients (patients 1–3).
a,d,g, Identification of rotor location. The red color and the blue color in DTs indicate wave front and wave tail of reentrant propagation (circular arrows), respectively. b,e,h, Classification of rotor locations into LIRs and LCRs. c,f,i, Fibrosis distribution (in light green).
Fig. 4 |
Fig. 4 |. Minimizing ablation lesions with the new ablation strategy.
Ratio of the number of ablated rotor locations to that of identified rotor locations for the lesion-minimizing ablation strategy versus that for the all-rotor-locations-at-once ablation strategy.
Fig. 5 |
Fig. 5 |. Relationship between fibrosis burden and the number of rotor locations.
Left, strong correlation between fibrosis burden and number of rotor locations (P = 0.000005; two-sided Spearman’s rank correlation test). Middle, strong correlation between fibrosis burden and number of LIRs (P = 0.00003; two-sided Spearman’s rank correlation test). Right, no correlation between fibrosis burden and the ratio of the number of LIRs to that of rotor locations (P = 0.600; two-sided Spearman’s rank correlation test).
Fig. 6 |
Fig. 6 |. Relationship between types of rotor locations and (1) fibrosis distribution and (2) intra-atrial electrograms.
a, Comparison of FD and FE values at LIRs and LCRs (LIRs, n = 77; LCRs, n = 45; independent samples; data are presented as median (Q1–Q3) with minimum and maximum; P = 0.011 and P = 0.467, respectively; two-sided Mann–Whitney U-test without adjustments). *P < 0.05. b, ROC curve for predicting LIRs, with the FD cutoff value, the sensitivity and specificity values, and AUC (green). c, Comparison of the maximum (brown) and mean (beige) of bipolar voltage at LIRs and LCRs (LIRs, n = 48; LCRs, n = 29; independent samples; data are presented as median (Q1–Q3) with minimum and maximum; P = 0.172 and P = 0.127, respectively; two-sided Mann–Whitney U-test without adjustments). d, Comparison of ICL percentage (purple) at LIRs and LCRs (LIRs, n = 41; LCRs, n = 24; independent samples; data are presented as median (Q1–Q3) with minimum and maximum; P = 0.591; two-sided Mann–Whitney U-test without adjustments). e, Comparison of FD and FE values at iAT-inducing locations and iAT-free locations (iAT-inducing locations, n = 41; iAT-free locations, n = 36; independent samples; data are presented as median (Q1–Q3) with minimum and maximum; P = 0.00033 and P = 0.032, respectively; two-sided Mann–Whitney U-test without adjustments). f, ROC curves for predicting iAT occurrence, with the cutoff value, the sensitivity and specificity values, and AUC of FD, FE and ICL (green, orange and purple, respectively). g, Comparison of the maximum (brown) and mean (beige) of bipolar voltage at iAT-inducing locations and iAT-free locations (iAT-inducing locations, n = 21; iAT-free locations, n = 26; independent samples; data are presented as median (Q1–Q3) with minimum and maximum; P = 0.215 and P = 0.127, respectively; two-sided Mann–Whitney U-test without adjustments). h, Comparison of ICL percentage (purple) at iAT-inducing locations and iAT-free locations (iAT-inducing locations, n = 16; iAT-free locations, n = 23; independent samples; data are presented as median (Q1–Q3) with minimum and maximum; P = 0.021; two-sided Mann–Whitney U-test without adjustments).

References

    1. Santhanakrishnan R. et al. Atrial fibrillation begets heart failure and vice versa: temporal associations and differences in preserved versus reduced ejection fraction. Circulation 133, 484–492 (2016). - PMC - PubMed
    1. Chen LY et al. Atrial fibrillation and the risk of sudden cardiac death: the Atherosclerosis Risk in Communities Study and Cardiovascular Health Study. JAMA Intern. Med 173, 29–35 (2013). - PMC - PubMed
    1. Mark DB et al. Effect of catheter ablation vs medical therapy on quality of life among patients with atrial fibrillation: the CABANA randomized clinical trial. JAMA 321, 1275–1285 (2019). - PMC - PubMed
    1. Kühne M. et al. Silent brain infarcts impact on cognitive function in atrial fibrillation. Eur. Heart J 43, 2127–2135 (2022). - PMC - PubMed
    1. Haïssaguerre M. et al. Electrophysiological breakthroughs from the left atrium to the pulmonary veins. Circulation 102, 2463–2465 (2000). - PubMed

LinkOut - more resources