. 2024 Aug 14:12:e17676.
doi: 10.7717/peerj.17676. eCollection 2024.

PCSK9 inhibitor effectively alleviated cognitive dysfunction in a type 2 diabetes mellitus rat model

Affiliations

PCSK9 inhibitor effectively alleviated cognitive dysfunction in a type 2 diabetes mellitus rat model

Yang Yang et al. PeerJ. .

Abstract

Background: The incidence of diabetes-associated cognitive dysfunction (DACD) is increasing; however, few clinical intervention measures are available for the prevention and treatment of this disease. Research has shown that proprotein convertase subtilisin/kexin type 9 (PCSK9) inhibitors, particularly SBC-115076, have a protective effect against various neurodegenerative diseases. However, their role in DACD remains unknown. In this study, we aimed to explore the impact of PCSK9 inhibitors on DACD.

Methods: Male Sprague-Dawley (SD) rats were used to establish an animal model of type 2 diabetes mellitus (T2DM). The rats were randomly divided into three groups: the Control group (Control, healthy rats, n = 8), the Model group (Model, rats with T2DM, n = 8), and the PCSK9 inhibitor-treated group (Treat, T2DM rats treated with PCSK9 inhibitors, n = 8). To assess the spatial learning and memory of the rats in each group, the Morris water maze (MWM) test was conducted. Hematoxylin-eosin staining and Nissl staining procedures were performed to assess the structural characteristics and functional status of the neurons of rats from each group. Transmission electron microscopy was used to examine the morphology and structure of the hippocampal neurons. Determine serum PCSK9 and lipid metabolism indicators in each group of rats. Use qRT-PCR to detect the expression levels of interleukin (IL)-1β, IL-6, and tumor necrosis factor-alpha (TNF-α) in the hippocampal tissues of each group of rats. Western blot was used to detect the expression of PCSK9 and low-density lipoprotein receptor (LDLR) in the hippocampal tissues of rats. In addition, a 4D label-free quantitative proteomics approach was used to analyse protein expression in rat hippocampal tissues. The expression of selected proteins in hippocampal tissues was verified by parallel reaction monitoring (PRM) and immunohistochemistry (IHC).

Results: The results showed that the PCSK9 inhibitor alleviated cognitive dysfunction in T2DM rats. PCSK9 inhibitors can reduce PCSK9, total cholesterol (TC), and low-density lipoprotein (LDL) levels in the serum of T2DM rats. Meanwhile, it was found that PCSK9 inhibitors can reduce the expression of PCSK9, IL-1β, IL-6, and TNF-α in the hippocampal tissues of T2DM rats, while increasing the expression of LDLR. Thirteen potential target proteins for the action of PCSK9 inhibitors on DACD rats were identified. PRM and IHC revealed that PCSK9 inhibitors effectively counteracted the downregulation of transthyretin in DACD rats.

Conclusion: This study uncovered the target proteins and specific mechanisms of PCSK9 inhibitors in DACD, providing an experimental basis for the clinical application of PCSK9 inhibitors for the potential treatment of DACD.

Keywords: Diabetes-associated cognitive dysfunction; PCSK9 inhibitors; Parallel reaction monitoring; Proteomics.


Conflict of interest statement

The authors declare that they have no competing interests.

Figures
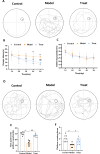
Figure 1
Figure 1. MWM test of T2DM rat.
(A) Swimming track of T2DM rats on day 5 of the place navigation test; (B) the escape latency during the place navigation test; (C) the swimming speed during the place navigation test; (D) swimming track of T2DM rats during the spatial probe test; (E) time spent in the platform quadrant during the spatial probe test; (F) platform crossing times during the spatial probe test. Data are expressed as mean ± SEM, n = 8. *p < 0.05, **p < 0.01, vs. Control. #p < 0.05, ##p < 0.01, vs. Model.
Figure 2
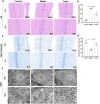
Figure 2. Morphological changes in the hippocampal CA1 area.
(A) The representatives picture of HE staining in hippocampal regions CA1 (200×, 400×) from each group; (B) quantitative statistics of HE staining. (C) Nissl-stained neurons of the hippocampal CA1 (200×, 400×) from each group; (D) quantitative statistics of Nissl staining. (E) Ultrastructural changes in the hippocampus: mitochondria (black arrow), rough endoplasmic reticulum (red arrow) (1,200×, 6,000×), N represents the nucleus of the cell. (N = 3 per group). **p < 0.01, vs. Control. ##p < 0.01, vs. Model.
Figure 3
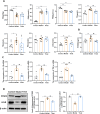
Figure 3. Detection of relevant indexes in serum and hippocampal tissues of rats in each group.
(A) Body weight and glycolipid metabolic parameter in each group of rats (N = 8 per group); (B) serum PCSK9 levels of rats in each group (N = 8 per group); (C) the mRNA expression of IL-1β, IL-6, and TNF-α in the hippocampal tissue (N = 5 per group); (D) western blotting analysis of the PCSK9 and LDLR in the hippocampal tissue of each group (N = 3 per group). *p < 0.05, **p < 0.01, vs. Control. #p < 0.05, ##p < 0.01, vs. Model.
Figure 4
Figure 4. Analysis of DEPs in three group.
(A) Peptides and proteins. (B) The analysis of DEPs. (C) Hierarchical clustering analysis of DEPs. (N = 3 per group).
Figure 5
Figure 5. Description of DEPs between the control group and the model group.
(A) A volcano plot depicting the DEPs between the Control group and the Model group when FC > 1.2. Grey represents nondifferentiated proteins, upregulated DEPs are represented in orange, and downregulated DEPs are represented in blue. (B) Subcellular localization of DEPs between Control group vs. Model group. (C) GO function analysis histogram between Control group vs. Model group. BP is marked by dark cyan; CC is marked by sienna and MF is marked by steel blue. (N = 3 per group).
Figure 6
Figure 6. Enrichment analysis of DEPs.
(A) Annotation term levels of DEPs between Control group vs. Model group are indicated as BPs; (B) annotation term levels of DEPs between Model group vs. Treat group are indicated as BPs; (C) bubble chart of the enriched KEGG pathways between Control group vs. Model group; (D) bubble chart of the enriched KEGG pathways between Model group vs. Treat group. (N = 3 per group).
Figure 7
Figure 7. Description of DEPs between the Model group and the Treat group.
(A) A volcano plot depicting the DEPs between the Model group and the Treat group when FC > 1.2. Grey represents nondifferentiated proteins, upregulated DEPs are represented in orange, and downregulated DEPs are represented in blue. (B) Subcellular localization of DEPs between Model group vs. Treat group. (C) GO function analysis histogram between Model group vs. Treat group. BP is marked by dark cyan; CC is marked by sienna and MF is marked by steel blue. (N = 3 per group).
Figure 8
Figure 8. Venn diagram and expression of transthyretin (Ttr).
(A) The Venn diagram indicated a comparison of DEPs between the Control group vs. Model group and Model group vs. Treat group; (B) The PRM results of the Ttr in rat hippocampus tissue (N = 3 per group); (C) Representative IHC of Ttr in hippocampus tissue from each group. Scale bars: 50 µm; (D) Quantification of Ttr staining. (N = 5 per group).

References

    1. Adorni MP, Ruscica M, Ferri N, Bernini F, Zimetti F. Proprotein convertase subtilisin/kexin Type 9, brain cholesterol homeostasis and potential implication for Alzheimer’s disease. Frontiers in Aging Neuroscience. 2019;11:120. doi: 10.3389/fnagi.2019.00120. - DOI - PMC - PubMed
    1. Aleshire SL, Bradley CA, Richardson LD, Parl FF. Localization of human prealbumin in choroid plexus epithelium. Journal of Histochemistry & Cytochemistry. 1983;31(5):608–612. doi: 10.1177/31.5.6341455. - DOI - PubMed
    1. American Diabetes Association 12. Older Adults: Standards of medical care in diabetes—2021. Diabetes Care. 2021;44(Suppl 1):S168–S179. doi: 10.2337/dc21-S012. - DOI - PubMed
    1. Apaijai N, Moisescu DM, Palee S, McSweeney CM, Saiyasit N, Maneechote C, Boonnag C, Chattipakorn N, Chattipakorn SC. Pretreatment with PCSK9 inhibitor protects the brain against cardiac Ischemia/Reperfusion injury through a reduction of neuronal inflammation and amyloid beta aggregation. Journal of the American Heart Association. 2019;8(2):e010838. doi: 10.1161/JAHA.118.010838. - DOI - PMC - PubMed
    1. Arunsak B, Pratchayasakul W, Amput P, Chattipakorn K, Tosukhowong T, Kerdphoo S, Jaiwongkum T, Thonusin C, Palee S, Chattipakorn N, Chattipakorn SC. Proprotein convertase subtilisin/kexin type 9 (PCSK9) inhibitor exerts greater efficacy than atorvastatin on improvement of brain function and cognition in obese rats. Archives of Biochemistry and Biophysics. 2020;689(8):108470. doi: 10.1016/j.abb.2020.108470. - DOI - PubMed

MeSH terms