. 2024 Oct 17;144(16):1705-1721.
doi: 10.1182/blood.2023021991.

An unbiased lncRNA dropout CRISPR-Cas9 screen reveals RP11-350G8.5 as a novel therapeutic target for multiple myeloma

Affiliations

An unbiased lncRNA dropout CRISPR-Cas9 screen reveals RP11-350G8.5 as a novel therapeutic target for multiple myeloma

Katia Grillone et al. Blood. .

Abstract

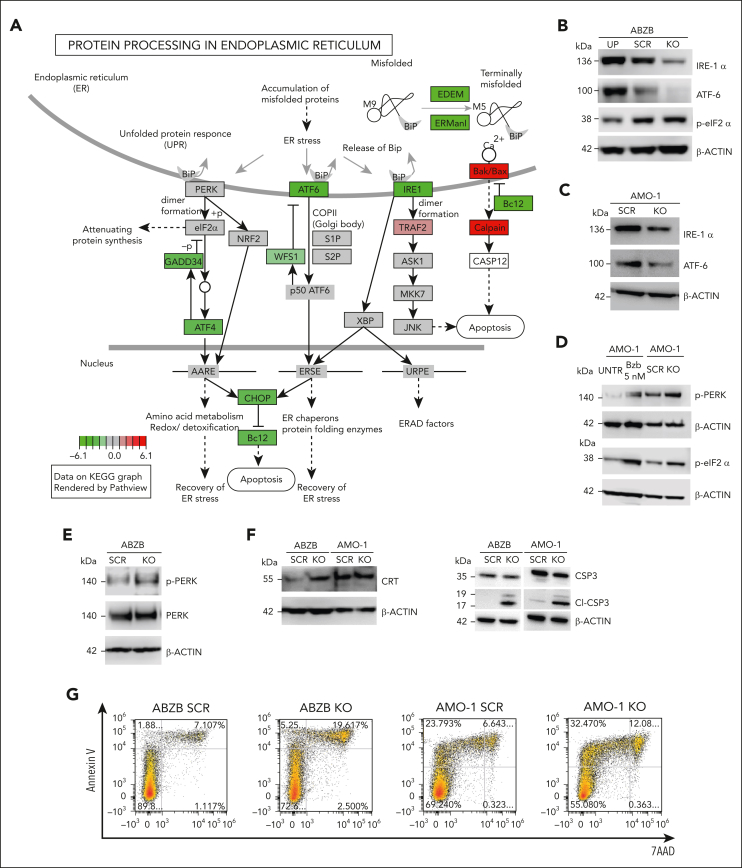
Multiple myeloma (MM) is an incurable malignancy characterized by altered expression of coding and noncoding genes promoting tumor growth and drug resistance. Although the crucial role of long noncoding RNAs (lncRNAs) in MM is clearly established, the function of the noncoding RNAome, which might allow the design of novel therapeutics, is largely unknown. We performed an unbiased CRISPR-Cas9 loss-of-function screen of 671 lncRNAs in MM cells and their bortezomib (BZB)-resistant derivative. To rank functionally and clinically relevant candidates, we designed and used a bioinformatic prioritization pipeline combining functional data from cellular screens with prognostic and transcriptional data from patients with MM. With this approach, we unveiled and prioritized 8 onco-lncRNAs essential for MM cell fitness, associated with high expression and poor prognosis in patients with MM. The previously uncharacterized RP11-350G8.5 emerged as the most promising target, irrespective of BZB resistance. We (1) demonstrated the anti-tumoral effect obtained by RP11-350G8.5 inhibition in vitro and in vivo; (2) highlighted a modulation of the unfolded protein response and the induction of immunogenic cell death triggered by the RP11-350G8.5 knockout, via RNA sequencing and molecular studies; (3) characterized its cytoplasmic homing through RNA fluorescence in situ hybridization; and (4) predicted its 2-dimensional structure and identified 2 G-quadruplex and 3 hairpin-forming regions by biophysical assays, including thioflavin T, 1H nuclear magnetic resonance, and circular dichroism, to pave the way to the development of novel targeted therapeutics. Overall, we provided innovative insights about unexplored lncRNAs in MM and identified RP11-350G8.5 as an oncogenic target for treatment-naïve and BZB-resistant patients with MM.


Conflict of interest statement

Conflict-of-interest disclosure: F.I. receives funds from Open Targets, a public-private initiative involving academia and industry, and performs consultancy for the Cancer Research Horizons–AstraZeneca Functional Genomics Centre and Mosaic Therapeutics. The remaining authors declare no competing financial interests.

Figures

None
Graphical abstract
Figure 1.
Figure 1.
lncRNA dropout CRISPR-Cas9 screen in MM cell lines. (A) Schematic representation of the CRISPR screening pipeline. (B) Spearman's correlation between pgRNA read count profiles (from DNA collected 30 days after transduction and selection of the library) across screen replicates = 0.85 and 0.88, respectively, for AMO-1 and ABZB, with color bars on top/left indicating cluster membership obtained via hierarchical clustering (complete distance method). (C) Representation of pgRNA abundance log fold changes (logFCs) in DNA collected 30 days after library transduction and selection vs plasmidic amounts for 3 groups of pgRNAs: nontargeting (negative controls [median logFC = 0.27 and 0.35, respectively, for AMO-1 and ABZB]), targeting ribosomal protein genes (control essential genes, median logFC = −0.68 and −0.43, with a logFC ≤−0.5, corresponding to a MAGeCK FDR ≤20%), and lncRNAs, across the 2 screens. Each point represents 1 of the 12 472 pgRNAs in the library with coordinates on the y-axis indicating the median logFC across screen replicates. (D) Gene-wise MAGeCK robust rank aggregation (RRA) scores for significant dependencies identified in the 2 screens at an FDR ≤20%. Top essential control genes, dependencies that are private to each cell line and shared across them (as per the color scheme) are highligted. (E) Number of significantly essential lncRNAs (at an FDR ≤20%) in the 2 screened cell lines and their overlap. MOI, multiplicity of infection.
Figure 2.
Figure 2.
lncRNA prioritization scheme and results. (A) The lncRNA prioritization scheme integrating results from the CRISPR-Cas9 screens, prognostic relevance of lncRNAs and their differential expression (DE) in patients with MM contrasted to normal tissues, from publicly available data sets. (B) CRISPR-Cas9 depletion log fold change (logFC) of individual nontargeting pgRNAs and pgRNAs targeting the top-priority hit RP11-350G8.5, across the 2 screens. The pgRNAs selected and used for the follow-up experimental validations are reported in red. (C) Association between high basal expression of RP11-350G8.5 and poorer overall (OS)/progression-free survival (PFS) in patients with MM (from the MMRF/coMMpass study). Reported P values are from a Cox proportional hazards regression model and from a Kaplan-Meier log-rank test performed across a partition induced by the best discriminating patient-percentile threshold of RP11-350G8.5 expression (40% and 31%, respectively, for OS and PFS), which was determined in a supervised manner, for visualization purposes. (D) Basal expression comparison for RP11-350G8.5 across patients with MM, normal tissues, healthy bone marrow, and plasma cells. In the prioritization pipeline, DE is computed via a generalized linear model. Here, for visualization purposes, a Student t test has been performed across groups and resulting P values are reported. (E) High-priority oncogenic lncRNAs outputted by the prioritization pipeline. Each point is an lncRNA with coordinates on the 2 axes indicating, respectively, best scaled -log transformed P values from 2 DE analyses comparing patients with MM with normal samples (x-axis), and priority scores (y-axis). Shapes indicate the cell line in which the lncRNAs were found significantly essential, according to the screen; color intensities are proportional to the best P value from OS/PSF based on the lncRNA expression observed in patients with MM. (F) Comparison of basal expression of RP11-350G8.5 (IL-6R-AS1) and its antisense gene (IL-6R) showing only a mild significant positive correlation between sense and antisense genes in each group of patients across groups of patients with MM segmented on the basis of their response to bortezomib treatment.
Figure 3.
Figure 3.
Functional validation of prioritized oncogenic lncRNA candidates. (A) RP11-350G8.5 and LINC00467 basal expression levels via quantitative real time PCR (qRT-PCR) in MM cell lines and peripheral blood mononuclear cells (PBMCs) from healthy donors (values are normalized to the expression of GAPDH). (B) Representative image of genomic PCR products before and after KO of LINC00467 and RP11-350G8.5 in AMO-1 cells, visualized on 1.5% agarose gels. On the right: Sanger sequence of the amplicons encompassing the CRISPR-targeted region. Blue rectangles highlight pgRNA binding sites, whereas colored lines refer to the schematic picture of the KO reported above the gel picture (on the left). (C) Representative image of flow cytometric monitoring of AMO-1 and ABZB cells transduced with a SCRAMBLE-GFP-CRISPR vector (dark gray) or LINC00467/KO-GFP-CRISPR vector (light blue) or RP11-350G8.5/KO- GFP-CRISPR vector (red). Light-gray curves represent the percentage of viable cells at day 0 (48 hours after lentiviral transduction) with overlapping colored curves at day 20. (D) Representative images of colony assay of AMO-1 and ABZB GFP-sorted cells, 15 days after plating, were generated using EVOS XL-Core microscope (Invitrogen by Thermo Fisher) (magnification ×10). (E) Number of colonies in 3 independent wells. (F) Dose-response curves 24 hours after treatment with bortezomib (1-10 nM). Percentage of viable cells ± standard deviation are normalized with respect to DMSO-treated cells (vehicle) for each experimental condition. Statistical differences were assessed across all plots via Student t test; ∗P < .05, ∗∗P < .01, and ∗∗∗P < .001.
Figure 4.
Figure 4.
RP11-350G8.5 putative oncogenic role: in vitro validation and preliminary data from in vivo models. (A) Flow cytometric monitoring of GFP expression in ABZB cells transduced with a SCRAMBLE-GFP-CRISPR negative control vector, an RPL8/KO-GFP-CRISPR positive control vector (selected from Project Score [37]), and 2 GFP-CRISPR constructs encoding for 2 pgRNAs targeting RP11-350G8.5. Gray curves represent the percentage of viable cells at day 0 (48 hours after lentiviral transduction), while colored curves represent the percentage of viable cells at day 20. Bars on the right represent the fold change in percentage of GFP-expressing cells 20 days after target depletion against day 0. (B) Evaluation of IL-6R RNA expression level through quantitative real time PCR (qRT-PCR) on ABZB after transduction with SCRAMBLE vector or KO of RP11-350G8.5 with pgRNA#1 or pgRNA#2 or with a vector overexpressing RP11-350G8.5 (UP). (Data are normalized to the expression of GAPDH.) Statistics were obtained using multiple t-tests, resulting in no significant (ns) differences, as per the reported P values. (C) Flow cytometric monitoring of GFP in JJN.3 and NCI-H929 MM transduced cells, and percentage of GFP-positive cells is reported by overlapping curves referred to day 20 (colored curves) against day 0 (light gray curves). (D) Validation of RP11-350G8.5 KO in nontumoral cells, performed as described for A and C. (E) Representative images of RNA-FISH analysis. Nuclei are counterstained with DAPI (blue signal), whereas C3-fluorescein–conjugated GAPDH (green signal) has been used as cytoplasmic marker. Customly designed Stellaris probes targeting RP11-350G8.5 have been conjugated with 5-carboxytetramethylrhodamine (TAMRA) dye (red signal). Representative pictures acquired with a DMI6000-AF6000 Leica (Wetzlar, Germany) fluorescence microscope at magnification ×63 are reported, followed by specific regions of interest (ROIs), which are represented as enlarged images. (F) Dose-response curves 24 hours after treatment with bortezomib in AMO-1 cells overexpressing RP11-350G8.5 (1-10 nM). Statistics were analyzed using multiple t-tests (cutoff ∗P < .05, ∗∗P < .01). (G) In vivo imaging of engrafted ABZB cells. A total of 5 × 106 ABZB cells, which previously underwent highly efficient transduction (multiplicity of infection = 1) of RP11-350G8.5 KO-GFP or the SCRAMBLE vectors, were subcutaneously inoculated in mice (n = 2 per group). Images of tumors were acquired when the tumoral masses became palpable (identified as DAY 1), and at the end of the experiment (DAY 16, when tumors reached 2 cm in diameter). Both DAY 1 and DAY 16 were set up by considering SCRAMBLE mice, because SCRAMBLE cells have been faster to generate tumoral masses, due to their higher proliferative rate, and to grow up to 2 cm in diameter, with respect to KO cells. Tumors appear as yellow high-density signals on the right flank of the mice. Pictures were obtained with the IVIS (Perkin Elmer) system. (H) Tumor growth as mean measurement ± standard deviation (SD) across mice groups (n = 2). (I) Photographs of excised tumors were captured by a digital camera. (J) Weights of excised tumors, reported as mean ± SD across mice groups. Statistics were analyzed using multiple t-tests (cutoff: ∗P < .05).
Figure 4.
Figure 4.
RP11-350G8.5 putative oncogenic role: in vitro validation and preliminary data from in vivo models. (A) Flow cytometric monitoring of GFP expression in ABZB cells transduced with a SCRAMBLE-GFP-CRISPR negative control vector, an RPL8/KO-GFP-CRISPR positive control vector (selected from Project Score [37]), and 2 GFP-CRISPR constructs encoding for 2 pgRNAs targeting RP11-350G8.5. Gray curves represent the percentage of viable cells at day 0 (48 hours after lentiviral transduction), while colored curves represent the percentage of viable cells at day 20. Bars on the right represent the fold change in percentage of GFP-expressing cells 20 days after target depletion against day 0. (B) Evaluation of IL-6R RNA expression level through quantitative real time PCR (qRT-PCR) on ABZB after transduction with SCRAMBLE vector or KO of RP11-350G8.5 with pgRNA#1 or pgRNA#2 or with a vector overexpressing RP11-350G8.5 (UP). (Data are normalized to the expression of GAPDH.) Statistics were obtained using multiple t-tests, resulting in no significant (ns) differences, as per the reported P values. (C) Flow cytometric monitoring of GFP in JJN.3 and NCI-H929 MM transduced cells, and percentage of GFP-positive cells is reported by overlapping curves referred to day 20 (colored curves) against day 0 (light gray curves). (D) Validation of RP11-350G8.5 KO in nontumoral cells, performed as described for A and C. (E) Representative images of RNA-FISH analysis. Nuclei are counterstained with DAPI (blue signal), whereas C3-fluorescein–conjugated GAPDH (green signal) has been used as cytoplasmic marker. Customly designed Stellaris probes targeting RP11-350G8.5 have been conjugated with 5-carboxytetramethylrhodamine (TAMRA) dye (red signal). Representative pictures acquired with a DMI6000-AF6000 Leica (Wetzlar, Germany) fluorescence microscope at magnification ×63 are reported, followed by specific regions of interest (ROIs), which are represented as enlarged images. (F) Dose-response curves 24 hours after treatment with bortezomib in AMO-1 cells overexpressing RP11-350G8.5 (1-10 nM). Statistics were analyzed using multiple t-tests (cutoff ∗P < .05, ∗∗P < .01). (G) In vivo imaging of engrafted ABZB cells. A total of 5 × 106 ABZB cells, which previously underwent highly efficient transduction (multiplicity of infection = 1) of RP11-350G8.5 KO-GFP or the SCRAMBLE vectors, were subcutaneously inoculated in mice (n = 2 per group). Images of tumors were acquired when the tumoral masses became palpable (identified as DAY 1), and at the end of the experiment (DAY 16, when tumors reached 2 cm in diameter). Both DAY 1 and DAY 16 were set up by considering SCRAMBLE mice, because SCRAMBLE cells have been faster to generate tumoral masses, due to their higher proliferative rate, and to grow up to 2 cm in diameter, with respect to KO cells. Tumors appear as yellow high-density signals on the right flank of the mice. Pictures were obtained with the IVIS (Perkin Elmer) system. (H) Tumor growth as mean measurement ± standard deviation (SD) across mice groups (n = 2). (I) Photographs of excised tumors were captured by a digital camera. (J) Weights of excised tumors, reported as mean ± SD across mice groups. Statistics were analyzed using multiple t-tests (cutoff: ∗P < .05).
Figure 5.
Figure 5.
Differential expression and pathway enrichment analysis of ABZB cell lines on RP11-350G8.5 KO. (A) Differential expression analysis: each point is a gene, significantly differentially expressed genes in RP11-350G8.5 KO vs SCRAMBLE (SCR) are highlighted, with top 10 differentially expressed ones in the insets. (B) Transcription factors differentially active in RP11-350G8.5 KO vs SCR computed by DoRothEA. (C-D) Gene Ontology (GO) BP Enrichment Analysis of the upregulated and downregulated genes. (E) Cnet plot details for the Reactome Pathway Enrichment Analysis of the downregulated genes.
Figure 6.
Figure 6.
Enrichment analysis and validation of the unfolded protein response (UPR) system’s modulation. (A) Image adapted from Kyoto Encyclopedia of Genes and Genomes (KEGG) analysis (full image is provided in supplemental Figure 18) of differentially expressed genes in RP11-350G8.5 KO ABZB cells revealing a network of genes involved in the UPR in endoplasmic reticulum (ER). (B-F) Western blot (WB) analysis conducted on proteins extracted from ABZB and AMO-1 GFP+ sorted cells after RP11-350G8.5 KO, or overexpression (UP) or transduced with the SCRAMBLE vector, or following bortezomib treatment. (G) Distribution of SCRAMBLE and KO ABZB and AMO-1 cells stained with annexin V/7AAD to assess the percentage of apoptosis following the KO. The fold increase of annexin V+/7AAD+ late apoptotic events was 2.7 for ABZB KO cells and 1.8 for AMO-1 KO cells, compared with SCRAMBLE-transduced cells. (H, left) Representative images from a FISH analysis conducted with the probe targeting the lncRNA RP11-350G8.5 conjugated with TAMRA dye (red signal) and the antibody against CRT protein, whose secondary antibody is conjugated with FITCH (green signal). Images were acquired with a DMI6000-AF6000 Leica microscope (magnification ×63). (H, right) Membrane expression of CRT on ABZB cells transduced with SCRAMBLE (gray curve) or KO vector (green curve), detected through flow cytometry (7AAD-negative cells were gated to exclude dying cells from this analysis). The fold change of the median fluorescent intensity (MFI) was calculated to quantify the increase of CRT exposure to the cell membrane following KO, with respect to scramble cells. (I) Representative images of immunofluorescent assay show ABZB tumor cells in green and monocyte-derived dendritic cells (MoDCs) in red. After RP11-350G8.5 KO, there is an evident increase of cancer cells engulfed in MoDCs, as indicated by arrows. (Enlarged images of phagocytosed cells are reported near the pictures with magnification ×20.) The images were obtained with a DMI6000-AF6000 Leica microscope. A quantification of engulfed cells following KO was provided by a flow cytometric analysis (supplemental Figure 19). (J) Hematoxylin and eosin (H&E) and p-PERK immunohistochemistry staining of retrieved tumors from animals engrafted with ABZB SCRAMBLE or ABZB RP11-350G8.5 KO cells revealed the high grade of engrafted tumors, based on histologic evaluation of nuclear atypia, necrosis, and mitotic pattern. Visualization was performed with a Leica DM 2500 optical microscope (magnification ×20) (upper panel). WB analysis of p-PERK and the downstream effector p-eIF2 α on whole protein extracted from tumors retrieved from mice 16 days after engraftment (lower panel).
Figure 6.
Figure 6.
Enrichment analysis and validation of the unfolded protein response (UPR) system’s modulation. (A) Image adapted from Kyoto Encyclopedia of Genes and Genomes (KEGG) analysis (full image is provided in supplemental Figure 18) of differentially expressed genes in RP11-350G8.5 KO ABZB cells revealing a network of genes involved in the UPR in endoplasmic reticulum (ER). (B-F) Western blot (WB) analysis conducted on proteins extracted from ABZB and AMO-1 GFP+ sorted cells after RP11-350G8.5 KO, or overexpression (UP) or transduced with the SCRAMBLE vector, or following bortezomib treatment. (G) Distribution of SCRAMBLE and KO ABZB and AMO-1 cells stained with annexin V/7AAD to assess the percentage of apoptosis following the KO. The fold increase of annexin V+/7AAD+ late apoptotic events was 2.7 for ABZB KO cells and 1.8 for AMO-1 KO cells, compared with SCRAMBLE-transduced cells. (H, left) Representative images from a FISH analysis conducted with the probe targeting the lncRNA RP11-350G8.5 conjugated with TAMRA dye (red signal) and the antibody against CRT protein, whose secondary antibody is conjugated with FITCH (green signal). Images were acquired with a DMI6000-AF6000 Leica microscope (magnification ×63). (H, right) Membrane expression of CRT on ABZB cells transduced with SCRAMBLE (gray curve) or KO vector (green curve), detected through flow cytometry (7AAD-negative cells were gated to exclude dying cells from this analysis). The fold change of the median fluorescent intensity (MFI) was calculated to quantify the increase of CRT exposure to the cell membrane following KO, with respect to scramble cells. (I) Representative images of immunofluorescent assay show ABZB tumor cells in green and monocyte-derived dendritic cells (MoDCs) in red. After RP11-350G8.5 KO, there is an evident increase of cancer cells engulfed in MoDCs, as indicated by arrows. (Enlarged images of phagocytosed cells are reported near the pictures with magnification ×20.) The images were obtained with a DMI6000-AF6000 Leica microscope. A quantification of engulfed cells following KO was provided by a flow cytometric analysis (supplemental Figure 19). (J) Hematoxylin and eosin (H&E) and p-PERK immunohistochemistry staining of retrieved tumors from animals engrafted with ABZB SCRAMBLE or ABZB RP11-350G8.5 KO cells revealed the high grade of engrafted tumors, based on histologic evaluation of nuclear atypia, necrosis, and mitotic pattern. Visualization was performed with a Leica DM 2500 optical microscope (magnification ×20) (upper panel). WB analysis of p-PERK and the downstream effector p-eIF2 α on whole protein extracted from tumors retrieved from mice 16 days after engraftment (lower panel).
Figure 7.
Figure 7.
Characterization of RP11-350G8.5 structural features. (A) RNA secondary structure prediction of RP11-350G8.5 computed using the RNAfold web server: (left) MFE and (right) centroid structures (structures are colored by base-pairing probabilities). (B) Fluorescence emission spectra of ThT (1 μM) in the absence (black line) and presence of various RNA molecules (2.0 μM): 202, 840, 885, 1051, 1421, compared with TERRA, RG-1 positive controls, and a hairpin-forming RNA sequence (negative control). (C) Bar graph of fluorescence enhancement of ThT in the presence of the RNAs. The addition of the 5 RNA molecules resulted in fluorescence enhancements, with FI/FI0 values of 23, 32, 71, 81, and 20 for 202, 840, 885, 1051, and 1421, respectively. Two G4-forming positive controls, TERRA and RG-1, exhibited FI/FI0 values of 119 and 43, respectively, whereas the negative control (hairpin) showed a value of 5. (D) Imino proton region of the 1-dimensional (1D) 1H-NMR spectrum of 1051 recorded at 10°C. (E) Predicted secondary structures for the RNA sequences analyzed by RNAfold. (F) CD spectra of 202, 840, 885, 1051, and 1421 recorded at 10 and 100°C (solid and dashed lines, respectively). (G) ASO screening: bar graphs representative of the induction of apoptosis (fold change to vehicle) 24 and 48 hours after electroporation with 50 nM of different ASOs targeting the regions upstream (1) and downstream (2) to the 5 RNA sequences indicated as 202-840-855-1051-1421. Values on the x-axis refer to the fold change to vehicle of the percentage of cells positive for both annexin V/7AAD apoptotic markers. For the most efficient ASO (840-2), a representative annexin V/7AAD staining and a cell viability curve is provided in supplemental Figure S22B-C. Statistics were analyzed using 2-way analysis of variance test (cutoff ∗P < .05, ∗∗P < .01).

References

    1. van de Donk N, Pawlyn C, Yong KL. Multiple myeloma. Lancet. 2021;397(10272):410–427. - PubMed
    1. Grillone K, Riillo C, Scionti F, et al. Non-coding RNAs in cancer: platforms and strategies for investigating the genomic “dark matter”. J Exp Clin Cancer Res. 2020;39(1):117. - PMC - PubMed
    1. Caracciolo D, Riillo C, Juli G, et al. miR-22 modulates lenalidomide activity by counteracting MYC addiction in multiple myeloma. Cancers. 2021;13(17) - PMC - PubMed
    1. Carrasco-Leon A, Ezponda T, Meydan C, et al. Characterization of complete lncRNAs transcriptome reveals the functional and clinical impact of lncRNAs in multiple myeloma. Leukemia. 2021;35(5):1438–1450. - PMC - PubMed
    1. Slack FJ, Chinnaiyan AM. The role of non-coding RNAs in oncology. Cell. 2019;179(5):1033–1055. - PMC - PubMed

Publication types

MeSH terms