. 2024 Oct 22;8(20):5382-5399.
doi: 10.1182/bloodadvances.2024013508.

Polygenic polymorphism is associated with NKG2A repertoire and influences lymphocyte phenotype and function

Affiliations

Polygenic polymorphism is associated with NKG2A repertoire and influences lymphocyte phenotype and function

Jean-Benoît Le Luduec et al. Blood Adv. .

Abstract

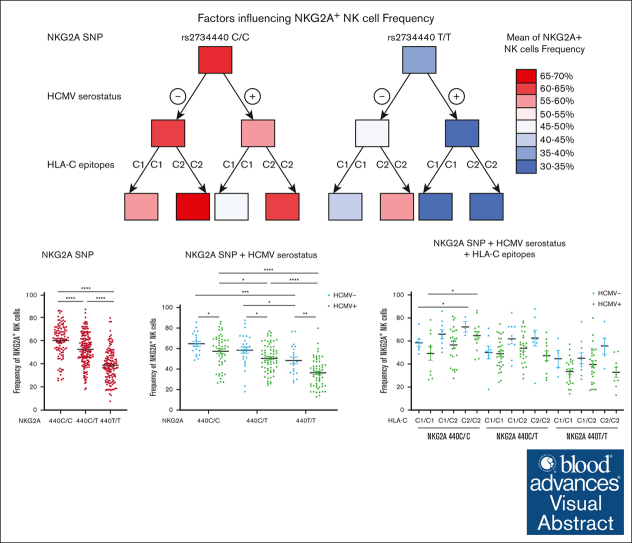
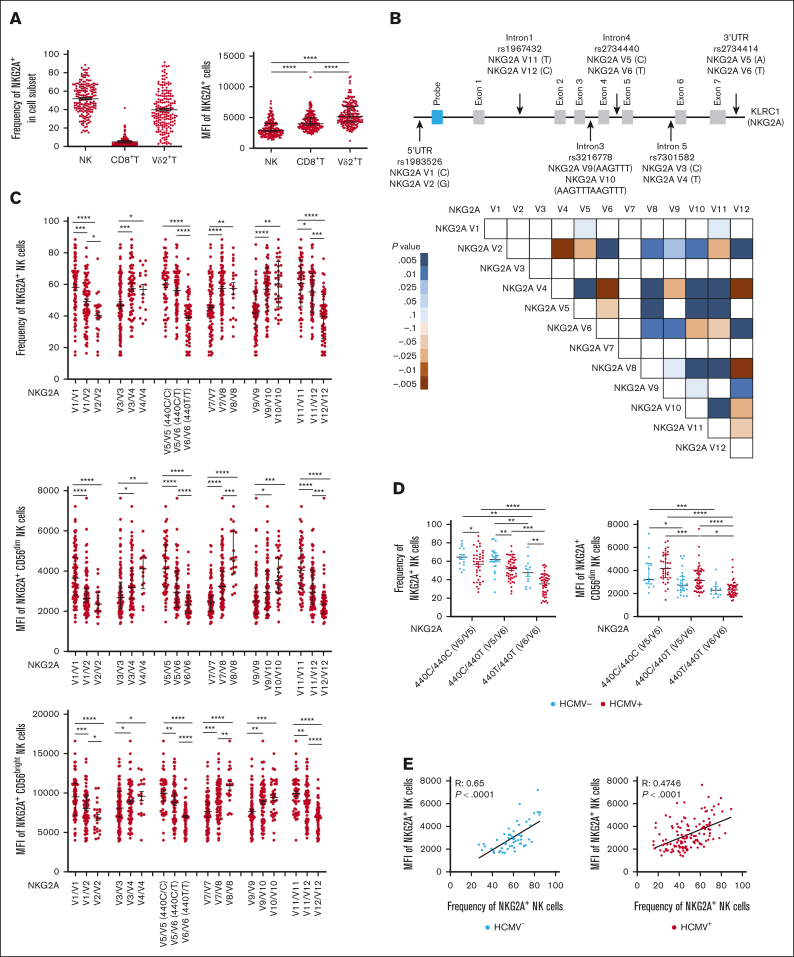
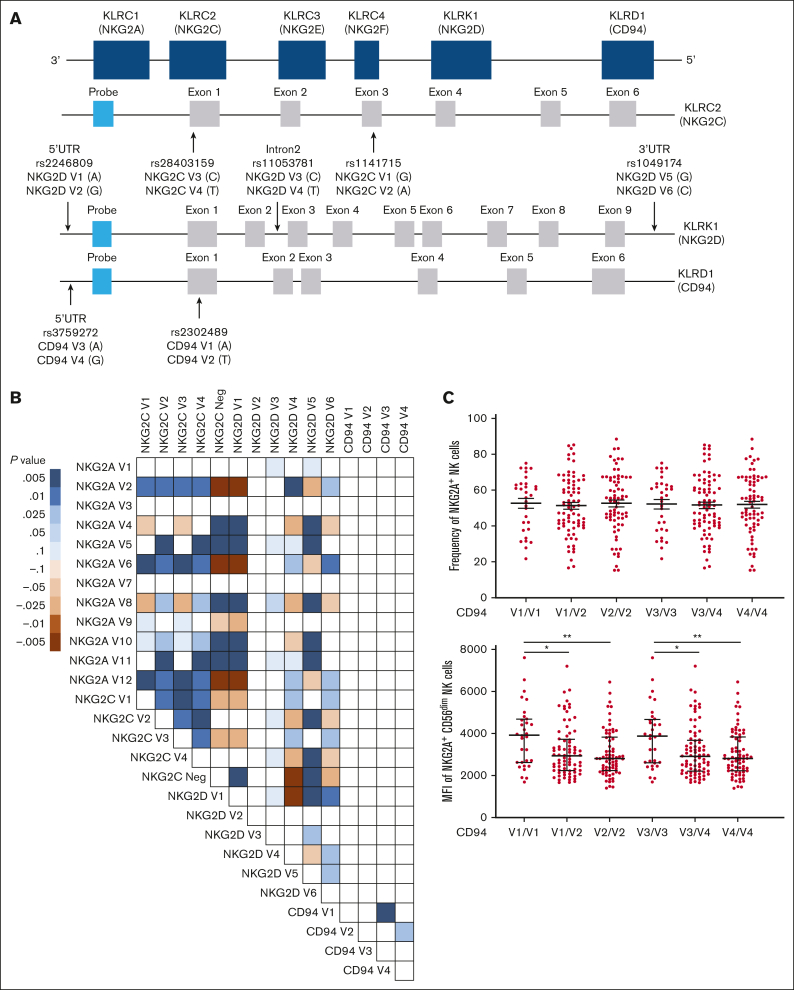
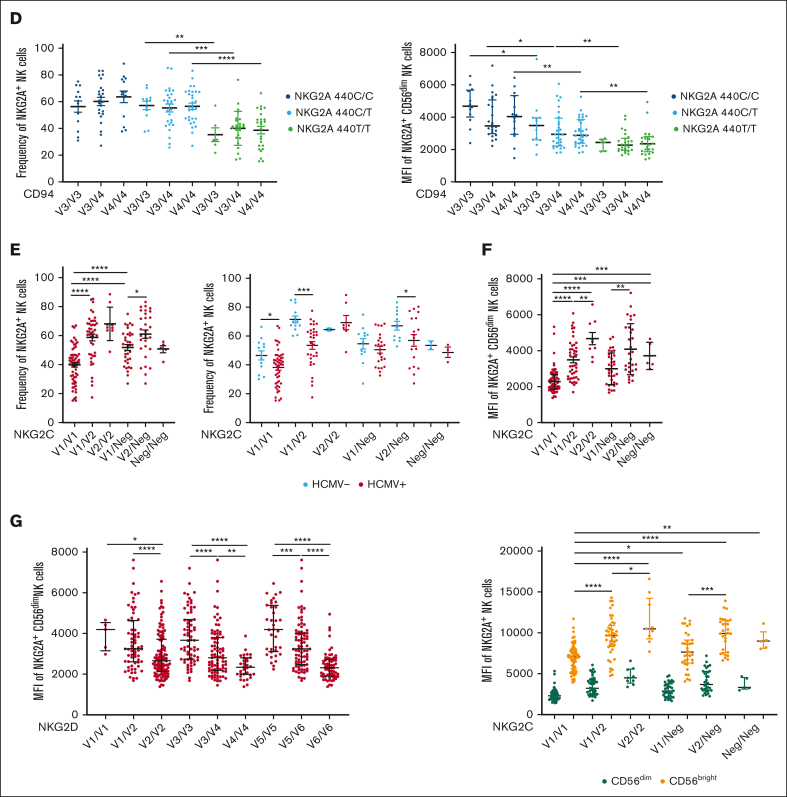
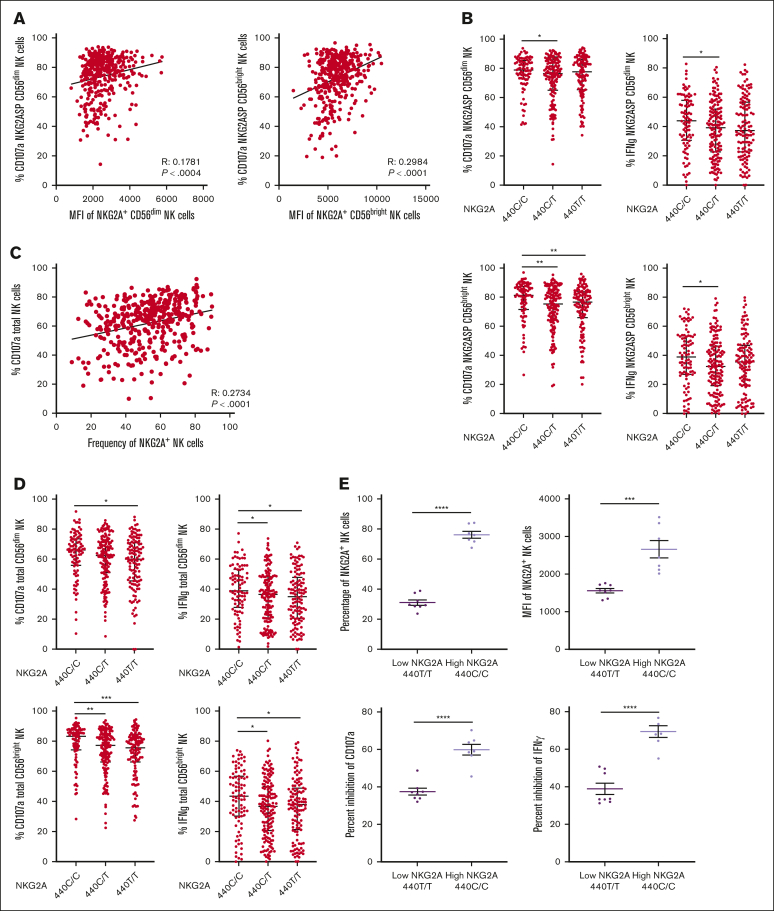
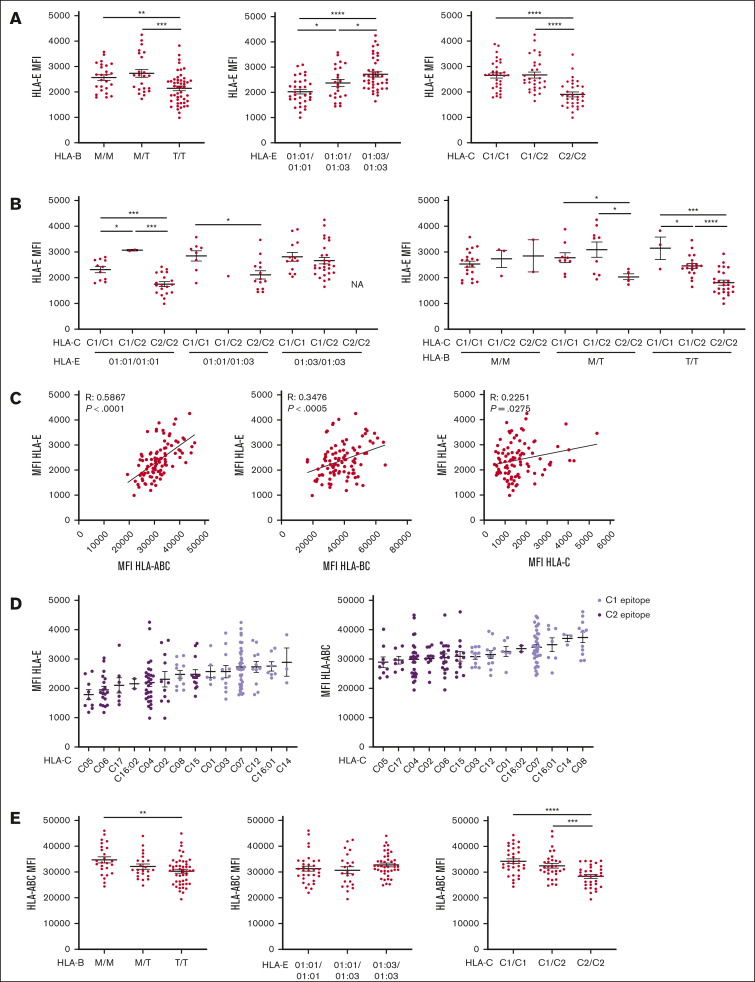
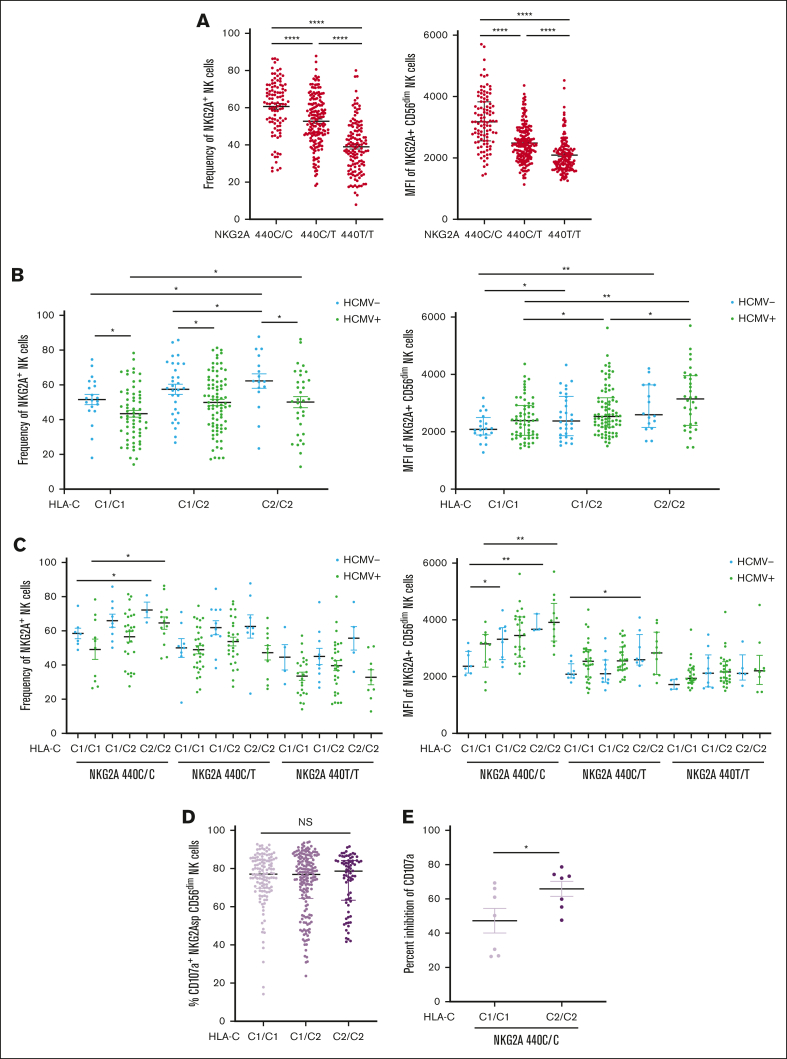
CD94/NKG2A is a heterodimeric receptor commonly found on natural killer (NK) and T cells, and its interaction with its ligand HLA-E on adjacent cells leads to inhibitory signaling and cell suppression. We have identified several killer cell lectin-like receptor (KLR)C1 (NKG2A) single nucleotide polymorphisms (SNPs) that are associated with NKG2A expression on NK cells, CD8+ T cells, and Vγ9/Vδ2+ T cells. Additionally, due to strong linkage disequilibrium, polymorphisms in KLRC2 (NKG2C) and KLRK1 (NKG2D) are also associated with NKG2A surface density and frequency. NKG2A surface expression correlates with single-cell NK responsiveness, and NKG2A+ NK cell frequency is associated with total NK repertoire response and inhibitability, making the identification of SNPs responsible for expression and frequency important for predicting the innate immune response. Because HLA-E expression is dependent on HLA class I signal peptides, we analyzed the relationship between peptide abundance and HLA-E expression levels. Our findings revealed a strong association between peptide availability and HLA-E expression. We identified the HLA-C killer immunoglobulin-like receptor ligand epitope as a predictive marker for HLA-ABC expression, with the HLA-C1 epitope associated with high HLA-E expression and the HLA-C2 epitope associated with low HLA-E expression. The relationship between HLA-C epitopes and HLA-E expression was independent of HLA-E allotypes and HLA-B leader peptides. Although HLA-E expression showed no significant influence on NKG2A-mediated NK education, it did affect NK cell inhibition. In summary, these findings underscore the importance of NKG2A SNPs and HLA-C epitopes as predictive markers of NK cell phenotype and function and should be evaluated as prognostic markers for diseases that express high levels of HLA-E.


Conflict of interest statement

Conflict-of-interest disclosure: M.K.P. and K.C.H. are listed as inventors on a provisional patent for the design and use of HLA-E:peptide chimeric molecules (US provisional patent application number, 63/173,966). The remaining authors declare no competing financial interests.

Figures

None
Graphical abstract
Figure 1.
Figure 1.
Common NKG2A noncoding SNPs are in positive LD and associate with NKG2A expression independent of HCMV serostatus. (A) NKG2A frequency and MFI in NK cells, CD8+ T cells, and Vδ2+ T cells from phenotyping of 204 healthy blood donors. (B) Common noncoding KLRC1 SNPs and LD analysis from genotyping of 204 donors. Positive LD shaded blue; negative LD shaded red. (C) NKG2A+ NK cell frequency and MFI stratified by NKG2A variant. (D) NKG2A+ NK cell frequency and MFI stratified by HCMV serostatus and SNP rs2734440 (440C refers to SNP rs2734440 C and 440T refers to rs2734440 T). (E) Correlation between NKG2A+ NK cell frequency and MFI in HCMV and HCMV+ individuals. (F) Distribution of rs2734440 alleles among different ethnic groups. For panels C-D, t tests were performed, and the mean ± standard error of the mean (SEM) was presented to analyze NKG2A frequencies. For panels A,C-D, Mann-Whitney tests were performed, and median ± interquartile range (IQR) is presented to analyze NKG2A MFI. Correlations were assessed using the Pearson correlation coefficient for panel E. LD was assessed using the χ2 test for panel B. The symbols represent individual samples. ∗P < .05; ∗∗P < .01; ∗∗∗P < .001; ∗∗∗∗P < .0001.
Figure 1.
Figure 1.
Common NKG2A noncoding SNPs are in positive LD and associate with NKG2A expression independent of HCMV serostatus. (A) NKG2A frequency and MFI in NK cells, CD8+ T cells, and Vδ2+ T cells from phenotyping of 204 healthy blood donors. (B) Common noncoding KLRC1 SNPs and LD analysis from genotyping of 204 donors. Positive LD shaded blue; negative LD shaded red. (C) NKG2A+ NK cell frequency and MFI stratified by NKG2A variant. (D) NKG2A+ NK cell frequency and MFI stratified by HCMV serostatus and SNP rs2734440 (440C refers to SNP rs2734440 C and 440T refers to rs2734440 T). (E) Correlation between NKG2A+ NK cell frequency and MFI in HCMV and HCMV+ individuals. (F) Distribution of rs2734440 alleles among different ethnic groups. For panels C-D, t tests were performed, and the mean ± standard error of the mean (SEM) was presented to analyze NKG2A frequencies. For panels A,C-D, Mann-Whitney tests were performed, and median ± interquartile range (IQR) is presented to analyze NKG2A MFI. Correlations were assessed using the Pearson correlation coefficient for panel E. LD was assessed using the χ2 test for panel B. The symbols represent individual samples. ∗P < .05; ∗∗P < .01; ∗∗∗P < .001; ∗∗∗∗P < .0001.
Figure 2.
Figure 2.
SNPs among KLR gene family members are in LD and associate with NKG2A expression. (A) KLR gene complex and SNPs targeted. (B) LD between selected NKG2C, NKG2D, and CD94 SNPs based on the genotyping of 204 healthy donors. Positive LD shaded blue; negative LD shaded red. (C) NKG2A frequency and MFI stratified by CD94 SNPs. (D) NKG2A MFI stratified by CD94 SNPs, in conjunction with NKG2A variants. (E) NKG2A+ NK cells frequency stratified by NKG2C SNPs and HCMV serostatus. (F) NKG2A MFI stratified by NKG2C SNPs and CD56 cell surface expression levels. (G) NKG2A MFI on CD56dim NK cells stratified using NKG2D SNPs. For panels C-E, t tests were performed, and mean ± SEM is presented to analyze NKG2A frequencies. For panels C-D,F-G, Mann-Whitney tests were performed, and median ± IQRs are presented to analyze NKG2A MFI. LD was assessed using the χ2 test for panel B. Symbols represent individual samples. ∗P < .05; ∗∗P < .01; ∗∗∗P < .001; ∗∗∗∗P < .0001.
Figure 2.
Figure 2.
SNPs among KLR gene family members are in LD and associate with NKG2A expression. (A) KLR gene complex and SNPs targeted. (B) LD between selected NKG2C, NKG2D, and CD94 SNPs based on the genotyping of 204 healthy donors. Positive LD shaded blue; negative LD shaded red. (C) NKG2A frequency and MFI stratified by CD94 SNPs. (D) NKG2A MFI stratified by CD94 SNPs, in conjunction with NKG2A variants. (E) NKG2A+ NK cells frequency stratified by NKG2C SNPs and HCMV serostatus. (F) NKG2A MFI stratified by NKG2C SNPs and CD56 cell surface expression levels. (G) NKG2A MFI on CD56dim NK cells stratified using NKG2D SNPs. For panels C-E, t tests were performed, and mean ± SEM is presented to analyze NKG2A frequencies. For panels C-D,F-G, Mann-Whitney tests were performed, and median ± IQRs are presented to analyze NKG2A MFI. LD was assessed using the χ2 test for panel B. Symbols represent individual samples. ∗P < .05; ∗∗P < .01; ∗∗∗P < .001; ∗∗∗∗P < .0001.
Figure 3.
Figure 3.
NKG2A surface density and frequency impact NK cell responsiveness. (A) Correlation between NKG2A MFI and degranulation of NKG2A+ CD56dim and CD56bright NK cells in a CD107a. (B) NKG2A-SP CD56dim or CD56bright NK cell degranulation and IFN-γ frequency stratified by SNP rs2734440 (440C represents rs2734440 T). (C) Correlation between NKG2A+ NK cell frequency and global NK cell degranulation. (D) Total NK cell degranulation and IFN-γ frequency in CD56dim or CD56bright NK cell stratified by SNP rs2734440. (E) Total NK cell inhibitability, measured by inhibition of CD107a and IFN-γ response in a killing assay against K562 HLA-E KO or K562 transduced with HLA-E in NKG2A high (440 C/C, n = 7) and low (440 T/T, n = 8) expression groups, as defined by the NKG2A genotype. Correlations were assessed using the Pearson correlation coefficient for panels A,C. Mann-Whitney tests were performed and median ± IQRs are presented in panels B,D. For panel E, t tests were performed, and mean ± SEM is presented. Symbols represent individual samples. ∗P < .05; ∗∗P < .01; ∗∗∗P < .001; ∗∗∗∗P < .0001.
Figure 4.
Figure 4.
HLA-E expression depends on the quantity of HLA class I signal peptide available and associates with HLA-C epitopes. All HLA MFI were measured on CD3+ CD56 T cells. (A) HLA-E MFI segregated by HLA-B leader peptide, HLA-E allele, or HLA-C epitope. (B) HLA-E MFI is segregated by HLA-E and HLA-C epitopes or by HLA-B leader peptide and HLA-C epitopes. (C) Correlation between HLA-E MFI and HLA class I expression, as measured by anti-HLA-ABC, anti-HLA-BC, and anti-HLA-C. (D) HLA-ABC and -E MFI grouped by HLA-C alleles, color-coded by HLA-C KIR ligand epitope, and ranked in ascending order. (E) HLA-ABC MFI segregated by HLA-B leader peptide, HLA-E allele, and HLA-C epitope. For panels A-B,E, t tests were performed, and mean ± SEM is presented. Correlations were assessed using the Pearson correlation coefficient for panel C. Symbols represent individual samples. ∗P < .05; ∗∗P < .01; ∗∗∗P < .001; ∗∗∗∗P < .0001.
Figure 5.
Figure 5.
HLA-C epitopes impact NKG2A expression and NK cell function. (A) NKG2A+ NK cell frequency and MFI stratified by the SNP rs2734440 in 400 healthy blood donors. (B) NKG2A+ NK cell frequency and NKG2A MFI stratified by the HLA-C KIR ligand epitope and HCMV serostatus. (C) NKG2A+ NK cell frequency and MFI stratified by HLA-C epitope, NKG2A SNP genotype, and HCMV serostatus. (D) Degranulation response of NKG2A-SP CD56dim NK cells to K562 HLA-E KO segregated by HLA-C KIR ligand epitope. (E) Global NK inhibition in C1/C1 and C2/C2 in HCMV+ individuals with the NKG2A 440C/C (high) genotype, as measured by change in CD107a response to K562 HLA-E KO vs K562 transduced with HLA-E. For panels, A-C,E, t tests were performed, and mean ± SEM is presented to analyze NKG2A frequencies. Mann-Whitney tests were performed and median ± IQRs are presented to analyze NKG2A MFI for panels A-C. Symbols represent individual samples. ∗P < .05; ∗∗P < .01; ∗∗∗P < .001; ∗∗∗∗P < .0001.

References

    1. Brooks AG, Posch PE, Scorzelli CJ, Borrego F, Coligan JE. NKG2A complexed with CD94 defines a novel inhibitory natural killer cell receptor. J Exp Med. 1997;185(4):795–800. - PMC - PubMed
    1. Mingari MC, Ponte M, Bertone S, et al. HLA class I-specific inhibitory receptors in human T lymphocytes: interleukin 15-induced expression of CD94/NKG2A in superantigen- or alloantigen-activated CD8+ T cells. Proc Natl Acad Sci U S A. 1998;95(3):1172–1177. - PMC - PubMed
    1. Angelini DF, Zambello R, Galandrini R, et al. NKG2A inhibits NKG2C effector functions of gammadelta T cells: implications in health and disease. J Leukoc Biol. 2011;89(1):75–84. - PubMed
    1. Raulet DH. Interplay of natural killer cells and their receptors with the adaptive immune response. Nat Immunol. 2004;5(10):996–1002. - PubMed
    1. Kim S, Poursine-Laurent J, Truscott SM, et al. Licensing of natural killer cells by host major histocompatibility complex class I molecules. Nature. 2005;436(7051):709–713. - PubMed

Publication types

MeSH terms

Substances