. 2024 Nov 4;223(11):e202311137.
doi: 10.1083/jcb.202311137. Epub 2024 Aug 19.

A complex of the lipid transport ER proteins TMEM24 and C2CD2 with band 4.1 at cell-cell contacts

Affiliations

A complex of the lipid transport ER proteins TMEM24 and C2CD2 with band 4.1 at cell-cell contacts

Ben Johnson et al. J Cell Biol. .

Abstract

Junctions between the ER and plasma membrane (PM) are implicated in calcium homeostasis, non-vesicular lipid transfer, and other cellular functions. Two ER proteins that function both as tethers to the PM via a polybasic C-terminus motif and as phospholipid transporters are brain-enriched TMEM24 (C2CD2L) and its paralog C2CD2. We report that both proteins also form a complex with band 4.1 family members, which in turn bind PM proteins including cell adhesion molecules such as SynCAM 1. This complex enriches TMEM24 and C2CD2 containing ER/PM junctions at sites of cell contacts. Dynamic properties of TMEM24-dependent ER/PM junctions are impacted when band 4.1 is part of the junction, as TMEM24 at cell-adjacent ER/PM junctions is not shed from the PM by calcium rise, unlike TMEM24 at non-cell adjacent junctions. Lipid transport between the ER and the PM by TMEM24 and C2CD2 at sites where cells, including neurons, contact other cells may participate in adaptive responses to cell contact-dependent signaling.


Conflict of interest statement

Disclosures: All authors have completed and submitted the ICMJE Form for Disclosure of Potential Conflicts of Interest. T. Biederer reported grants from Reckitt Benckiser LLC outside the submitted work. No other disclosures were reported.

Figures
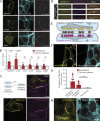
Figure 1.
Figure 1.
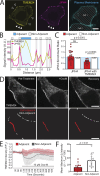
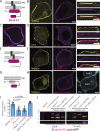
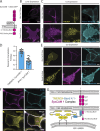
Large TMEM24-positive ER/PM junctions at cell–cell interfaces. (A) Left: Spinning disk confocal images of TMEM24-mCherry, C2CD2-eGFP, and JPH4-eGFP in HEK293 cells. Center: plasma membranes labeled with CellBrite 650 dye. Faint diagonal lines have been added to indicate regions of the micrographs occupied by the cells. Right: ER/PM junctions from the left fields with cell-adjacent ER/PM junctions are outlined in red. (B) ROIs were drawn around regions of the plasma membrane touching an adjacent cell or facing open space and the mean fluorescence intensity of the indicated proteins within those regions was measured. An enrichment ratio was calculated for each cell by dividing the mean fluorescent intensity at adjacent regions by the mean non-adjacent fluorescent intensities. Student’s t test; P values of P = 0.0010 for TMEM24 and P = 7.12902E-07 for C2CD2. (C and D) Cells expressing TMEM24-eGFP and TMEM24-mCherry were coplated as illustrated by the diagram. (C) TMEM24 expressed in adjacent cells forms symmetrical ER/PM junctions. (D) Gaps in the TMEM24 signal (indicated by arrowheads) in one cell are mirrored by gaps in the signal of the adjacent cell. (E) Diagram illustrating TMEM24 behavior in adjacent cells expressing TMEM24. (F) TMEM24 tagged with GFP at the endogenous locus in IMR32 cells localizes preferentially to the cell–cell interface. (G) Quantification of the enrichment ratio for mean fluorescence of TMEM24 tagged at the endogenous locus (endoTMEM24) at regions of IMR32 cells that face adjacent cells or empty space in the dish. As endoTMEM24 signal may stem from both adjacent cells, the observed fluorescence at the adjacent region has been halved and compared against non-adjacent regions (P = 0.000000003, n = 24 cells). (H) Differentiated IMR32 cells show that endoTMEM24 fluorescence is preferentially localized at sites of cell–cell contact as in the undifferentiated IMR32 cells. In F and H, the plasma membrane was labeled with CellBrite 650 dye. Diagonal lines indicate regions of the micrographs occupied by cells to clearly differentiate these regions from empty spaces. Scale bars = 5 μm.
Figure S1.
Figure S1.
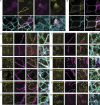
Several ER/PM tethers tested other than TMEM24 and C2CD2 display no preference for cell-adjacent ER/PM junctions. ER/PM junctions positive for exogenously expressed E-Syt2-eGFP (A), Kv2.1(S601,607D-eGFP (B), or YFP-STIM1(D76A) (C) in HEK293 cells show no differences in size depending on cell adjacency. Quantification of this data can be found in Fig. 1 B. Plasma membranes were determined using DiI and cell regions traced for ease of identification. Scale bars = 5 μm.
Figure S2.
Figure S2.
TMEM24, but not other ER/PM tethers, concentrate as cell–cell junctions. HEK293 cells. (A and B) TMEM24 expressed in one cell generates enlarged ER/PM junctions that are not mirrored by eGFP-ESyt2-positive or eGFP-JPH4-positive junctions in directly adjacent cells. (C) The accumulation of TMEM24-mCherry expressed in one cell at a cell-adjacent ER/PM junction is mirrored by the accumulation of TMEM24-GFP expressed in the adjacent cell (see also Fig. 1 C). (D) ER/PM junctions induced by mCherry-ESyt2 and GFP-ESyt2-expressed in two adjacent cells respectively, do not mirror one another across the cell–cell interface. (E) mCherry-JPH4 and GFP-JPH4 do not robustly mirror one another across the cell–cell interface although junctions could be found that seemed to be symmetrically opposed. (F) eGFP-Esyt2 colocalizes with TMEM24 at ER/PM junctions, but is excluded from the cell adjacent junction where TMEM24-GFP is selectively enriched. Line scans of the fluorescence of the two constructs along the plasma membrane are shown at right. (G) Kv2.1(S601,607D)-GFP, a Kv2.1 construct that binds constitutively to the ER protien VAP colocalizes with TMEM24-mCherry at all ER/PM junctions. Line scans of the fluorescence of the two constructs along the plasma membrane are shown at right. (H) STIM1(D76A)-GFP, a STIM1 construct that constitutively binds the PM, colocalizes with TMEM24-mCherry at all ER/PM junctions. Line scans of the fluorescence of the two constructs along the plasma membrane are shown at right.
Figure 2.
Figure 2.
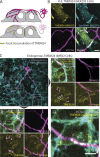
TMEM24-positive cell-adjacent ER–PM junctions exhibit distinct characteristics. (A) TMEM24-mCherry and JPH4-eGFP colocalize at ER/PM junctions that are non-cell adjacent (open arrowheads represent a few examples contained within the image) but JPH4 is excluded from TMEM24-induced cell-adjacent ER/PM junctions (solid arrowheads). The plasma membrane was labeled with CellBrite 650 and diagonal lines indicate regions of the micrograph occupied by cells. (B) Representative line scan of a cell membrane demonstrating fluorescence increases in both TMEM24 and JPH4 channels at ER/PM junctions with the exception of the cell–cell contact area where TMEM24 signal increases and JPH4 signal is lacking. (C) Enrichment ratios of JPH4 expressed alone or with TMEM24. When solely expressed, the adjacent and non-adjacent ratios for JPH4 are not significantly different. Expressed with TMEM24, the adjacent ratio of JPH4 is significantly decreased compared with the non-adjacent value (P = 1.47845E-08) as well as significantly decreased compared with the adjacent value when expressed alone (P = 3.62696E-05). (D) Images of TMEM24-mCherry cell adjacent and cell non-adjacent ER/PM junctions before and after addition of 10 μM Oxotremorine-M (OxoM). Junctions that are cell-adjacent and cell non-adjacent are indicated in lower panels. (E) TMEM24 response to treatment of 10 μM OxoM separated by cell-adjacent and cell non-adjacent TMEM24 fluorescence over time and normalized to an average pre-treatment fluorescence level. (F) Maximal average fluorescence change in TMEM24 signal at cell-adjacent and cell non-adjacent ER/PM junctions. Student’s t test returned a value of P = 0.01. All images are from HEK293 cells and were acquired by confocal microscopy. Scale bars = 5 μm.
Figure 3.
Figure 3.
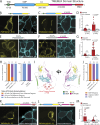
A β-sheet within the TMEM24 C-terminus is responsible for its targeting to cell-adjacent ER/PM junctions. HEK293 cells. (A) TMEM24 domain architecture. TMD = transmembrane region; PBM = polybasic motif. (B) Fragment 1- 414 is diffusely ER localized and does not localize to ER/PM junctions at any location. Representative example of n = 42 cells. (C) Fragment 1–630 is localized at ER/PM junctions at sites of cell–cell contact. Representative example of n = 31 cells. (D) Quantification of the enrichment ratios for TMEM24(1–414) and TMEM24(1–630) fragments (P = 0.10388 and P = 2.80624E-05, respectively). (E) The TRAPγ-eGFP has a diffuse ER localization. Representative example of n = 34 cells. (F) TRAPγ-(414–630)-eGFP hybrid construct localizes to ER/PM junctions at sites of cell–cell contact. Representative example of 101 cells. (G) Quantification of the enrichment ratios for TRAPγ and TRAPγ-(414–630) (P = 0. 0.1306 and P = 3.03836E-12, respectively). (H) Percentages of cells expressing TMEM24, TMEM24(1–414), TMEM24(1–630), TRAPγ, and TRAPγ-(414–630) with accumulation of these proteins at the regions indicated. Percentages are as follows for both regions, adjacent only, and no accumulation, respectively: for TMEM24 97.2%, 2.7%, 0%, n = 73; for TMEM24(1–630) 22.6%, 74.2%, 3.2%, n = 31; for TMEM24(1–414) 0%, 0%, 100%, n = 42; for TRAPγ 0%, 0%, 100%, n = 34; for TRAPγ-(414–630) 1.0%, 93.0%, 6.0%, n = 101. (I) Alphafold predicted structure of a TMEM24 monomer in two different orientations. (J) Percentages of cells expressing TMEM24, TMEM24(5S→E), and TMEM24(Δβ + 5S→E) with the accumulation of these proteins at the regions indicated. Percentages are as follows for both regions, adjacent only, and no accumulation, respectively for TMEM24 97.2%, 2.7%, 0%, n = 73; for TMEM24(5S→E) 6.1%, 89.8%, 4.1%, n = 49; for TMEM24(Δβ + 5S→E) 8.3%, 4.2%, 87.5%, n = 24. (K) A full-length TMEM24 with the 5S→E mutations in the PBM domain is selectively localized at cell-adjacent regions of the PM. Representative example of n = 49 cells. (L) Disruption of both the PBM (accomplished via the 5S→E mutation) and the TMEM24 C-terminal β-sheet interferes with TMEM24’s ability to localize at any ER/PM junction. Representative example of n = 24 cells. (M) Quantification of the enrichment ratios for TMEM24(5S→E) and TMEM24(Δβ + 5S→E) (P = 1.51225E-05 and P = 0.168213084, respectively). The plasma membranes for all micrographs in the figure were labeled with CellBrite 650 dye and diagonal lines indicate regions occupied by cells. Scale bars = 5 μm.
Figure S3.
Figure S3.
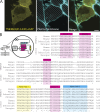
A C-terminal fragment of TMEM24 that contains a conserved small β-sheet is a soluble protein that accumulates at cell–cell junctions. (A) The 414–630 C-terminal portion of TMEM24 is a soluble cytosolic protein that concentrates at cell–cell contacts in HEK293 cells. Cell membranes were labeled with CellBrite 650 and diagonal lines indicate regions of the micrographs occupied by cells to clearly differentiate these regions from empty spaces. Scale bar = 5 µM. (B) Sequence alignments of portions of the C-terminal regions of TMEM24 and C2CD2 across species demonstrating conservation of predicted α-helixes and β-strands. The cartoon at the top left shows a schematic view of a TMEM24 monomer, with an enlarged view of the Alphafold predicted structural motifs (colored) within its 414–630 amino acid region.
Figure 4.
Figure 4.
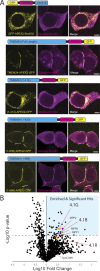
APEX2 proximity biotinylation identifies TMEM24 protein neighbors. (A) Schematic representations and confocal images of APEX2 conjugated proteins expressed in HEK293 cells and used in the APEX screen. After the APEX reaction cells were fixed, labeled with CF640R streptavidin to visualize biotinylated proteins and imaged via confocal microscopy. (B) Volcano plot of proteins identified via mass spectrometry after streptavidin-based purification. Significantly enriched proteins are found in the upper right quadrant indicated by cyan. Student’s t test values for 4.1G, 4.1B, and 4.1R were found to be P = 0.024, P = 0.033, and P = 0.074, respectively. Scale bars = 5 μm.
Figure S4.
Figure S4.
Streptavidin affinity-purification and localization of the identified band 4.1 proteins. Anti-GFP western blots and streptavidin overlay of material affinity-purified on streptavidin bead. Numbers in parenthesis indicate amino acid boundaries of TMEM24 fragments used. Note the high degree of self-biotinylation for each construct. Source data are available for this figure: SourceData FS4.
Figure 5.
Figure 5.
Band 4.1 proteins bind TMEM24 via an interaction between a TMEM24 β-sheet motif and the C-terminal domain of Band 4.1. (A) Diagram of Band 4.1 family proteins (a cell adhesion protein is indicated by a gray rectangle). (B) Confocal images of HEK293 cells expressing TMEM24-eGFP and mCherry-4.1G. High magnification of the boxed region are shown at right. Representative example of n = 34 cells. (C) mCherry-4.1G expressed in a HEK293 cell accumulates at the plasma membrane with enrichment at regions adjacent to a neighboring cell. (D) Co-expression of JPH4-eGFP and mCherry-4.1G in HEK293 cells result in no co-enrichment at the ER/PM contact. Representative example of n = 27 cells. (E) Diagram of 4.1G(ΔCTD) with cell adhesion molecule as gray rectangle. (F) Confocal images of HEK293 cells expressing TMEM24-eGFP and mCherry-4.1G(ΔCTD). High magnification of the boxed region are shown at right. Representative example of n = 31 cells. (G) Diagram of the Mem-mCherry-4.1G(CTD) construct. (H) Confocal images of the corresponding construct co-expressed with TMEM24 in HEK293 cells. The two proteins are colocalized at ER/PM junctions, but the strong accumulation of TMEM24 at sites of cell–cell contacts is no longer observed. The panel at right shows the location of a neighboring cells stained with CellBrite 650. Representative example of n = 33 cells. (I) Pearson’s correlation analysis of the colocalization of the indicated constructs. TMEM24 and 4.1G are significantly more colocalized (Robs = 0.74) than JPH4 and 4.1G (Robs = 0.36; P = 1.96443E-14) and TMEM24 and 4.1G(ΔCTD) (Robs = 0.39; P = 1.75766E-19). TMEM24 and Mem-4.1G(CTD) also display high colocalization with one another (Robs = 0.82). (J) Anti-mCherry immunopurification from extracts expressing TMEM24-eGFP with mCherry-4.1G, mCherry-4.1G(ΔCTD) or mCherry-Mem-4.1G(CTD) showing co-enrichment of TMEM24-eGFP with mCherry-4.1G and mCherry-Mem-4.1(CTD) but not with mCherry-4.1(ΔCTD). Source data are available for this figure: SourceData F5.
Figure S5.
Figure S5.
Colocalization of paralogs and additional images of TMEM24 localization with coplated rat hippocampal neurons. (A) Colocalization of TMEM24-mCherry with band eGFP-4.1R at ER/PM junctions of HEK293 cells as seen in both a mid-cell confocal z-slice and at the basal surface. (B) Colocalization of C2CD2-eGFP with mCherry-4.1G. (C) An array of images of IMR32 cells with TMEM24 tagged at the endogenous locus with eGFP that have been coplated with DIV12-14 rat hippocampal neurons transfected with mCh-CAAX. Arrowheads indicate TMEM24-positive ER/PM junctions that are aligned with an mCh-CAAX-positive neuronal process. Chevrons indicated TMEM24-positive ER/PM junctions occurring between adjacent IMR32 cells. Scale bars = 5 µM.
Figure 6.
Figure 6.
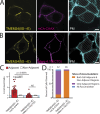
Overexpression of the membrane bound 4.1G C-terminal domain relocalizes TMEM24 away from cell-adjacent regions. (A) TMEM24(5S→E)-eGFP expressed with mCherry-CAAX control localizes to regions of the plasma membrane adjacent to a neighboring cell. (B) TMEM24(5S→E)-eGFP expressed with mCherry-Mem-4.1G(CTD) localizes to ER/PM junctions diffusely scattered across the entire PM. (C) Quantification of the enrichment ratio of TMEM24(5S→E)-eGFP when expressed with either mCherry-CAAX or mCherry-Mem-4.1G(CTD). TMEM24(5S→E)-eGFP expressed with mCh-CAAX is significantly enriched at cell-adjacent regions of the PM (P = 2.43256E-08). TMEM24(5S→E)-eGFP expressed with mCherry-Mem-4.1G(CTD) is not significantly enriched at cell adjacent regions over non-adjacent regions (P = 0.1932). The enrichment ratio for TMEM24(5S→E)-eGFP expressed with mCherry-CAAX at adjacent regions is also significantly higher than when expressed with mCherry-Mem-4.1G(CTD) (P = 7.55685E-08). (D) Percentages of cells expressing TMEM24(5S→E)-eGFP with either mCherry-CAAX or mCherry-Mem-4.1G(CTD) with accumulation of these proteins at the regions indicated. Percentages are as follows for both regions, adjacent only, and no accumulation, respectively: for TMEM24(5S→E) + mCh-CAAX 11.9%, 83.3%, 4.8%, n = 42; for TMEM24(5S→E) + mCherry-Mem-4.1G(CTD) 95.7%, 4.3%, 0%, n = 46.
Figure 7.
Figure 7.
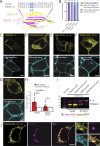
Point mutations within the 4.1 binding motif of TMEM24 disrupt its targeting to cell–cell junctions. (A) Alphafold predicted binding between the β-sheet regions of TMEM24 and 4.1G CTD, showing interlocking of their β-strands. The isoleucine residues conserved between TMEM24 and NuMA and mutated to alanine in other panels of the figure are indicated by solid cyan boxes. (B) Percent of cells with observed ER/PM contacts upon expression of the constructs indicated. Percentages are as follows for both regions, adjacent only, and no accumulation, respectively: for TMEM24(5S→E) 5.8%, 90.4%, 3.8%, n = 52; for TMEM24(I535, 536A + 5S→E) 0%, 0%, 100%; for TMEM24(I535A + 5S→E) 0%, 80%, 20%, n = 45; for TMEM24(I536A + 5S→E) 0%, 2.7%, 98.6%, n = 74. (C–F) Top: representative confocal images of cells expressing the indicated constructs. Below: plasma membranes of the cells shown above were labeled with CellBrite 650. (G) Representative confocal image of a cell expressing TMEM24(I536A) (without the additional 5S→E mutation) and of its plasma membrane labeled with CellBrite 650. (H) Quantification of the enrichment ratios of TMEM24 and TMEM24(I536A) (as in G) (P = 0.001 and P = 0.1913, respectively, with a significant difference between the ratios of P = 0.0016). (I) Anti-mCherry immunopurification from extracts expressing mCherry-4.1G with TMEM24-eGFP or TMEM24(I536A)-eGFP showing co-enrichment of TMEM24-eGFP with mCherry-4.1G, but no co-enrichment of TMEM24(I536A)-eGFP with mCherry-4.1G. (J) Representative confocal images of a cell expressing TMEM24(I536A + 5S→E)-eGFP, mCherry-sec61β, and mito-BFP. High magnifications of the boxed region, including the mCherry-sec61β signal (cyan) are shown at right. All cells of the figure are HEK293. Diagonal lines indicate regions of the micrographs occupied by cells. All scale bars = 5 μm unless otherwise noted. Source data are available for this figure: SourceData F7.
Figure 8.
Figure 8.
A TMEM24-4.1-SynCAM1 complex at sites of cellcell contact. (A) Schematic of the SynCAM 1(363)-GFP construct. (B) Confocal images of SynCAM1(363)-eGFP expressed in HEK293 cells. The upper panel is a slice at mid z level while the lower panel is shown as a basal surface. Representative example of n = 22 cells. (C) Coexpression of TMEM24-mCherry and SynCAM1(363)-eGFP in HEK293 cells. Images are of a mid-level z-slice (above) or a basal surface (below) of the cell. Plasma membrane labeled with CellBrite 650. Representative example of n = 35 cells. (D). Coexpression of JPH4-mCherry and SynCAM1(363)-eGFP in HEK293 cells. The plasma membrane was labeled with CellBrite 650. Representative example of n = 28 cells (E) Pearson’s correlation R values of comparisons of the SynCAM1(363)-eGFP fluorescence with the fluorescence of either TMEM24-mCherry or mCherry-JPH4 (P = 6.76E-11, TMEM24 n = 24, JPH4 n = 30). (F) Expression of SynCAM1(363)-eGFP, mCherry-4.1G, and TMEM24-Halo labeled with JF646 HaloTag ligand in HEK293 cells. All three proteins colocalize at ER/PM junctions. Representative example of n = 74 cells. (G) Model of the TMEM24-4.1-SynCAM 1 complex. Diagonal lines indicate regions of the micrographs occupied by cells. Scale bars = 5 μm.
Figure 9.
Figure 9.
Coculture system showing that overexpressed TMEM24 in HEK293 cells or endogenous TMEM24 in IMR32 cells localizes at contacts with rat hippocampal neurons. (A) Diagram of the coculture system showing TMEM24 accumulated beneath neuronal processes. (B) TMEM24-mCherry and SynCAM1(563)-eGFP co-expressed in HEK293 cells accumulate at contacts with axons of co-plated rat hippocampal neurons as revealed by anti-tau immunofluorescence. (C) Endogenous TMEM24 (endo-eGFP) in IMR32 cells accumulates at contacts with the neuronal processes of a coplated hippocampal neuron expressing mCherry-CAAX (magenta). PMs of the field were labeled with CellBrite 650. (Ci–Ciii) show higher magnification of the boxed regions. Note that neurons are only sparsely transfected with mCherry-CAAX so that at least some linear arrays of endo-eGFP spots not in register with mCherry-labeled axons may correspond to unlabeled axons. Magenta-filled arrowheads point to TMEM24-positive ER/PM contacts that are aligned with the mCherry neuron fluorescence. Open arrows point to TMEM24-positive ER/PM contacts between adjacent IMR32 cells. Scale bars = 5 μm.

Update of

References

    1. Amos, C., Xu P., and De Camilli P.. 2023. Erythroid differentiation dependent interaction of VPS13A with XK at the plasma membrane of K562 cells. Contact. 6:25152564231215133. 10.1177/25152564231215133 - DOI - PMC - PubMed
    1. Baines, A.J., Lu H.-C., and Bennett P.M.. 2014. The protein 4.1 family: Hub proteins in animals for organizing membrane proteins. Biochim. Biophys. Acta. 1838:605–619. 10.1016/j.bbamem.2013.05.030 - DOI - PubMed
    1. Balla, T. 2013. Phosphoinositides: Tiny lipids with giant impact on cell regulation. Physiol. Rev. 93:1019–1137. 10.1152/physrev.00028.2012 - DOI - PMC - PubMed
    1. Balla, T., Gulyas G., Kim Y.J., and Pemberton J.. 2020. Phosphoinositides and calcium signaling; a marriage arranged at ER-PM contact sites. Curr. Opin. Physiol. 17:149–157. 10.1016/j.cophys.2020.08.007 - DOI - PMC - PubMed
    1. Bharathan, N.K., Giang W., Hoffman C.L., Aaron J.S., Khuon S., Chew T.-L., Preibisch S., Trautman E.T., Heinrich L., Bogovic J., et al. 2023. Architecture and dynamics of a desmosome-endoplasmic reticulum complex. Nat. Cell Biol. 25:823–835. 10.1038/s41556-023-01154-4 - DOI - PMC - PubMed

LinkOut - more resources