. 2024 Aug 27;43(8):114650.
doi: 10.1016/j.celrep.2024.114650. Epub 2024 Aug 17.

BEAM: A combinatorial recombinase toolbox for binary gene expression and mosaic genetic analysis

Affiliations

BEAM: A combinatorial recombinase toolbox for binary gene expression and mosaic genetic analysis

Luciano C Greig et al. Cell Rep. .

Abstract

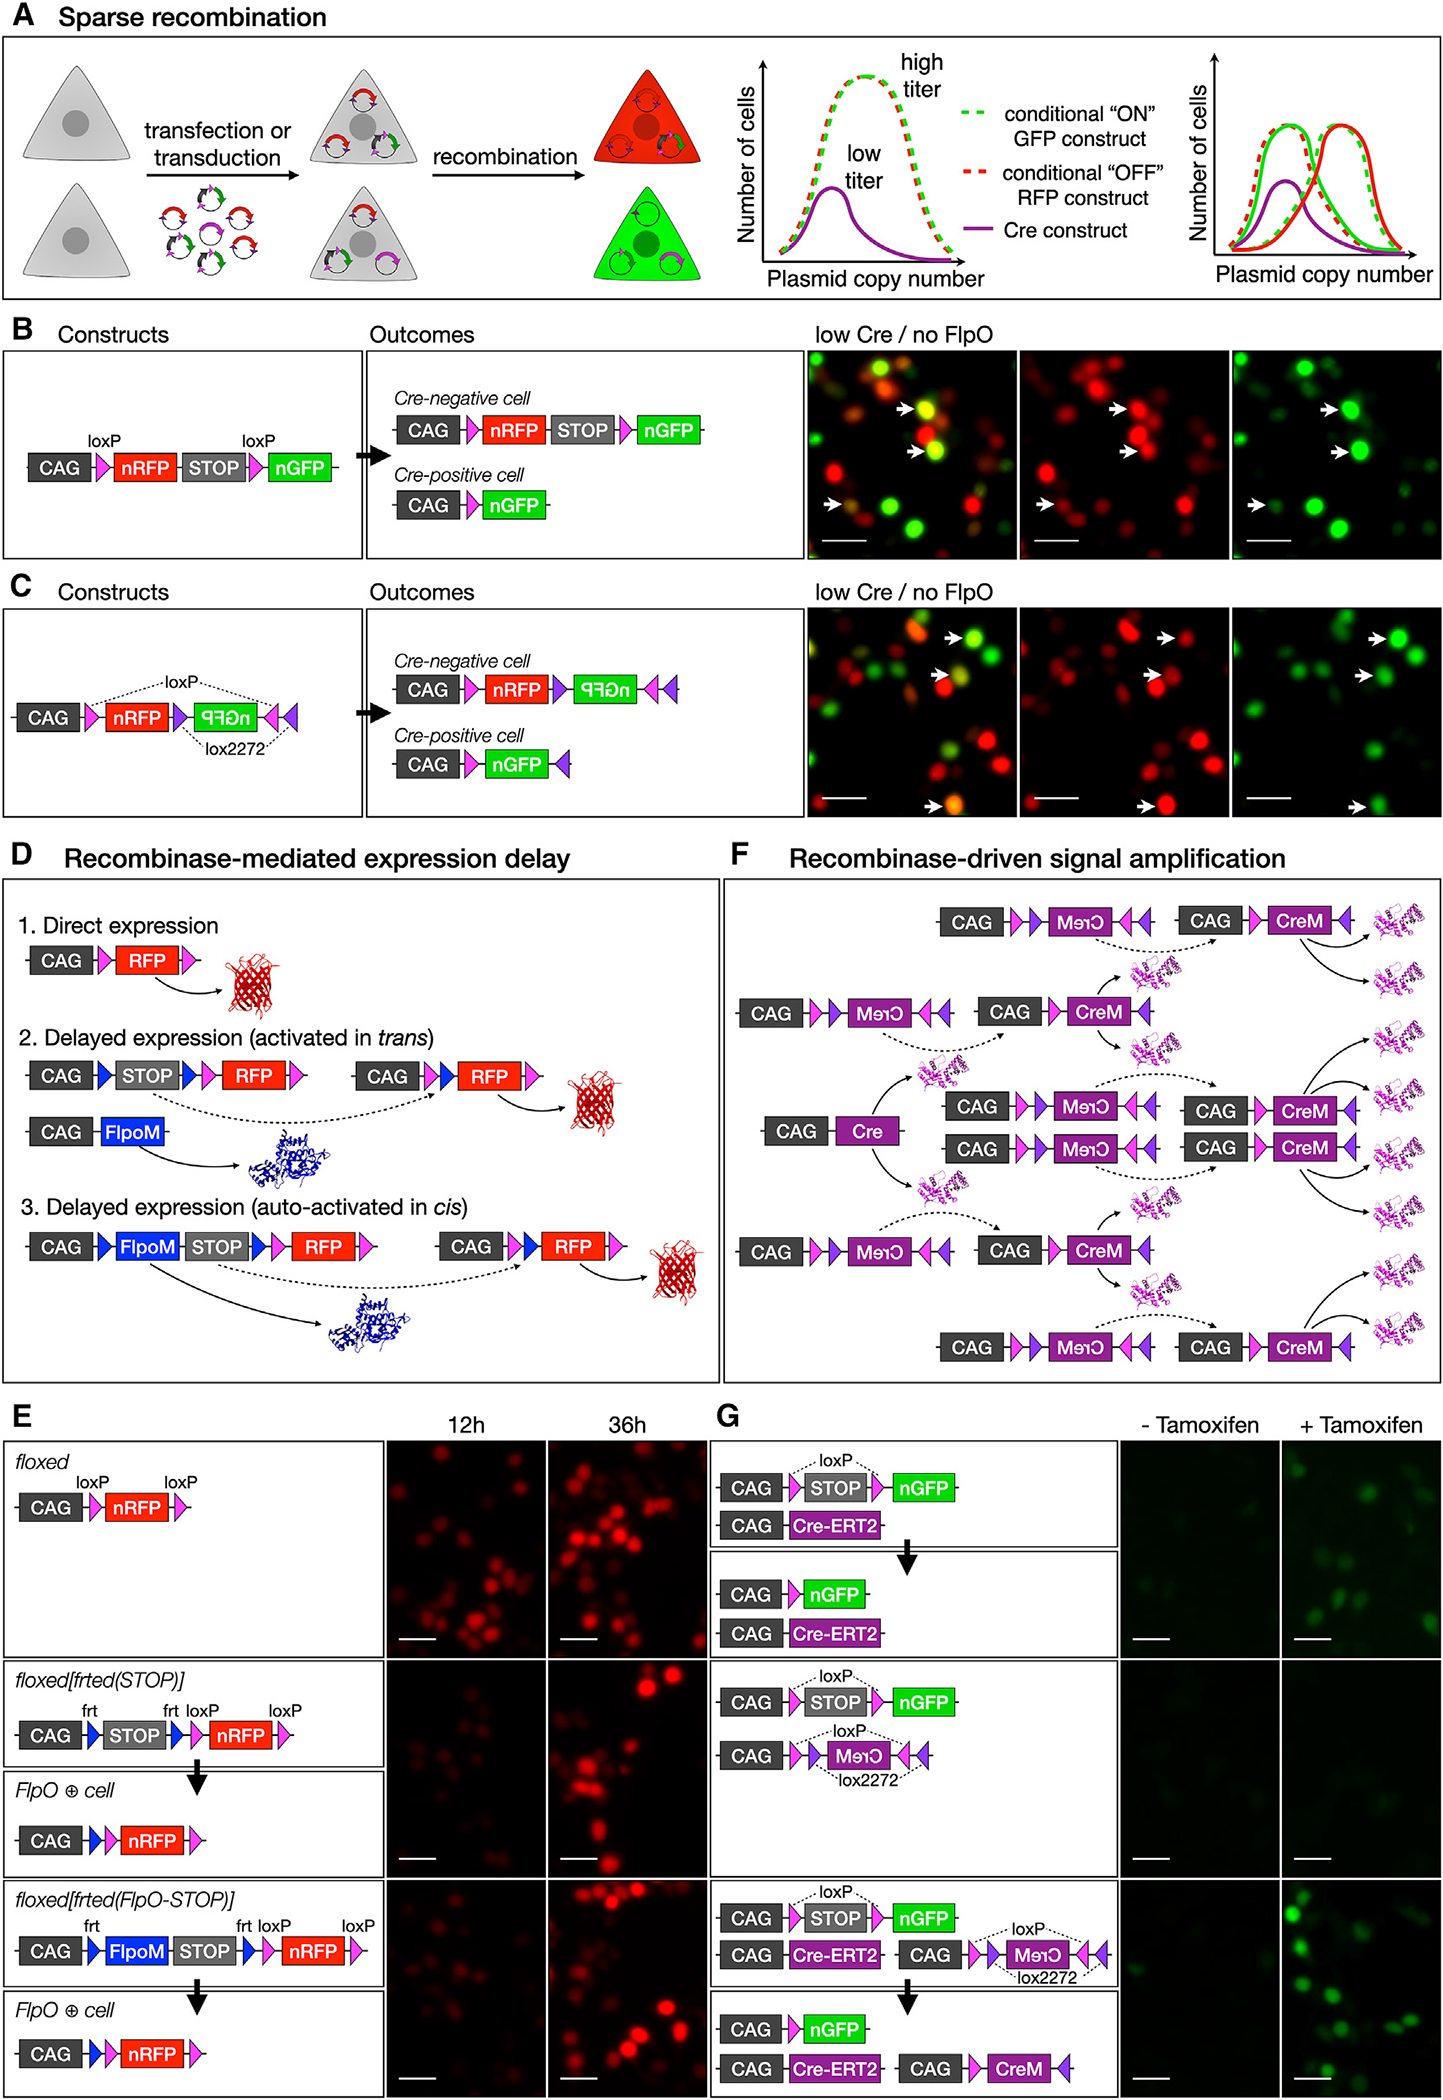
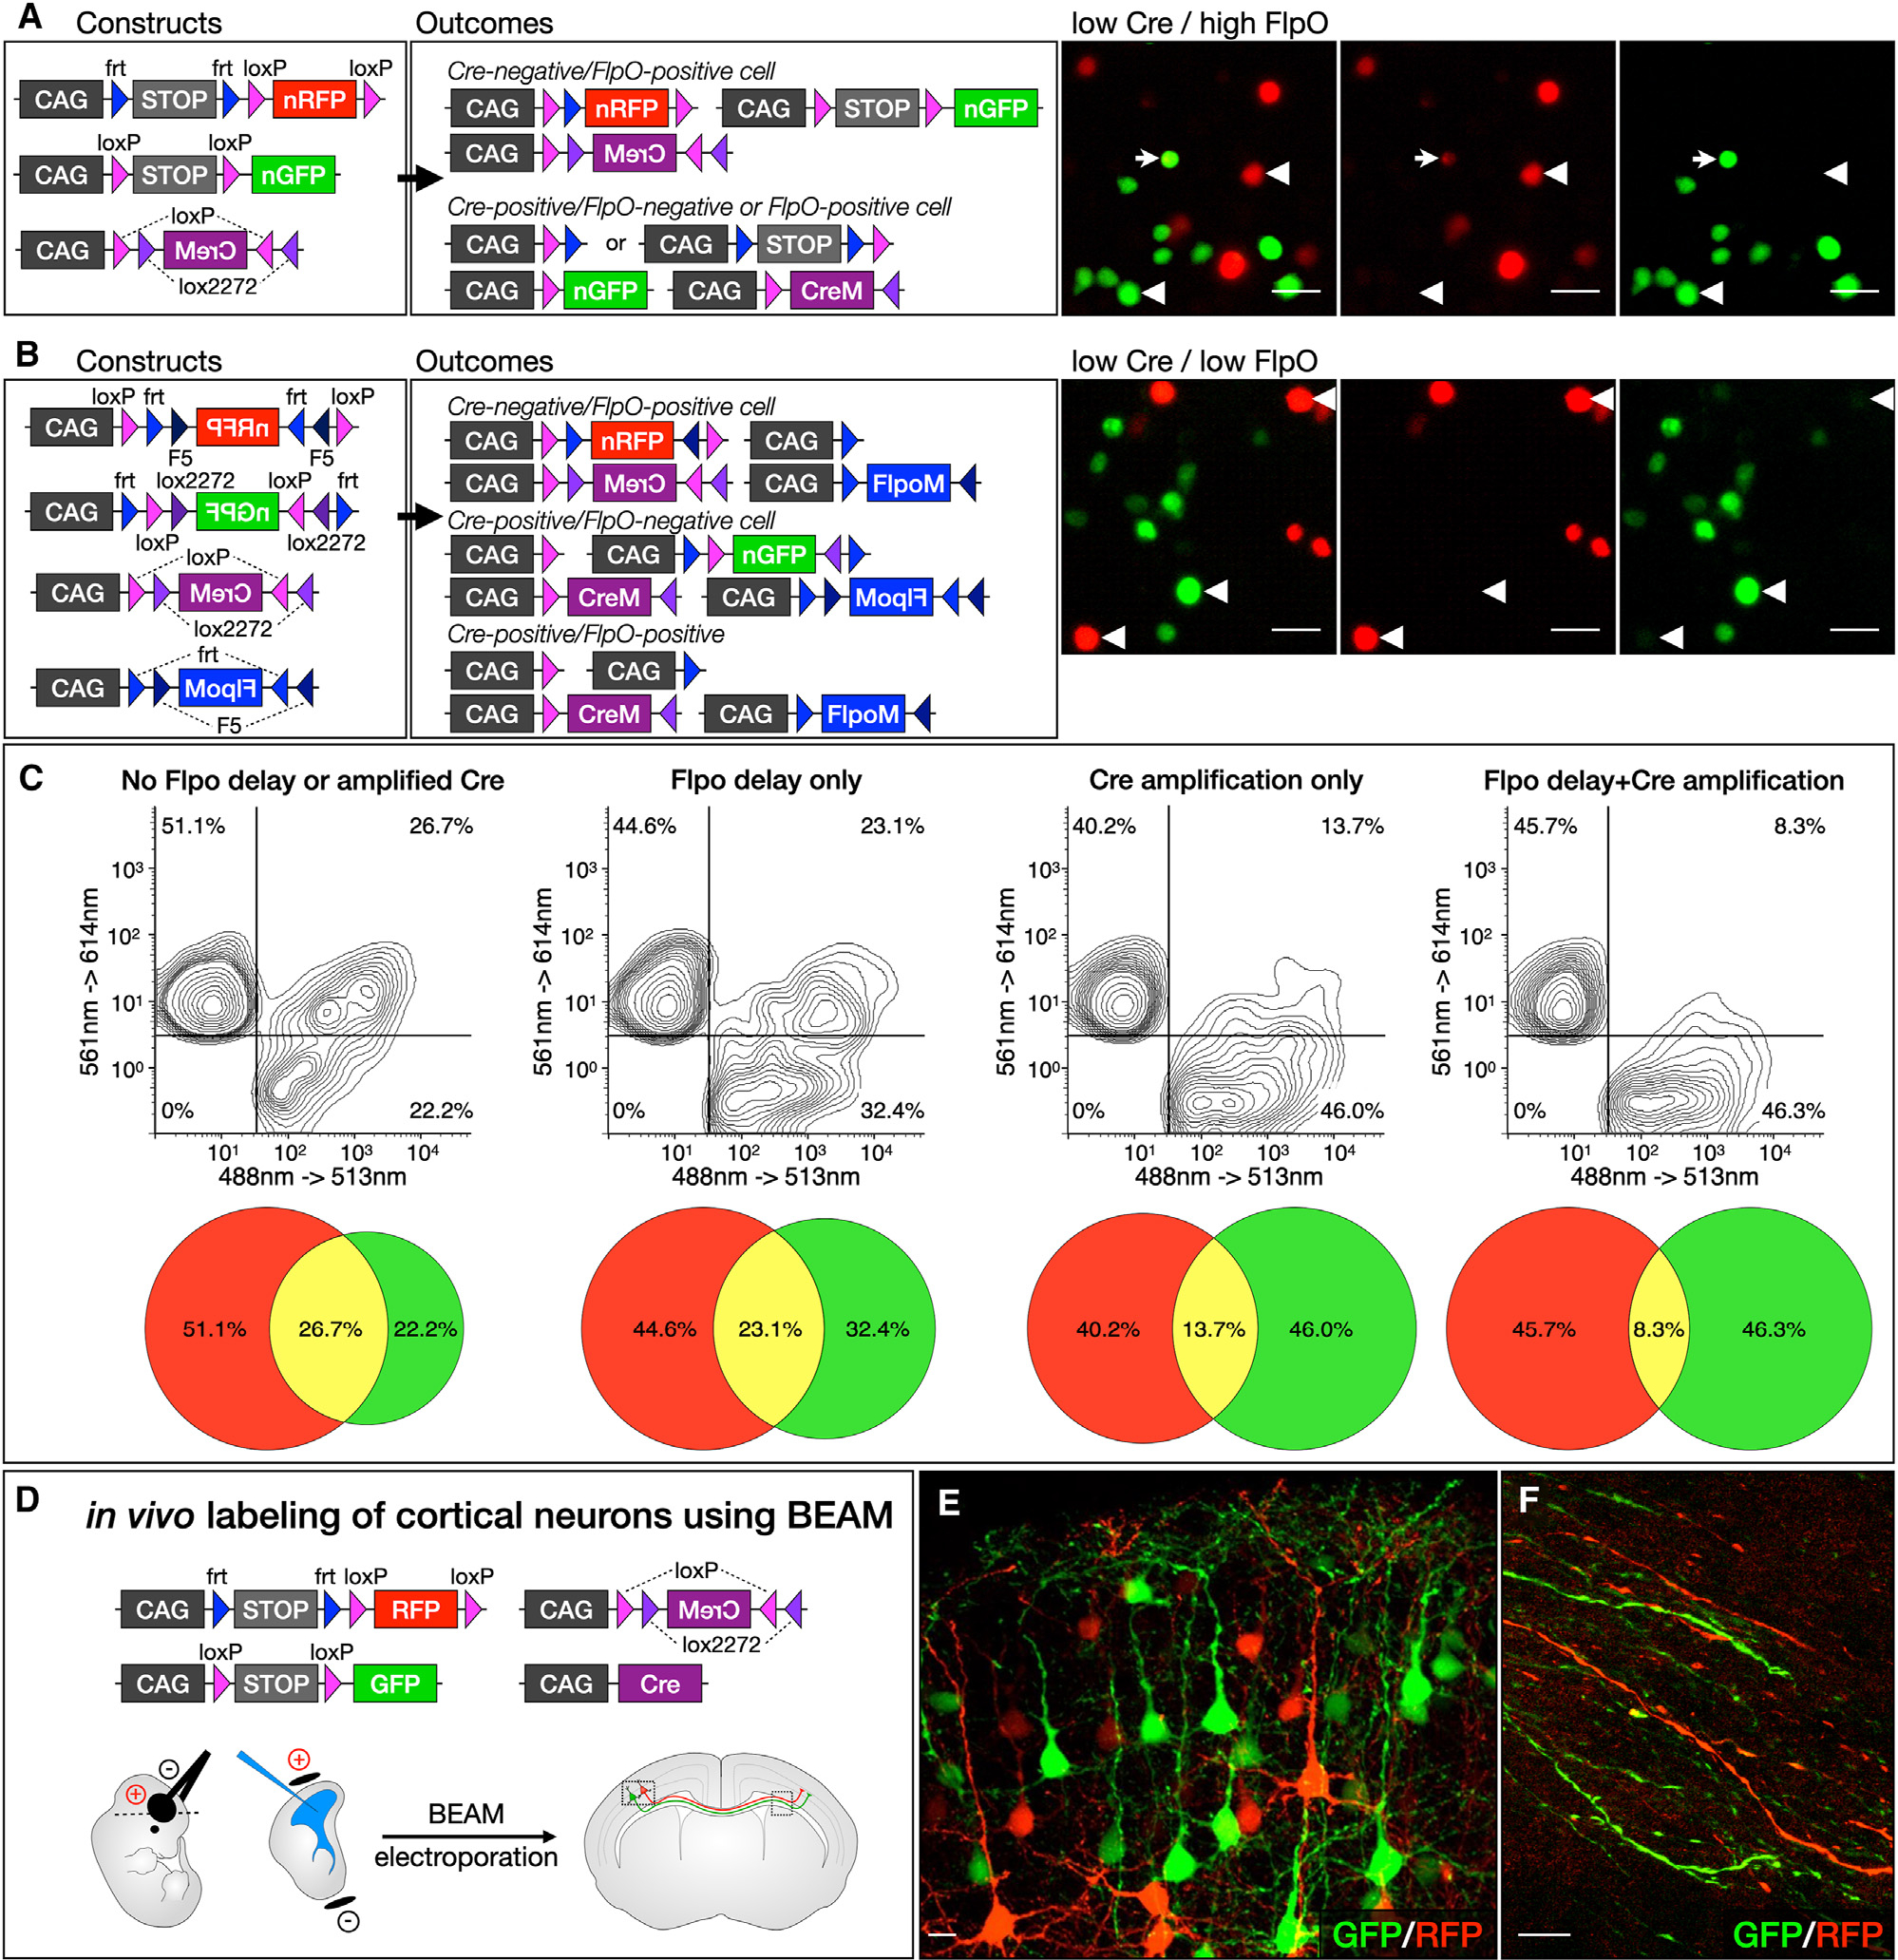
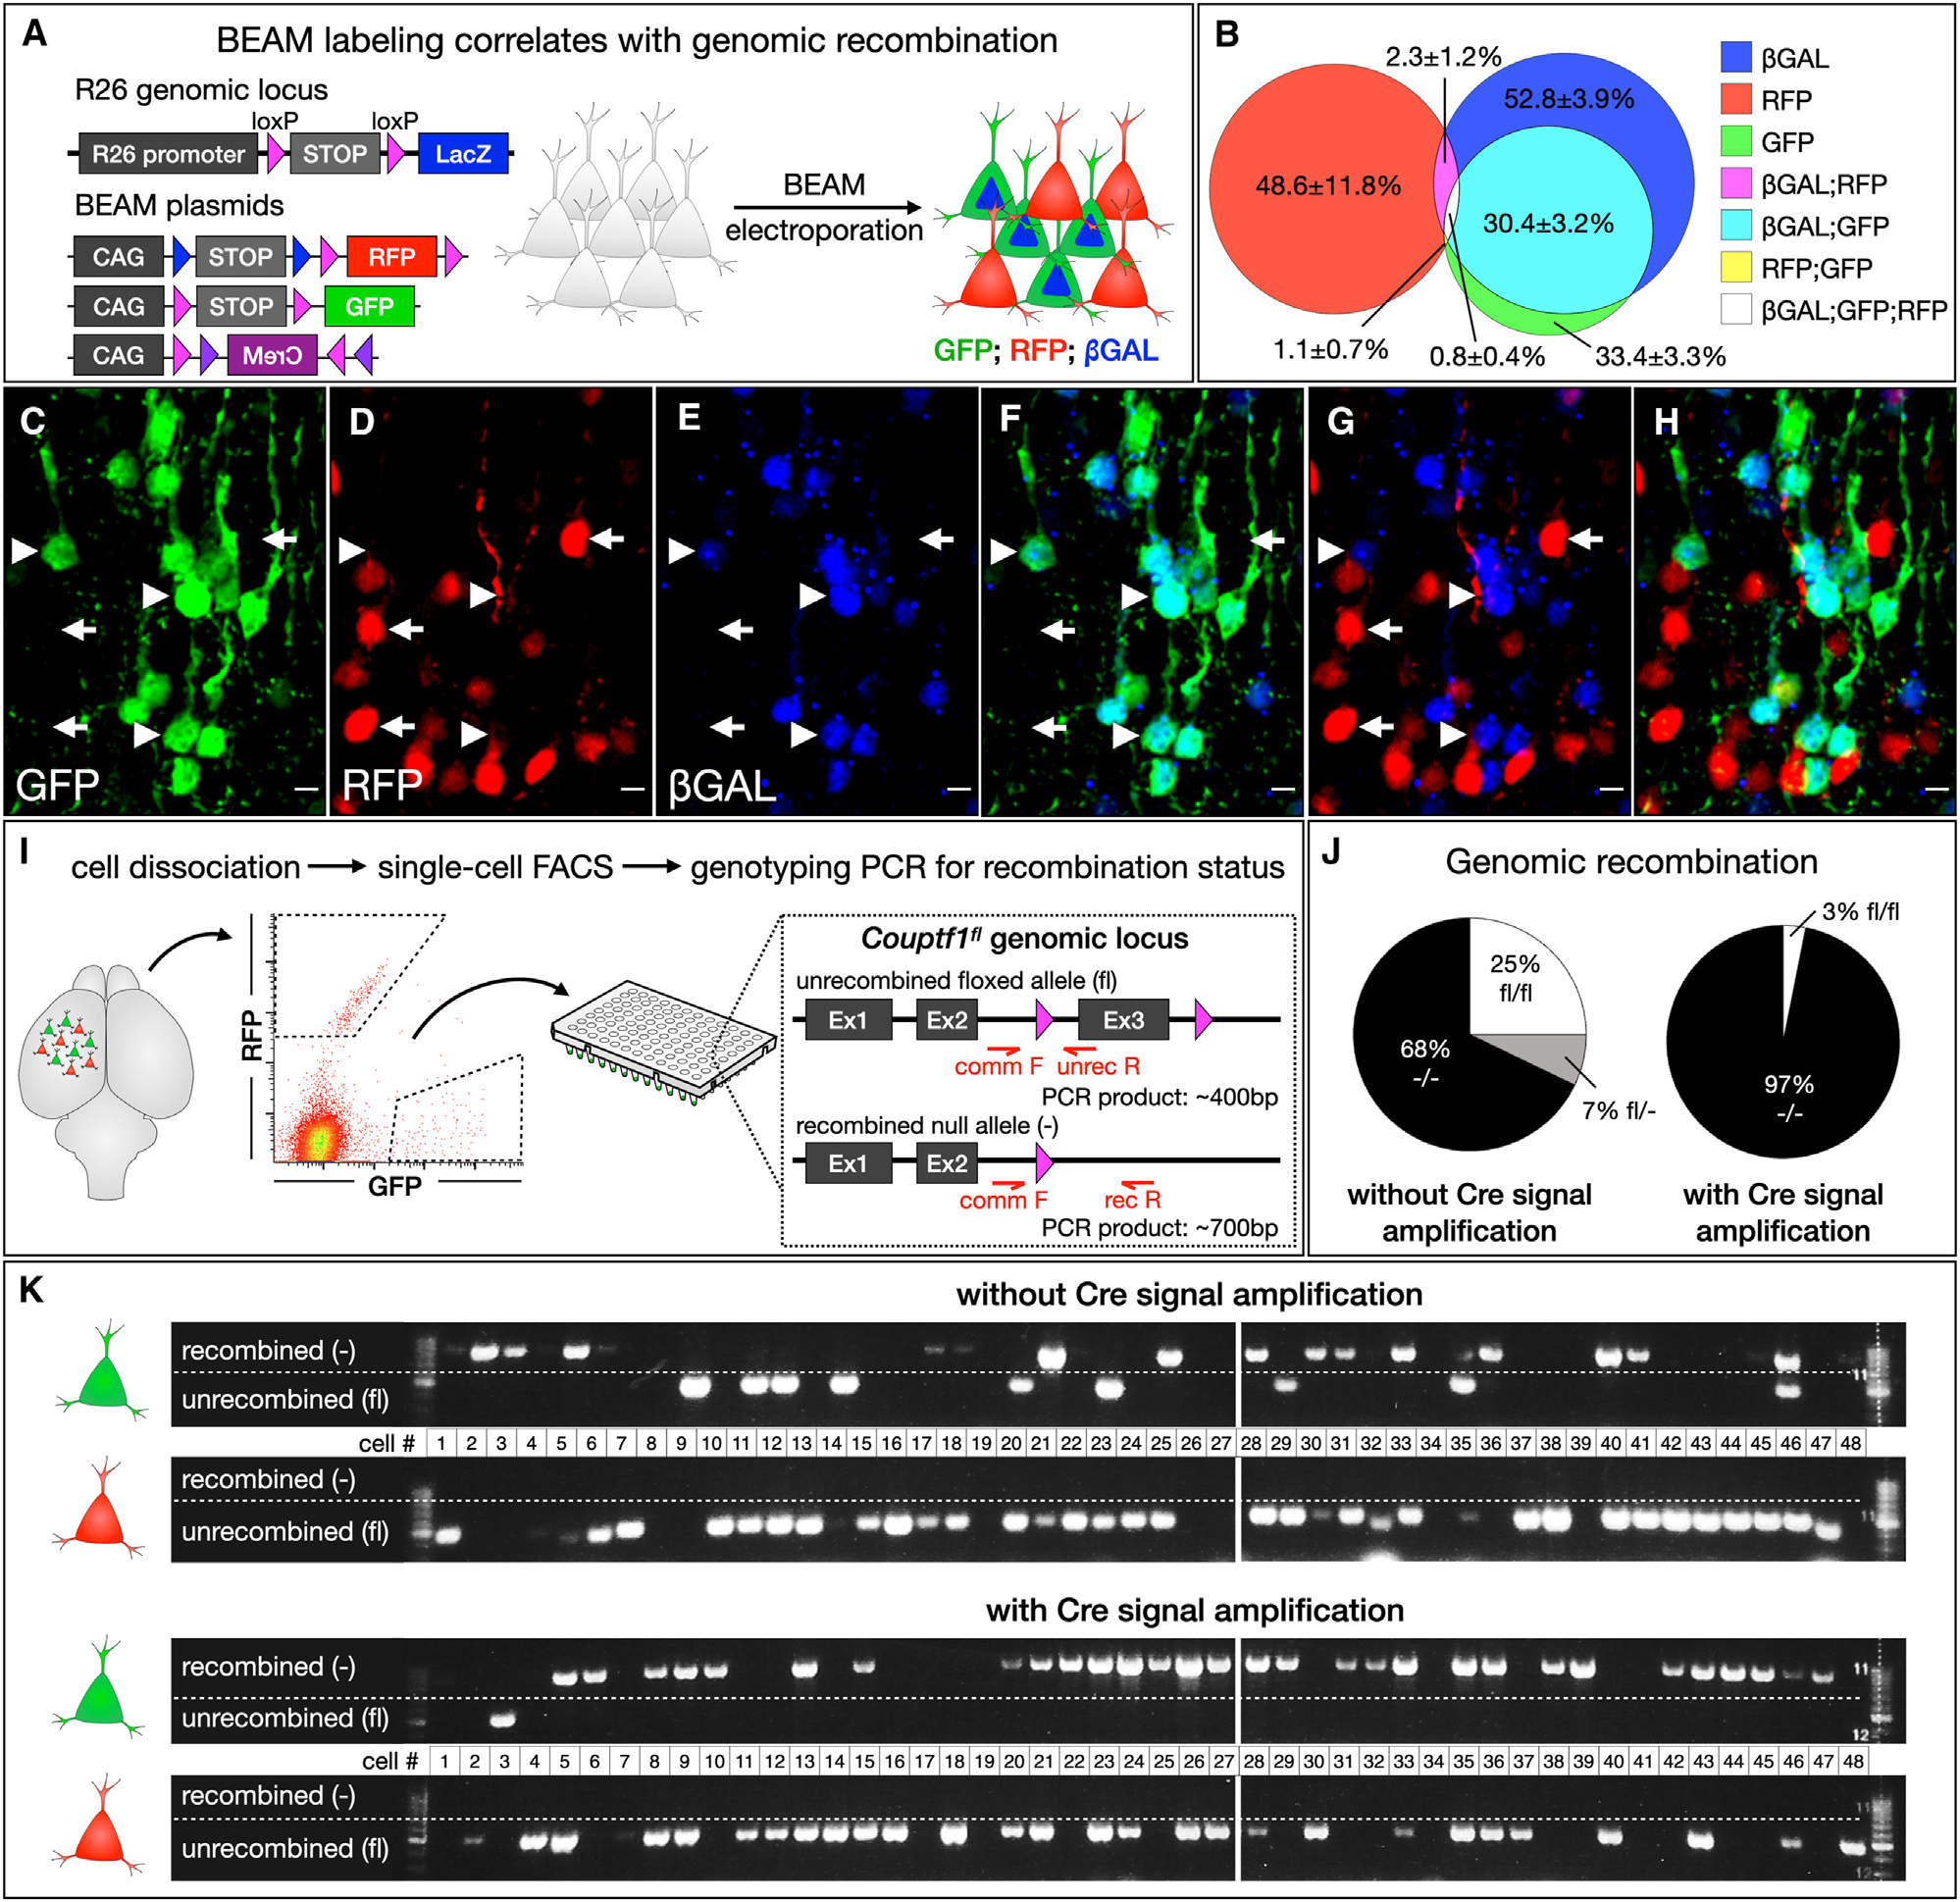
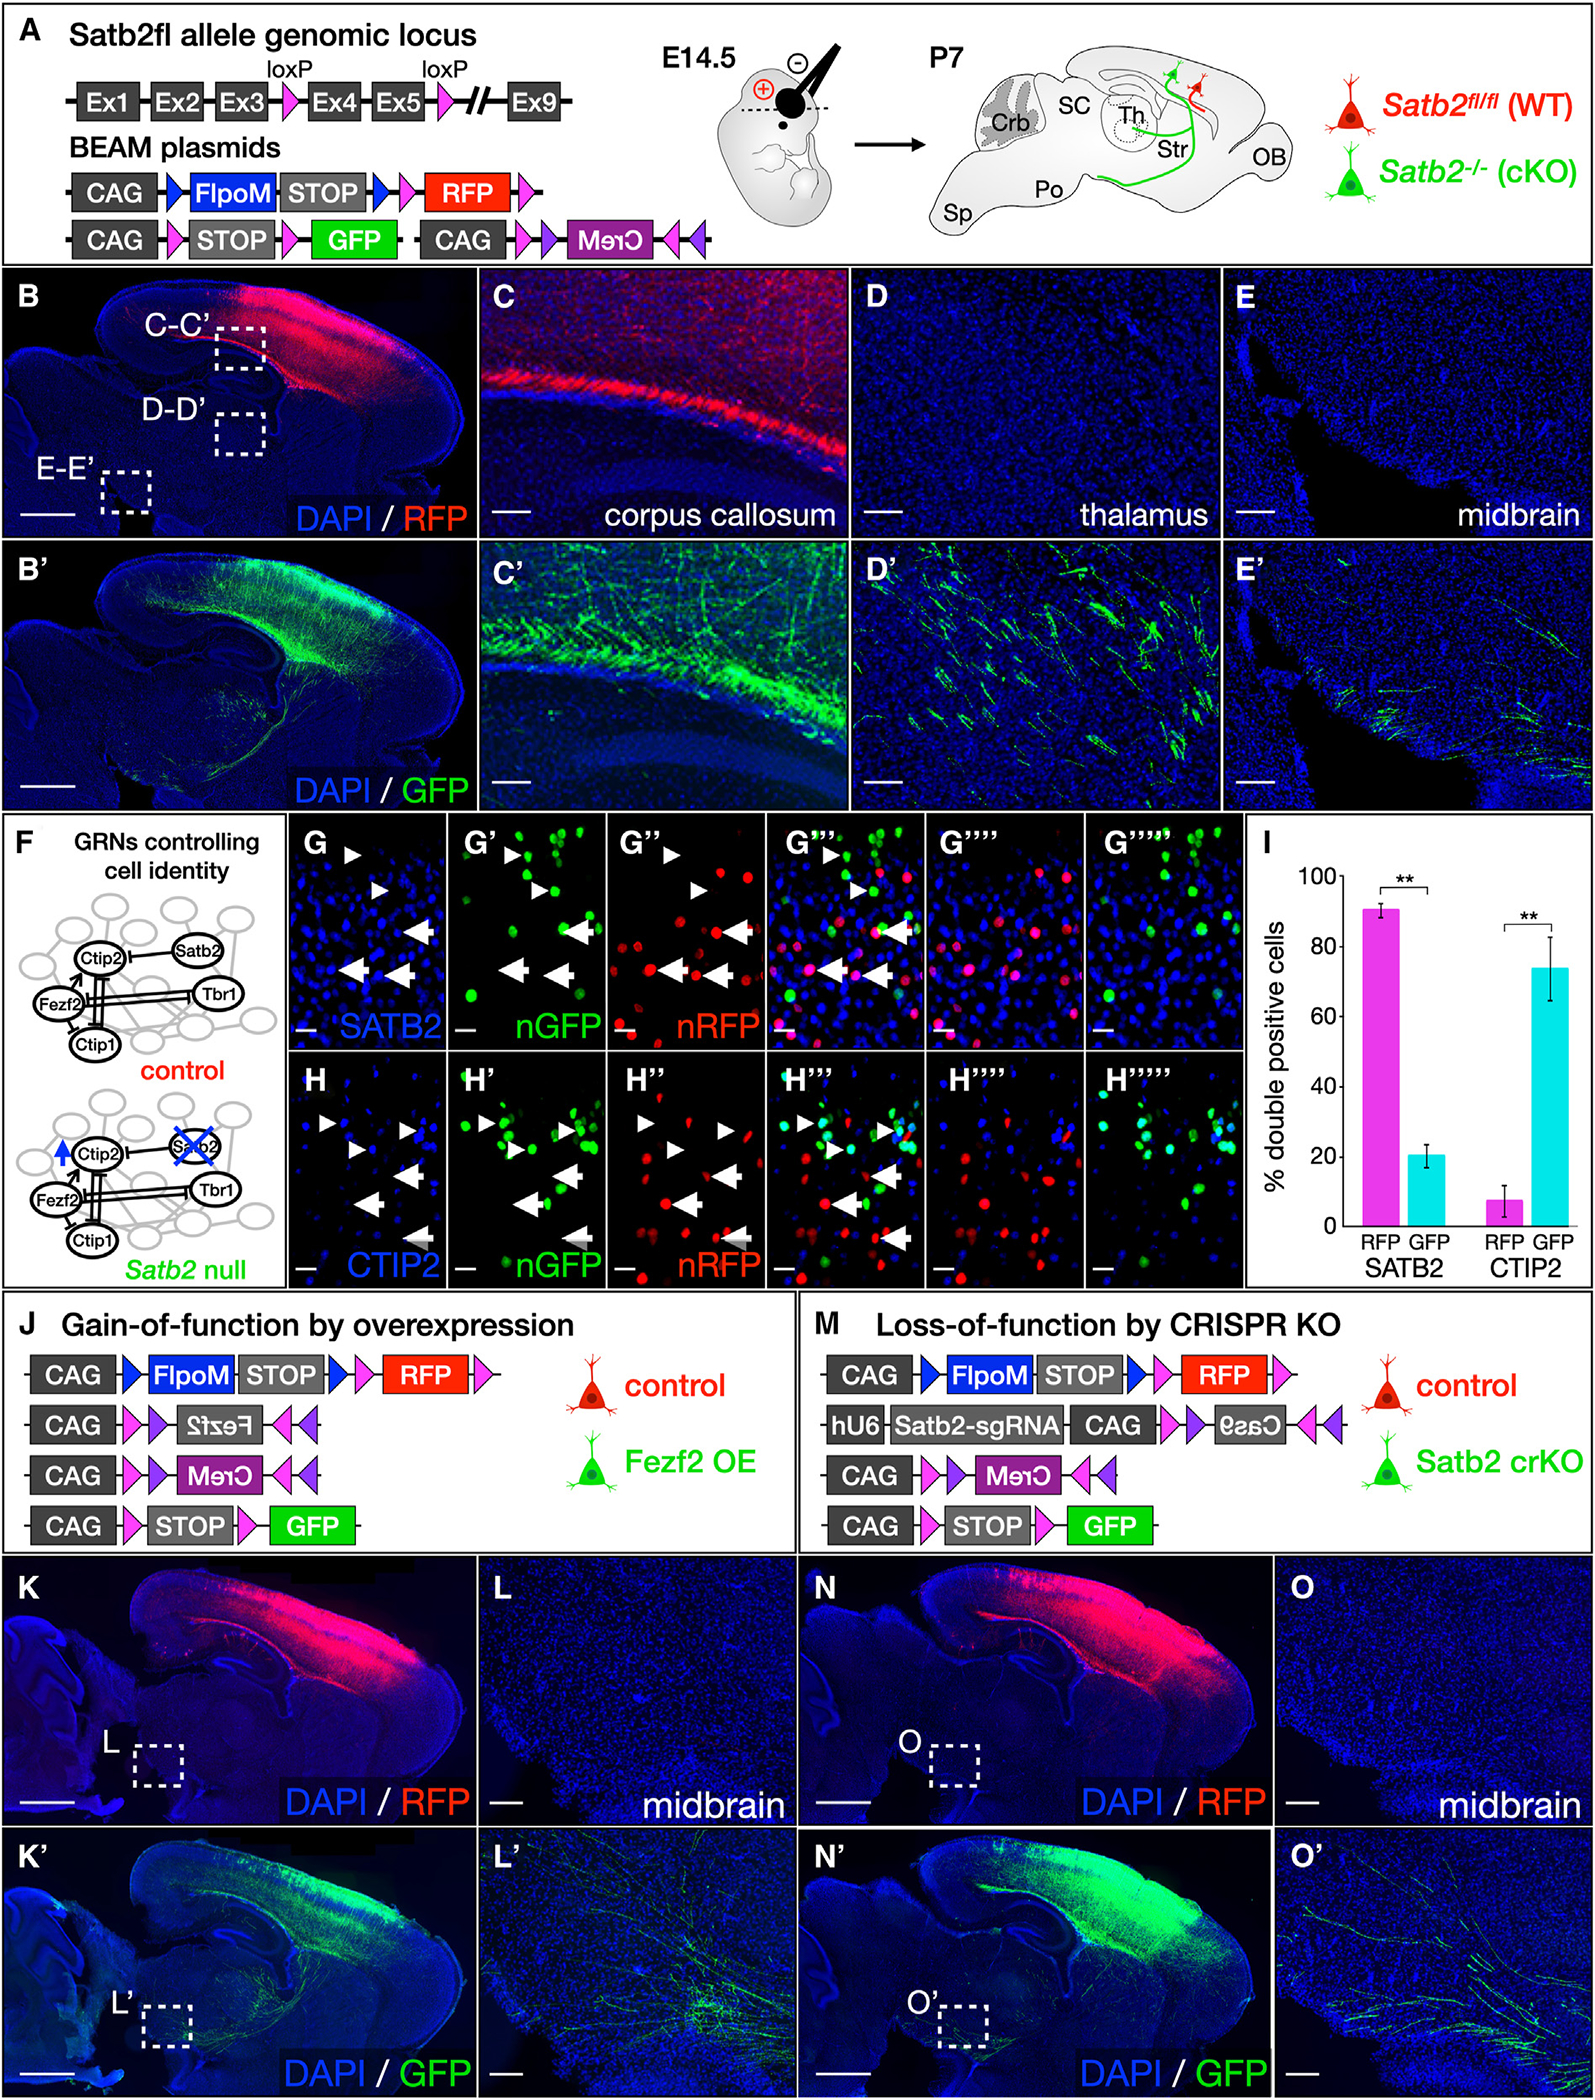
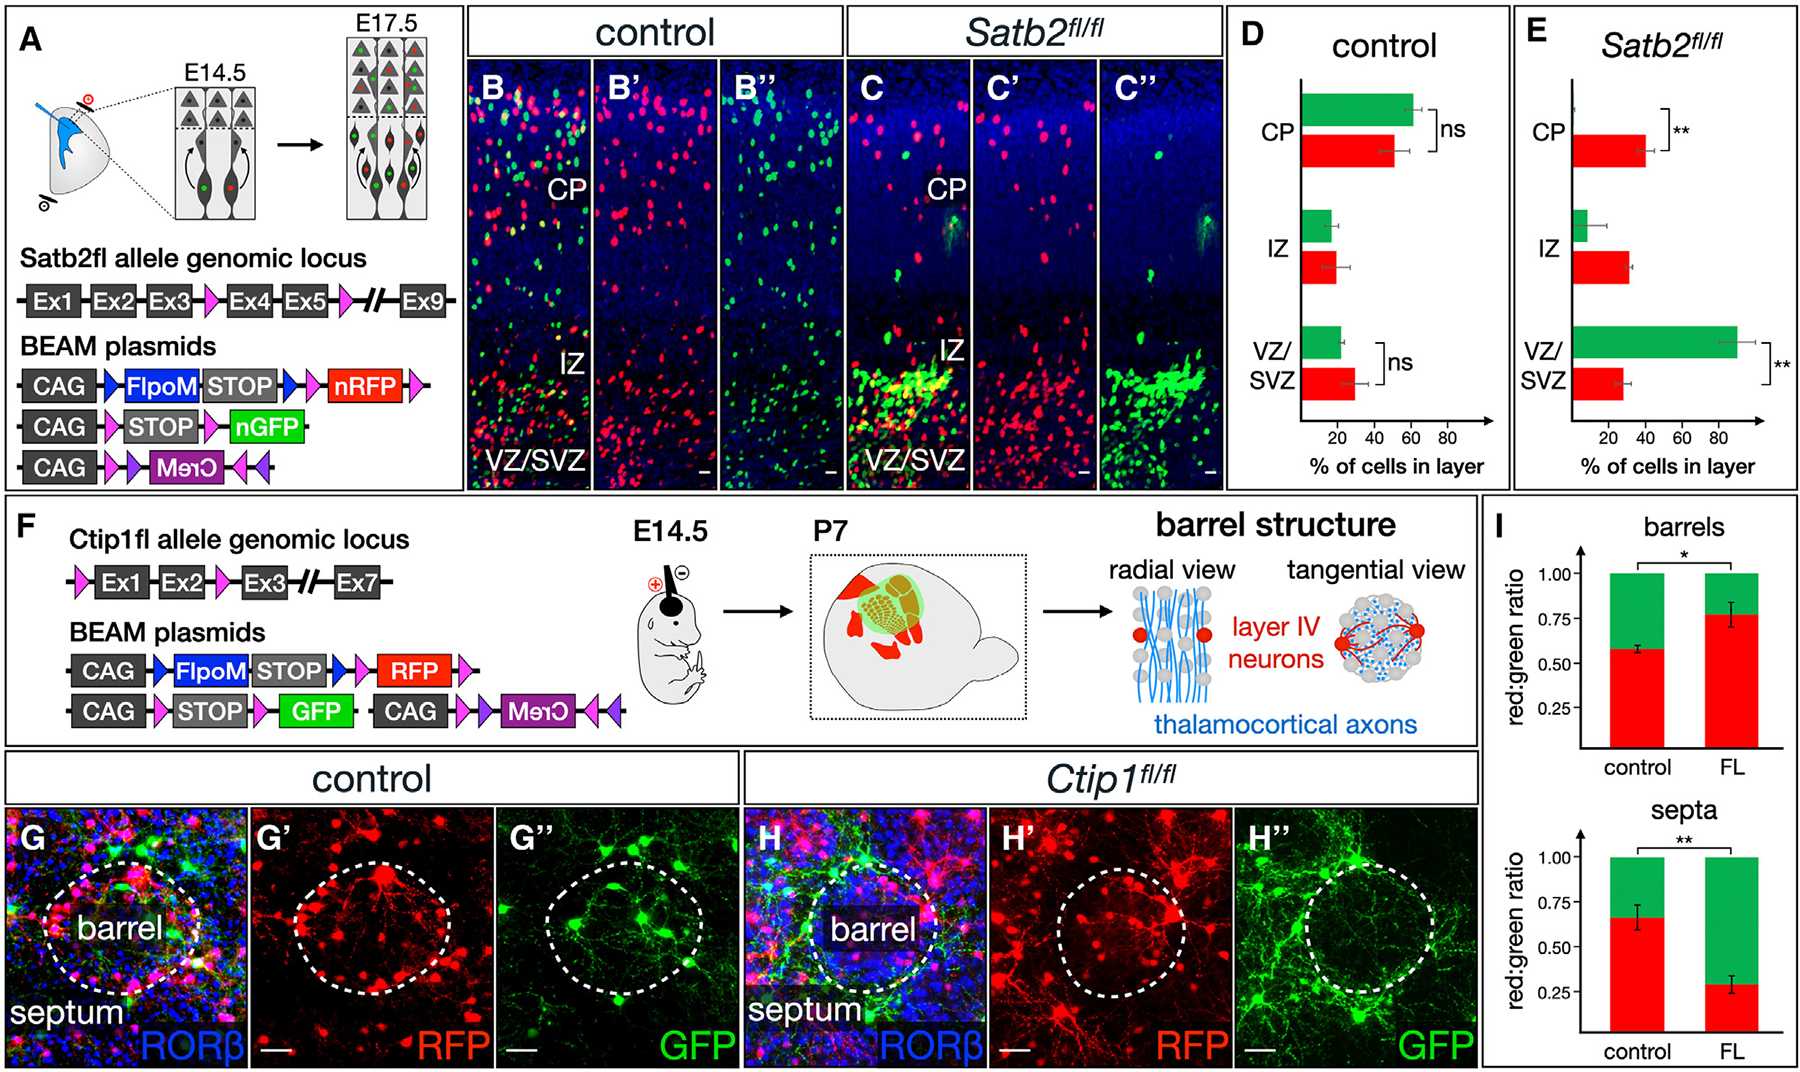
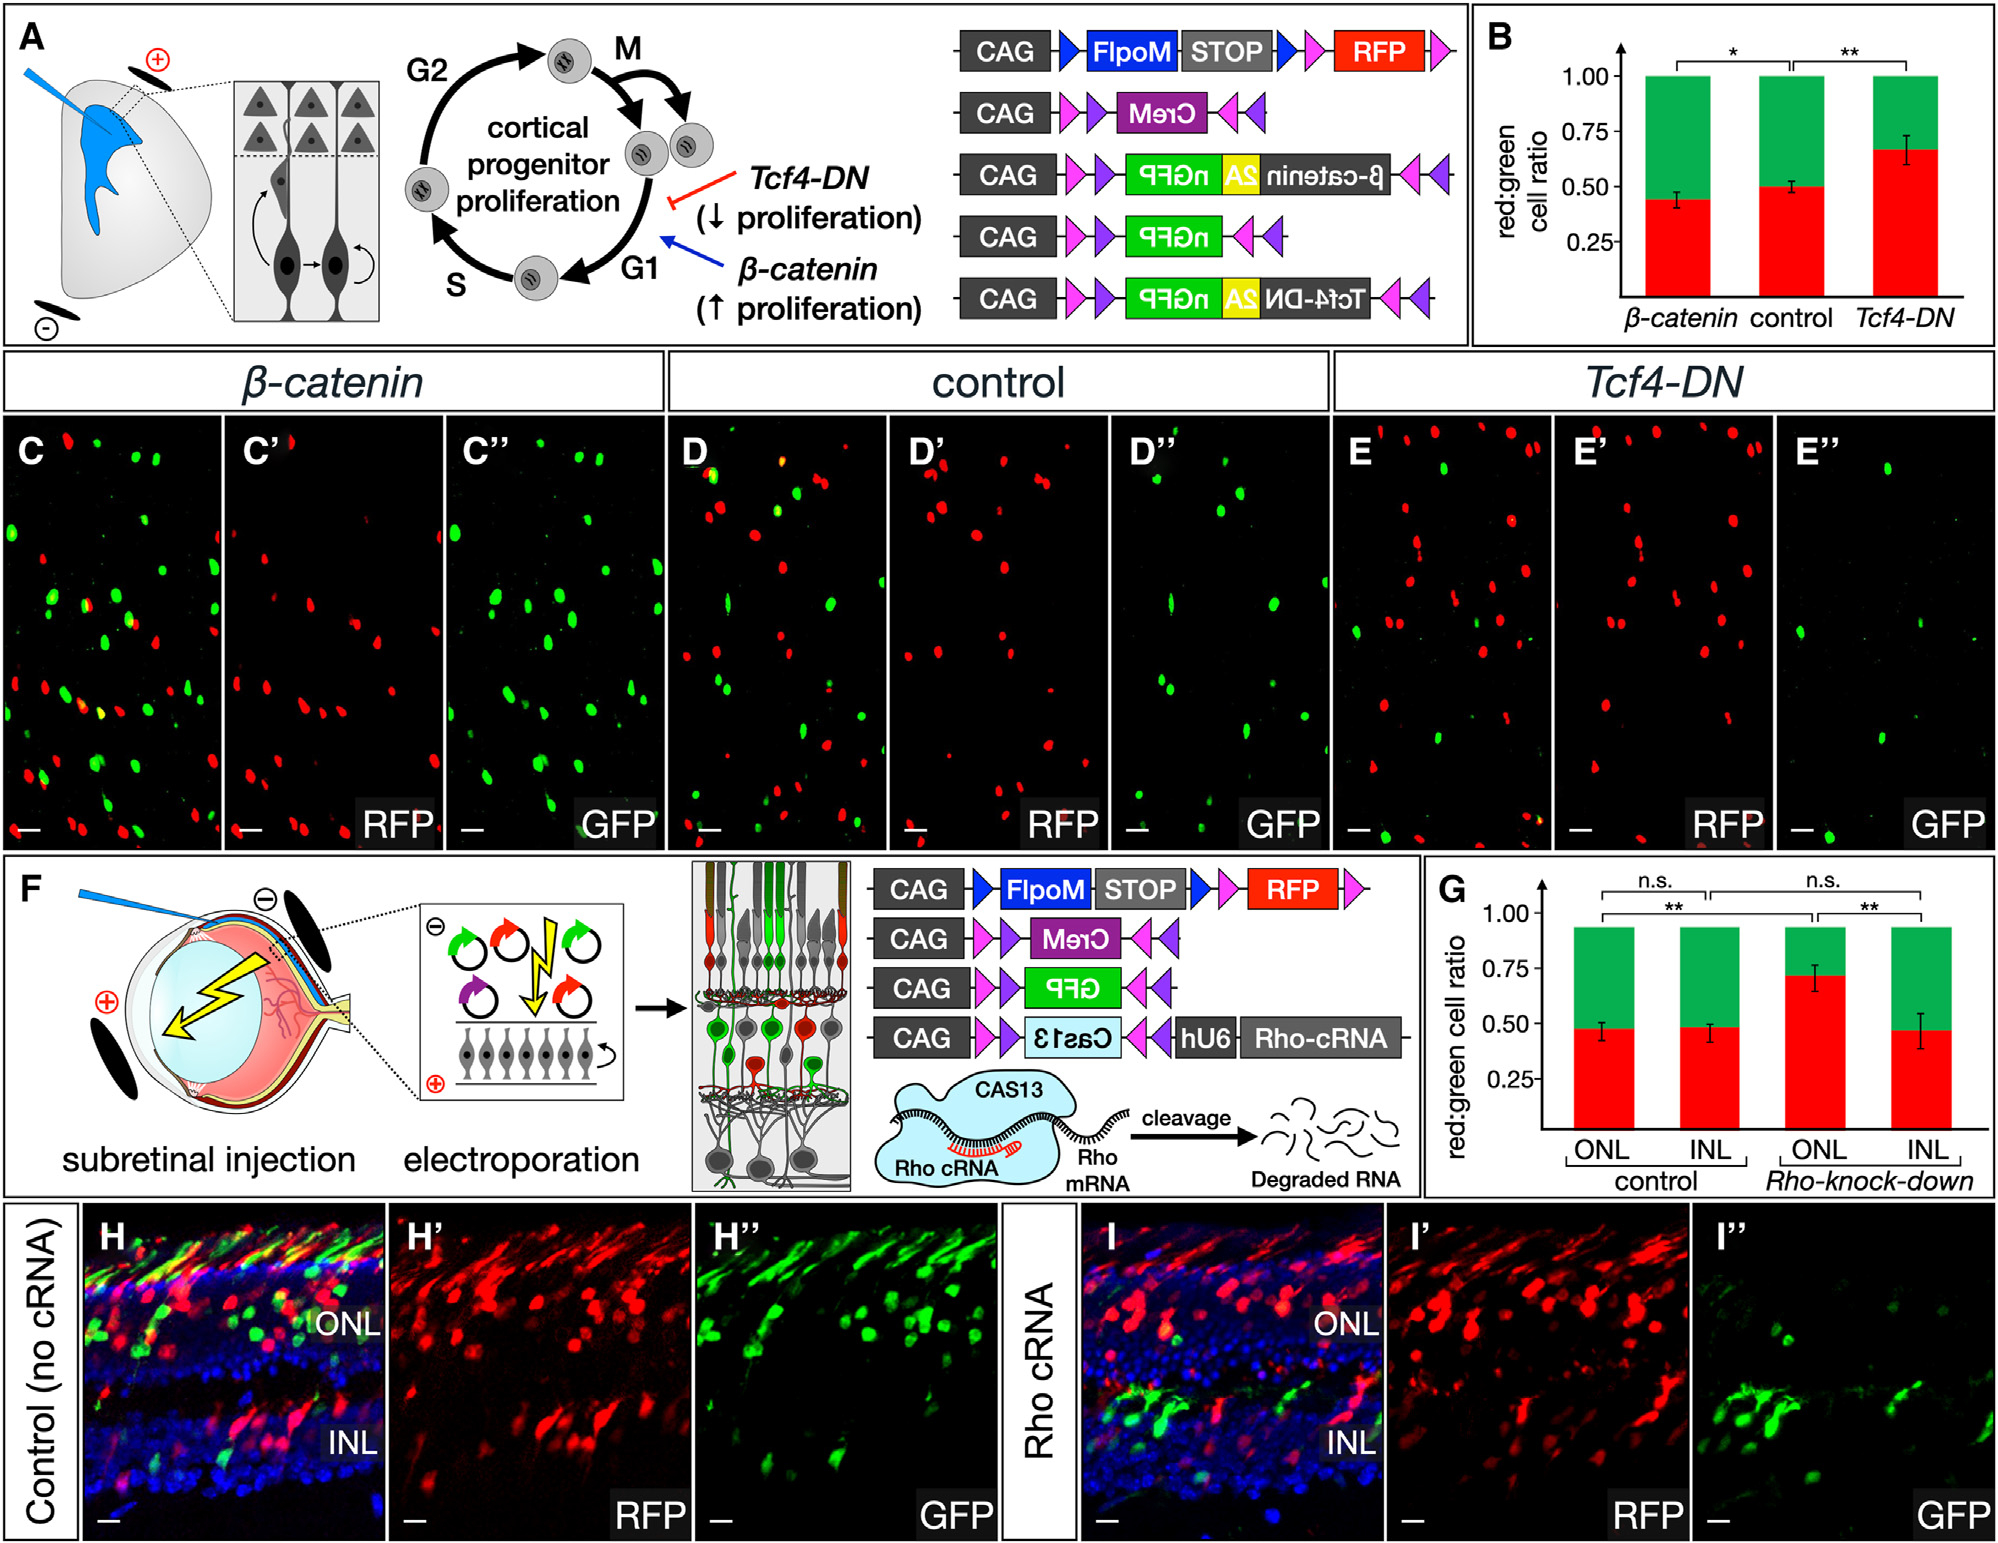
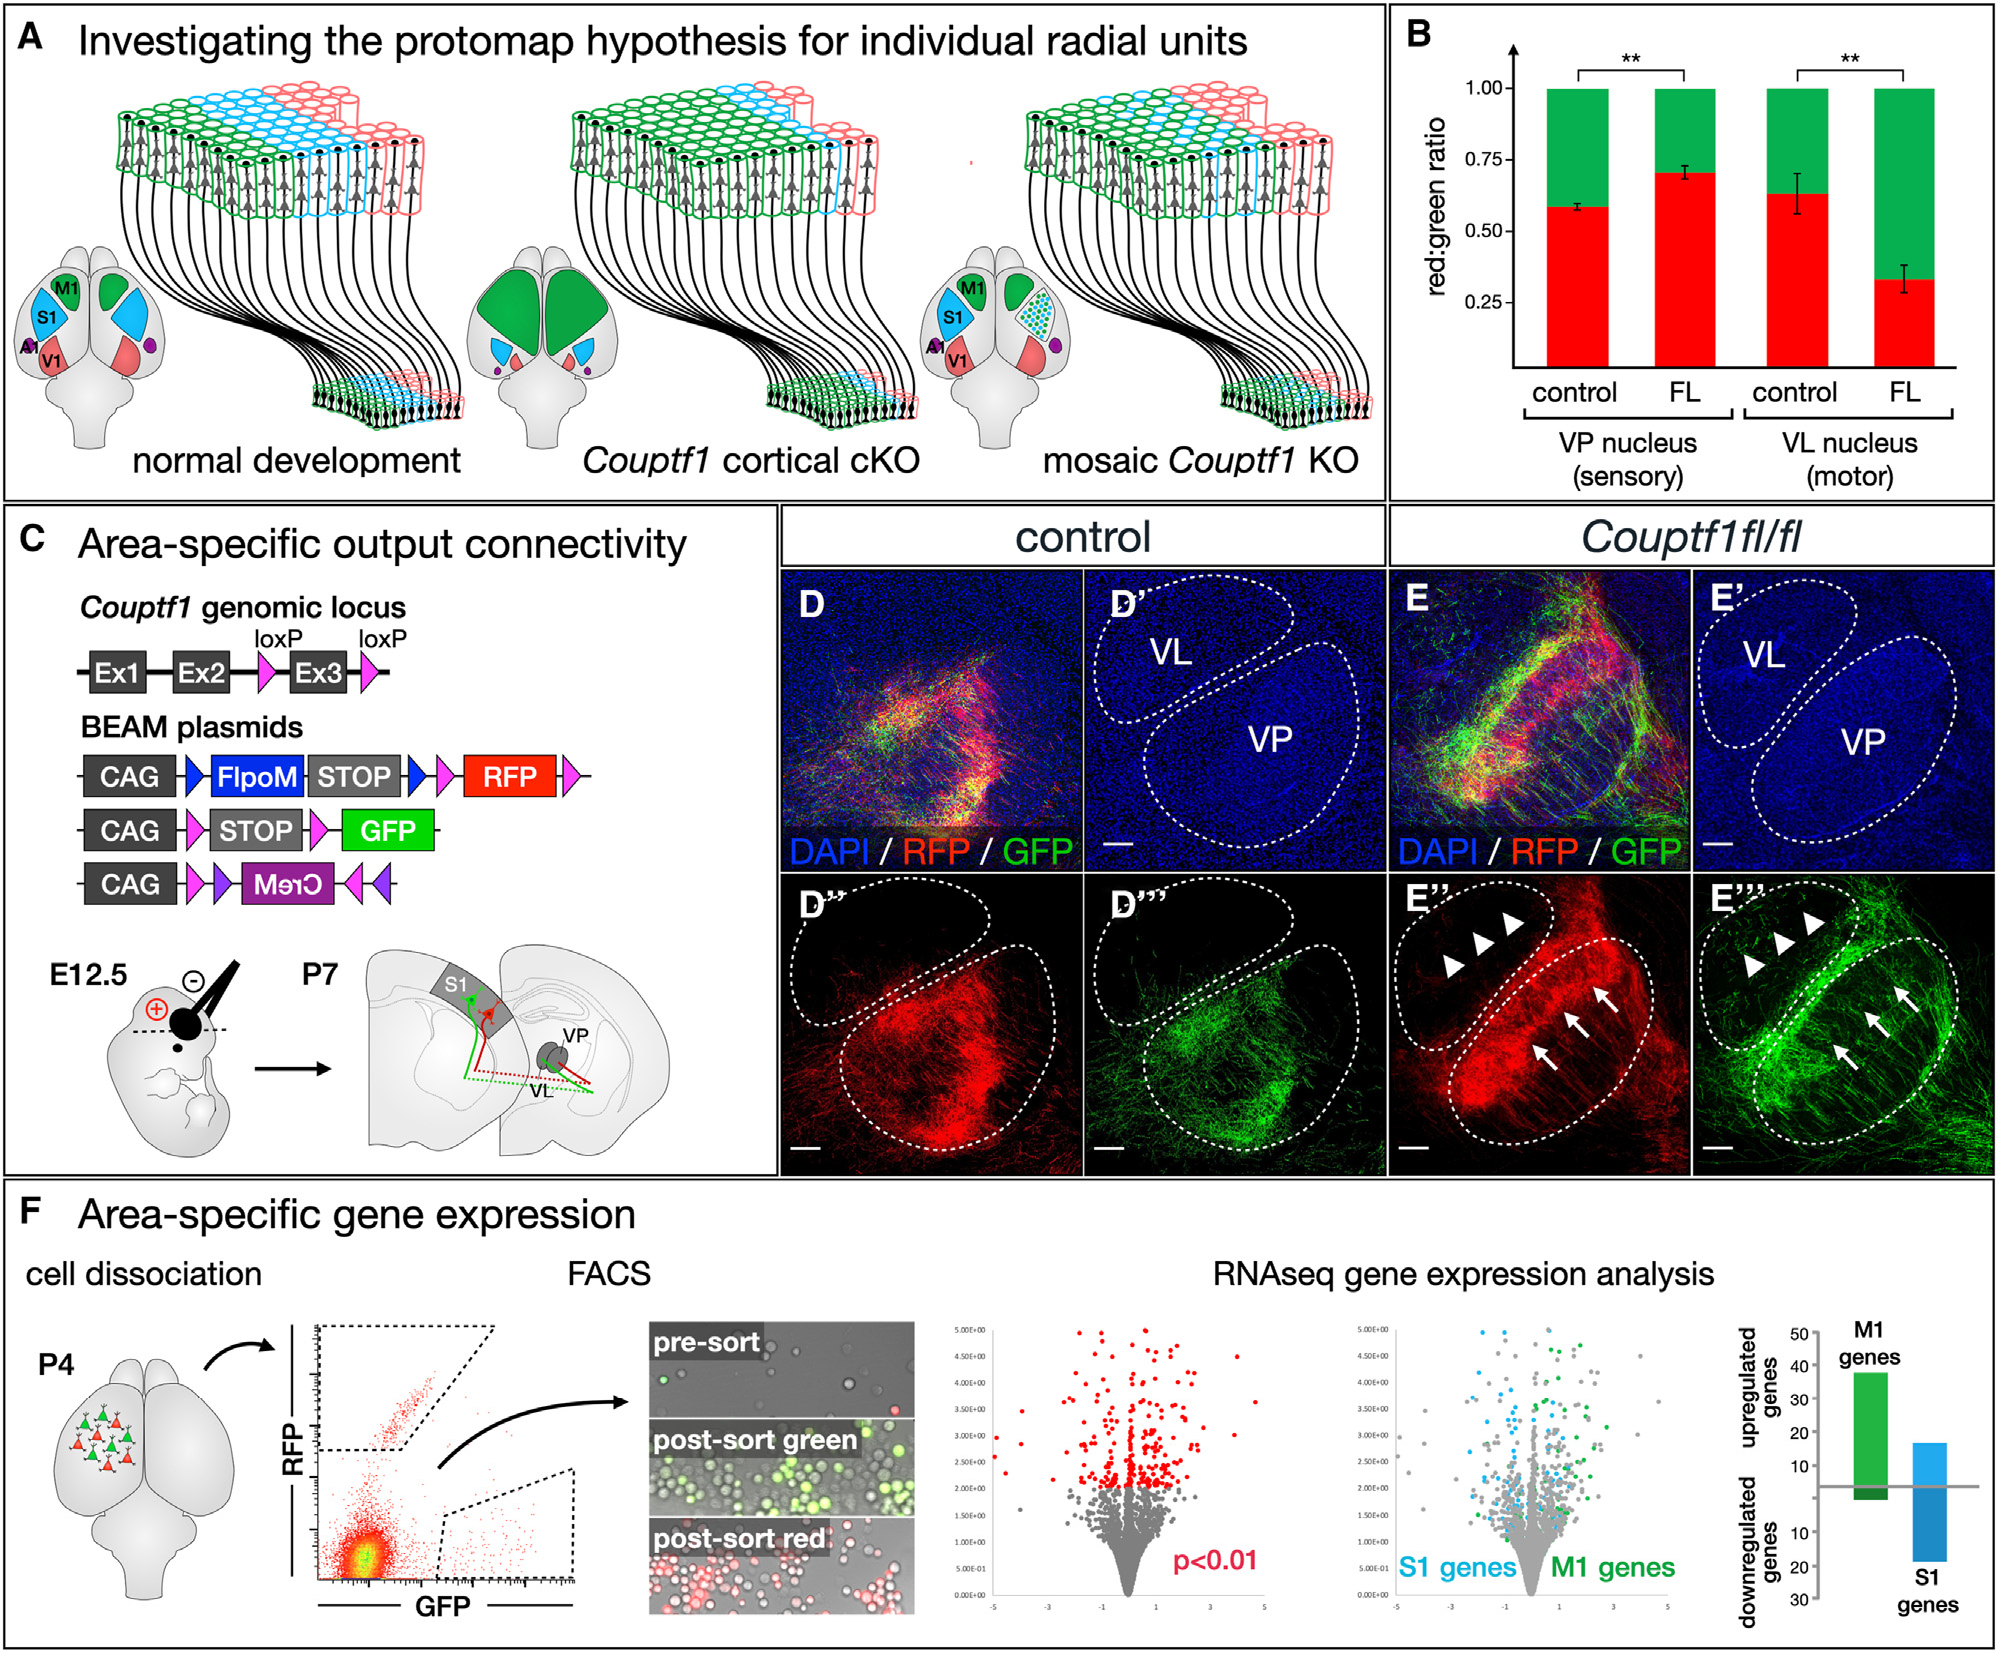
We describe a binary expression aleatory mosaic (BEAM) system, which relies on DNA delivery by transfection or viral transduction along with nested recombinase activity to generate two genetically distinct, non-overlapping populations of cells for comparative analysis. Control cells labeled with red fluorescent protein (RFP) can be directly compared with experimental cells manipulated by genetic gain or loss of function and labeled with GFP. Importantly, BEAM incorporates recombinase-dependent signal amplification and delayed reporter expression to enable sharper delineation of control and experimental cells and to improve reliability relative to existing methods. We applied BEAM to a variety of known phenotypes to illustrate its advantages for identifying temporally or spatially aberrant phenotypes, for revealing changes in cell proliferation or death, and for controlling for procedural variability. In addition, we used BEAM to test the cortical protomap hypothesis at the individual radial unit level, revealing that area identity is cell autonomously specified in adjacent radial units.

Keywords: CP: Cell biology; Cre; Flp; genetic analysis; mosaicism; recombinase.


Conflict of interest statement

Declaration of interests The authors declare no competing interests.

Figures

Figure 1.
Figure 1.. A recombinase-based strategy for binary gene expression
(A) Conceptual representation showing the frequency of plasmid copy number across a population of cells, which can be exploited to achieve binary gene expression by using sparse recombinase delivery in combination with conditional expression plasmids. (B and C) Significant overlap of RFP and GFP (arrows, right) results with both a loxP-RFP-STOP-loxP-GFP construct (B) and an RFP-FLEX(GFP) construct (C). (D and E) RFP can be directly expressed from a CAG promoter (D1) or be dependent on excision of an frt-flanked STOP cassette by FLPO, which can be expressed from a second construct, in trans (D2) or autoactivated in cis (D3). Constitutively active loxP-flanked RFP is expressed at 12 h post-transfection in 293T cells, with strong expression at 36 h (E, top). Expression can be delayed using an frt-flanked STOP cassette and FlpO expression in trans (E, middle) or in cis (E, bottom), resulting in lower expression levels at 12 h post-transfection but similar expression levels compared with direct expression at 36 h. (F and G) CRE activity can be amplified in trans by transfecting a low-dose CAG-Cre that activates multiple copies of a FLEX-CreM construct. A low dose of tamoxifen was used to induce GFP expression in 293T cells transfected with a Cre-ERT2 expression construct and a loxP-STOP-loxP-GFP reporter, resulting in low levels of GFP (G, top). Transfection with a FLEX(CreM) construct did not result in significant autoactivation (G, middle). However, in the presence of CRE-ERT2 and tamoxifen, FLEX(CreM) substantially amplified recombination, increasing GFP levels (G, bottom). All scale bars, 10 μm. See also Figure S1.
Figure 2.
Figure 2.. BEAM results in distinct expression of GFP or RFP, both in vitro by transfection of 293T cells and in vivo by electroporation of cortical progenitors
(A) Incorporating recombinase-mediated delayed expression of RFP and recombinase-driven signal amplification substantially reduces overlapping expression of GFP and RFP (arrowheads, right). Only rare CRE-positive cells maintain even low-level, residual RFP expression (arrows, right). (B) FLEX cassettes produce recombination with minimal crossover between fluorophores (arrowheads, right). (C) Combining delayed FlpO expression with Cre amplification in vivo dramatically reduces overlap between GFP- and RFP-expressing cells (right upper quadrant in plots). (D–F) In vivo labeling of cortical neurons using BEAM at E14.5 (D). Electroporated neurons express either GFP or RFP, appear phenotypically normal (E), and extend axons across the corpus callosum (F). Scale bars, 10 μm. See also Figure S2.
Figure 3.
Figure 3.. BEAM-driven expression of GFP and RFP accurately reflects genomic recombination status
(A–H) BEAM electroporation into Rosa26loxP-STOP-loxP-LacZ mice (A). Most GFP-positive neurons are also β-GAL-positive (arrowheads in C–G), while most RFP-positive neurons lack β-GAL staining (arrows in C–G). Quantification (B, n = 3). (I–K) BEAM electroporated neurons were dissociated, and single-cell sorting was performed into a 96-well plate (I). Single-cell genotyping PCR demonstrates that all RFP-positive neurons remain unrecombined. GFP-positive cells were recombined with considerably higher efficiency when FLEX(CreM) was used to amplify CRE activity (K). Quantification (J). Quantification shows mean ± SEM. Scale bars, 10 μm. See also Figure S3.
Figure 4.
Figure 4.. BEAM enables investigation of cell-autonomous gene function by conditional deletion of floxed alleles and provides a platform for rapid in vivo screening of gene function by gain- and loss-of-function approaches
(A–E) Electroporation of BEAM into Satb2fl/fl mice demonstrates abnormal axon targeting by conditional-null neurons (A). Both RFP- and GFP-positive axons are present in the corpus callosum (C and C′), but only GFP-positive axons are redirected to the thalamus (D and D′) and midbrain (E and E′). These results were consistent across multiple replicates (n = 3 control, n = 3 Satb2fl/fl). (F–I) Transcription factor network in Satb2 wild-type and conditional-null neurons (F). Immunolabeling for SATB2 demonstrates that GFP-positive neurons do not express SATB2 (arrowheads, G–G‴), while RFP-positive neurons do (arrows). Conversely, immunolabeling for CTIP2 is absent from RFP-positive neurons (arrows, H–H%‴), but is present in GFP-positive cells (arrowheads). Quantification (I, p < 0.01, n = 3 control, n = 3 Satb2fl/fl). (J–L) Overexpression of Fezf2 in callosal projection neurons using BEAM (J). CRE-positive GFP-labeled neurons ectopically express Fezf2 due to activation of the CAG-FLEX(Fezf2) construct, causing them to extend aberrant projections to the thalamus and brain stem (K′ and L′) instead of the contralateral hemisphere. Intermingled control RFP-labeled cells project exclusively across the corpus callosum (K and L). These results were consistent across multiple replicates (n =3 control, n = 3 Fezf2 overexpression). (M–O) CRISPR-Cas9 ablation of Satb2 in callosal projection neurons using BEAM (M). Although all neurons express guide RNAs targeting the Satb2 gene, Cas9 expression from a CAG-FLEX(Cas9) construct is activated by CRE exclusively in GFP-labeled cells, introducing mutations that inactivate Satb2 function and redirecting their axons from the corpus callosum to the thalamus and brain stem (N′ and O′). In the absence of Cas9 expression, intermingled control RFP-labeled neurons are unaffected by the guide RNA and project normally across the corpus callosum (N and O). These results were consistent across multiple replicates (n = 3 control, n =3 Satb2 crKO). Quantification shows mean ± SEM. Scale bars, 10 μm in (G) and (H); 100 μm in (C)–(E), (L), and (O); and 1,000 μm in (B), (K), and (N). See also Figure S4.
Figure 5.
Figure 5.. BEAM readily identifies abnormal timing of developmental processes and shifts in the spatial distribution of cells
(A–E) BEAM reveals cell autonomous migrational delay of cortical neurons in the absence of Sabt2 function (A). While both RFP-positive and GFP-positive neurons migrate into the cortex at E17.5 following E14.5 electroporation in wild-type mice (B–B″), only RFP-positive control neurons migrate successfully into the cortex in Satb2fl/fl mice (C–C″). GFP-positive mutant neurons are stalled in the ventricular/subventricular zones (VZ/SVZ) and intermediate zone (IZ) in Satb2fl/fl mice (B″). (D and E) Quantification (p < 0.01, n = 3 control, n = 3 Satb2fl/fl). (F–I) BEAM demonstrates abnormal spatial distribution of neurons lacking Ctip1 within the barrel field (F). Following electroporation at E14.5, both RFP- and GFP-labeled neurons integrate into barrels by P7 in wild-type mice, extending dendrites within the barrel to receive input from thalamocortical axons (G–G″). In Ctip1fl/fl mice, control RFP-labeled neurons adopt this normal configuration, while Ctip1-null GFP-positive neurons and their dendrites are excluded from barrels, instead taking up residence in the septa (H–H″). (I) Quantification (p < 0.05 for barrels, p < 0.01 for septa, n = 3 control, n =3 Ctip1fl/fl). Quantification shows mean ± SEM. Scale bars, 10 μm. See also Figure S5.
Figure 6.
Figure 6.. BEAM enables unequivocal investigation of changes in mitotic activity and cell survival
(A–E) Manipulation of cortical progenitor cell-cycle dynamics was carried out using BEAM and overexpression of either β-catenin or Tcf-DN (A). The relative ratios of control RFP- and genetically manipulated GFP-labeled cells after electroporation at E12.5 and analysis at E17.5 were quantified (B, p < 0.05 for β-catenin, p < 0.01 for Tcf4-DN, n = 3 control, n =3 β-catenin, n =3 TCF4-DN). Compared with control experiments (D–D″), β-catenin overexpression increases the relative number of GFP-labeled cells (C–C″), while a dominant-negative Tcf4 mutant decreases the relative number of GFP-labeled cells (E–E″). (F–I) BEAM reveals selective cell death due to photoreceptor degeneration (F). Approximately equal numbers of RFP- and GFP-positive cells are present in control retinas in both the INL and the ONL. CAS13-mediated knockdown of Rho does not affect survival of cells in the INL; however, there is a striking decrease in GFP-positive cells in the ONL. Note also the complete absence of GFP-positive outer segments in Rho knockdown (I″), while there is robust GFP labeling of outer segments in control experiments (H″). Quantification (G, p < 0.01, n = 3 control, n =3 b-Rho knockdown). Quantification shows mean ± SEM. Scale bars, 10 μm. See also Figure S6.
Figure 7.
Figure 7.. Investigating the protomap hypothesis at the level of individual radial units reveals that area identity is independently specified in each progenitor cell and its progeny
(A) The protomap hypothesis proposes that individual cortical progenitors acquire specific area identities and transfer this information to post-mitotic neurons generated by each radial unit. Cortex-wide loss of transcription factors that specify area identity leads to relative changes in the size and position of cortical areas. It is not well understood whether area specification occurs independently within each radial unit or whether there are mechanisms driving interdependent area specification of adjacent radial units. (B–E) Each cortical area establishes axonal projections to specific thalamic nuclei, and this area-specific connectivity can be experimentally interrogated by electroporation of corticothalamic neurons at E12.5 (C). In control brains, both RFP- and GFP-labeled axons originating from somatosensory radial units project primarily to the ventral posterior (VP) sensory nucleus (D” and D‴). In Couptf1fl/fl brains, RFP-labeled axons from unrecombined radial units similarly arborize within the VP (E″, arrows), but GFP-labeled axons originating from intermingled Couptf1-null radial units avoid arborizing within the VP (E‴, arrows), instead entering and arborizing within the ventral lateral (VL) motor nucleus (E‴, arrowheads). Quantification (B, p < 0.01, n = 3 control, n = 3 Couptf1fl/fl). (F) Couptf1fl/fl brains were electroporated at E12.5, then cortical tissue was collected from the somatosensory cortex at P4 and dissociated. Control RFP-labeled cells and conditional-null GFP-labeled cells were purified by FACS, and gene expression was analyzed by RNA-seq. Among differentially expressed genes, motor-specific genes were upregulated, while sensory-specific genes were downregulated. Quantification shows mean ± SEM. Scale bars, 100 μm. See also Figure S7 and Data S1.

Update of

Similar articles

Cited by

References

    1. Adams D, Baldock R, Bhattacharya S, Copp AJ, Dickinson M, Greene NDE, Henkelman M, Justice M, Mohun T, Murray SA, et al. (2013). Bloomsbury report on mouse embryo phenotyping: recommendations from the impc workshop on embryonic lethal screening. Dis. Model. Mech. 6, 571–579. - PMC - PubMed
    1. Han KA, Woo D, Kim S, Choii G, Jeon S, Won SY, Kim HM, Heo WD, Um JW, and Ko J (2016). Neurotrophin-3 regulates synapse development by modulating trkc-ptps synaptic adhesion and intracellular signaling pathways. J. Neurosci. 36, 4816–4831. - PMC - PubMed
    1. Villalba A, Amberg N, and Hippenmeyer S (2023). Interplay of cell-autonomous gene function and tissue-wide mechanisms regulating radial glial progenitor lineage progression. Neocortical Neurogenesis in Development and Evolution, 169–191. 10.1002/9781119860914. - DOI
    1. Zong H, Espinosa JS, Su HH, Muzumdar MD, and Luo L (2005). Mosaic analysis with double markers in mice. Cell 121, 479–492. - PubMed
    1. Contreras X, Amberg N, Davaatseren A, Hansen AH, Sonntag J, Andersen L, Bernthaler T, Streicher C, Heger A, Johnson RL, et al. (2021). A genome-wide library of madm mice for single-cell genetic mosaic analysis. Cell Rep. 35, 109274. - PMC - PubMed