. 2024 Aug 19:13:RP94109.
doi: 10.7554/eLife.94109.

Multiple guidance mechanisms control axon growth to generate precise T-shaped bifurcation during dorsal funiculus development in the spinal cord

Affiliations

Multiple guidance mechanisms control axon growth to generate precise T-shaped bifurcation during dorsal funiculus development in the spinal cord

Bridget M Curran et al. Elife. .

Abstract

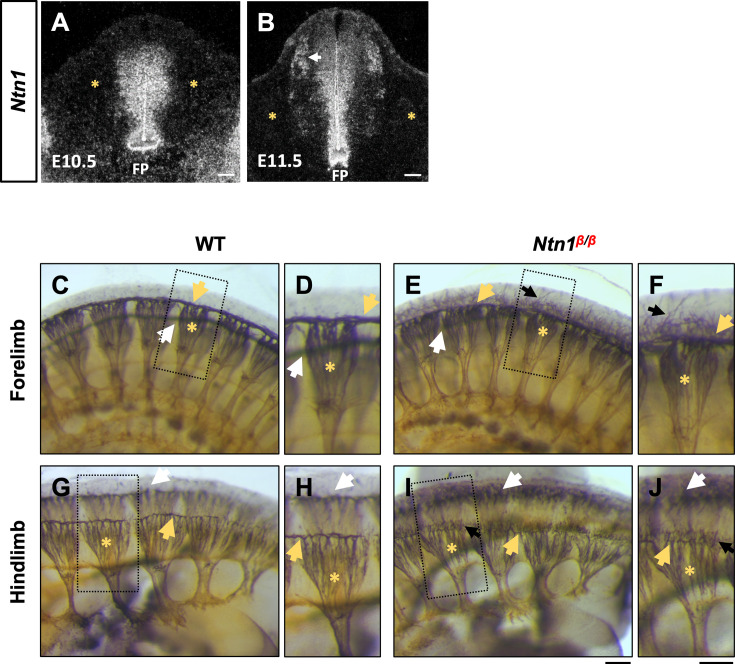
The dorsal funiculus in the spinal cord relays somatosensory information to the brain. It is made of T-shaped bifurcation of dorsal root ganglion (DRG) sensory axons. Our previous study has shown that Slit signaling is required for proper guidance during bifurcation, but loss of Slit does not affect all DRG axons. Here, we examined the role of the extracellular molecule Netrin-1 (Ntn1). Using wholemount staining with tissue clearing, we showed that mice lacking Ntn1 had axons escaping from the dorsal funiculus at the time of bifurcation. Genetic labeling confirmed that these misprojecting axons come from DRG neurons. Single axon analysis showed that loss of Ntn1 did not affect bifurcation but rather altered turning angles. To distinguish their guidance functions, we examined mice with triple deletion of Ntn1, Slit1, and Slit2 and found a completely disorganized dorsal funiculus. Comparing mice with different genotypes using immunolabeling and single axon tracing revealed additive guidance errors, demonstrating the independent roles of Ntn1 and Slit. Moreover, the same defects were observed in embryos lacking their cognate receptors. These in vivo studies thus demonstrate the presence of multi-factorial guidance mechanisms that ensure proper formation of a common branched axonal structure during spinal cord development.

Keywords: axon bifurcation; developmental biology; dorsal funiculus; mouse; neuroscience; spinal cord.


Conflict of interest statement

BC, KN, AY, LG, AJ, MT, LM No competing interests declared

Figures

Figure 1.
Figure 1.. NF immunostaining reveals DRG axon misprojections in Ntn1β/β mutants in cleared wholemount embryos and transverse sections.
(A–D) Inverted fluorescent images of wholemount NF staining of CUBIC-cleared E10.5 WT (A, C) or Ntn1β/β (B, D) embryos. The projected images are viewed from the lateral side of the body at the region of forelimb (A–B) and hindlimb (C–D). The space above the dorsal funiculus (dotted-line box) is devoid of NF-fibers in WT embryos (A, C), but filled with misprojecting axons (arrows) from DRGs (*) that grow dorsally in the mutant (B,D). The compass indicates the dorsal (D)-ventral (V) axis and the rostral (R)-caudal (C) axis. (E) A model depicting DRG sensory axon projections in the spinal cord. Bifurcation is shown in the DREZ (green area) that forms the eventual dorsal funiculus. (F) Quantification of the number of axonal fibers at the proximal, medial, or distal location from the dorsal funiculus (see purple lines in B and D) in the wholemount staining of WT and Ntn1β/β (Nβ/β) embryos (n=3 animals per condition). Two-way ANOVA F(1, 12)=199.5 with Tukey’s HSD Test with multiple comparisons t between WT and Ntn1β/β i(proximal p<0.0001; medial p<0.0001; and distal, p=0.001). (G–N) Inverted fluorescent images of NF-stained transverse sections of the brachial region of E10.5 (G–H, K–L) and E11.5 (I–J, M–N) embryos. Misprojections (arrows) extending from the DREZ (green box) are seen in Ntn1β/β (K–N) but not WT (G–J) animals. Asterisks (*) label the DRG. Images in H, J, L, N are zoomed-in views of the boxed regions around the DREZ in G, I, K, M, respectively. The compass indicates the dorsal (D)-ventral (V) axis and the left (L)-right (R) axis. *** p<0.001, **** p<0.0001. Bars: 100 μm.
Figure 1—figure supplement 1.
Figure 1—figure supplement 1.. Ntn1 expression in mouse embryonic spinal cords and additional wholemount staining in E10.5 embryos.
(A–B) Dark field images of in situ hybridization using 35S-labeled mRNA probes for Ntn1 in cross sections of E10.5 and E11.5 mouse embryos. Ntn1 expression is mainly confined to the inside of the spinal cord, including the floor plate (FP), the ventricular zone, and the lateral domain in the dorsal horn adjacent to the DREZ (arrow). Asterisks (*) label the DRG. (C–J) Whole mount NF staining using HRP-based colorimetric substrates in E10.5 WT (C–D,G–H) or Ntn1β/β (E–F, I–J) embryos (n=5). BA/BB-cleared embryos are viewed from the lateral side of the forelimb (C–F) or hindlimb (G–J) region. Asterisks (*) label the DRG, arrows point to the front (yellow) or the back (white) dorsal funiculus, and misprojections (black). Images in D,F,H,J show enlarged views of the boxed region of a single DRG in C,E,G,I. Bars: 100 μm.
Figure 2.
Figure 2.. Genetic labeling of DRG neurons confirms the origin of misprojections and reveals guidance defects during bifurcation in Ntn1β/β mutants.
(A–C) Sensory axon specific genetic labeling based on tdTomato expression driven by tamoxifen-induced Neurog1:CreERT2 in E10.5 WT (A) or Ntn1β/β (B) embryos that were cleared by iDISCO. Fluorescent images of immunostaining using RFP antibodies (for tdTomato) (A–C) or 2H3 antibodies (for NF) (A’-C’) are taken from the lateral side of the spinal cord in the brachial region of cleared wholemount embryos. Color-merged images are shown in A”-C”. Dorsal funiculi are inside the yellow dotted-line boxes and DRGs are marked by asterisks (*). Zoomed-in images (C) from the boxed regions in B (white box) highlights the co-staining of DRG-specific tdTomato and NF in abnormal fibers (yellow arrows) that extend from the dorsal funiculus in Ntn1β/β mutants (n=3). White arrows indicate NF-labeled misprojections that do not co-stain for tdTomato. (D–H) Sparse sensory axon labeling in WT or Ntn1β/β animals based on the basal tdTomato fluorescence driven by Neurog1-CreERT2 without using tamoxifen. Inverted fluorescent images (D,E,G,H) are viewed along the DREZ from the lateral side of the spinal cord in cleared wholemount embryos. The merged fluorescent image of tdTomato and NF labeling shows the DREZ (dotted-line box) in F. Normal turning is found in WT animals (n=3) for bifurcated (D, n=11/12 axons) and non-bifurcated axons (E, n=14/14 axons). In Ntn1β/β mutant embryos (n=3), tdTomato labeled axons (purple arrows) can be seen misprojecting from the DREZ in bifurcated (G,H, n=7/14 axons) and non-bifurcated axons (H, n=9/13 axons). Green ‘V’ indicates the location of bifurcation junctions or the turning point of single axons. (I) Quantification of the defects in sparsely labeled axons above. The percentage of fibers that correctly (black bar) or incorrectly (grey bar) turn at the DREZ is quantified in two groups: bifurcated (+) or non-bifurcated (-). Student’s t-tests compare the mean value of percentage of fibers misprojecting between WT and Ntn1β/β (Nβ/β) in non-bifurcated axons (t(4)=25, p<0.0001) and bifurcated axons (t(4)=4.533, p=0.0106). * p<0.05, and **** p<0.0001, Bars: 100 μm.
Figure 3.
Figure 3.. Wholemount NF immunostaining reveals the loss of the dorsal funiculus in Slit1-/-;Slit2-/-;Ntn1β/β triple mutants with distinct misprojections.
(A–B) Inverted fluorescent images of NF staining in CUBIC-cleared E10.5 embryos in the forelimb region. The dorsal funiculus (between dotted-lines) is evident in the control Slit1-/-;Slit2+/+;Ntn1+/+ embryo and the space above it has few labeled fibers (arrows, A), but in the Slit1-/-;Slit2-/-; Ntn1β/β mutant (B), extensive NF-labeled axons (arrows) wander into the dorsomedial region of the spinal cord while the dorsal funiculus (between dotted-lines) is reduced and diminished. DRGs are marked by green asterisks (*). (C–N) Inverted fluorescent images of NF staining in wholemount embryos of E10.5 embryos with various genotypes are viewed from the lateral side (D–G) or the dorsal surface (J–M). Arrows denote sensory misprojections found in Slit1-/-;Slit2+/+;Ntn1+/+ (D, J), Slit1-/-;Slit2-/-;Ntn1+/+ (E, K), Slit1-/-;Slit2+/+; Ntn1β/β (F, L) and Slit1-/-;Slit2-/-;Ntn1β/β (G, M) animals. In Slit1-/-;Slit2-/-;Ntn1β/β triple mutants (G, M), the dorsal funiculus is nearly absent with misprojecting fibers. The number of axonal fibers at proximal, medial, and distal locations between the DREZ and the dorsal midline is quantified in the bar graphs from the lateral (H) or the top-down (N) view (n=3 for each data set). The orientation and measurement location are shown in the corresponding cartoons (C and I) and DRGs are marked by green asterisks (*). Statistics from two-way ANOVA analysis and pairwise comparions in H: for proximal misprojections, Slit1-/- vs. Slit1-/-;Slit2-/- p=0.0122; Slit1-/- vs. Ntn1β/β p=0.0011; Slit1-/- vs. Slit1-/-;Slit2-/-;Ntn1β/β p<0.001; for medial misprojections, Slit1-/-vs. Ntn1β/β p=0.0122; Slit1-/- vs. Slit1-/-;Slit2-/-;Ntn1β/β p<0.0001; and for distal misprojections, Slit1-/- vs. Slit1-/-;Slit2-/-;Ntn1β/β p<0.0001. Statistics from two-way ANOVA analysis in I: for proximal misprojections, Slit1-/- vs. Slit1-/-;Slit2-/- p=0.0388; Slit1-/-vs. Ntn1β/β p=0.0002; Slit1-/- vs. Slit1-/-;Slit2-/-;Ntn1β/β p<0.0002; for medial misprojections, Slit1-/-vs. Ntn1β/β p=0.0388; Slit1-/- vs. Slit1-/-;Slit2-/-;Ntn1β/β p<0.0001; and for distal misprojections, Slit1-/- vs. Ntn1β/β p=0.0175; Slit1-/- vs. Slit1-/-;Slit2-/-;Ntn1β/β p=0.0004. (O–T) Inverted fluorescent images of NF staining in cross sections of E10.5 embryos with various genotypes (P-S, n=3). Orange arrows indicate axonal misprojections found in Slit1-/-;Slit2-/- mutants inside the spinal cord and blue arrows indicate misprojections associated with Ntn1β/β mutants at the pial surface. Blue lines with arrow at both ends indicate the distance from dorsal projections to the midline. Quantification of defects (T) is based on the distance of the dorsal fibers from the midline (blue bars) and the total length of misprojection fibers inside the spinal cord (orange bars). The cartoon (O) illustrates the two types of misprojections (brown lines) and the quantification of dorsal distance (blue lines). Statistics from one-way ANOVA analysis in T: for dorsal fiber distance, WT vs. Slit1-/-;Slit2-/- p=0.0003; WT vs. Ntn1β/β p<0.0001; WT vs. Slit1-/-;Slit2-/-;Ntn1β/β p<0.0001; and for horizontal fiber length, WT vs. Slit1-/-;Slit2-/- p=0.0016; WT vs. Ntn1β/β p=0.0472; WT vs. Slit1-/-;Slit2-/-;Ntn1β/β p=0.007. * p<0.05, ** p<0.01, *** p<0.001 and **** p<0.0001, ns, not significant. Bars: 100 μm.
Figure 3—figure supplement 1.
Figure 3—figure supplement 1.. Traditional wholemount NF immunostaining reveals the loss of the dorsal funiculus in Slit1-/-;Slit2-/-;Ntn1β/β triple mutants.
(A–B) HRP-based neurofilament staining is viewed from the dorsolateral side of E10.5 embryos in the forelimb (A–B) or the hindlimb (C–D) region. Note the difference in labeled axons at the front (yellow arrowheads) or the back (white arrowheads) dorsal funiculi after they grow out from the DRG (*) between Slit1-/-;Slit2-/-;Ntn1β/β mutants (B,D) and littermate controls (A,C) (n=2).
Figure 4.
Figure 4.. Single axon DiI labeling of DRG central afferents shows altered turning of bifurcated axons in various Slit and Ntn1 mutants.
(A–C) Single cell DiI labeling of DRG axons in open book preparations (A) of spinal cords isolated from E12.5 WT (B) and Slit1-/-;Slit2-/-;Ntn1β/β (C) animals. Maximum z-projection are depth color coded (~45 μm represented by the color bar) with multiple bifurcating axons visible in the field of view. Arrows point to misprojecting fibers and green “V” indicates the location of bifurcation junctions. (D–G) Skeletonized tracings of DiI labeled axons from embryos with various genotypes. WT axons show stereotyped T-bifurcation along the DREZ (D, n=4 animals). Axons in Slit1-/-;Slit2-/- mutants overshoot the DREZ (E, n=3 animals). In Ntn1β/β mutant embryos, axons stray from the DREZ and have disrupted turns along the DREZ (F, n=5 animals). Axons in Slit1-/-;Slit2-/-;Ntn1β/β triple mutants are completely disorganized around the DREZ (G, n=2 animals). Dashed lines in D show the angle (θ) measurement. (H–J) Quantification of the turning angle of bifurcated branches along the DREZ (H) from single axon labeling above showed the mean raw angles are similar for all genotypes (one way ANOVA F(3,114)=0.8229, p=n .s.). However, the deviation of raw angles from the average was significantly different among different genotypes (I). One way ANOVA with Tukey’s Post-hoc for multiple comparisons ([F(3,114)=15.97, p<0.0001]): WT and Slit1-/-;Slit2-/-;Ntn1β/β, p<0.0001; Slit1-/-;Slit2-/-and Slit1-/-;Slit2-/-;Ntn1β/β, p=0.0001; and Ntn1β/β and Slit1-/-;Slit2-/-;Ntn1β/β, p<0.0001. Additionally, the angle difference between the two branches showed significantly difference among genotypes (J). One way ANOVA with Tukey’s Post-hoc for multiple comparisons ([F(3,114)=12.99, p<0.0001]): WT and Slit1-/-;Slit2-/-;Ntn1β/β, p<0.0001; Slit1-/-;Slit2-/-and Slit1-/-;Slit2-/-;Ntn1β/β, p=0.0004; and Ntn1β/β and Slit1-/-;Slit2-/-;Ntn1β/β, p=0.0001. Only the comparison between the triple mutants and other genotypes are shown here. *** p<0.001, **** p<0.0001, ns: not significant. Bars: 100 μm.
Figure 5.
Figure 5.. NF immunostaining reveals the loss of the dorsal funiculus in Robo1--/--;Robo2--/--;Dcc-/- triple mutants.
(A–D) Inverted fluorescent images of NF staining in CUBIC-cleared E10.5 embryos viewed from the lateral side in the forelimb region. WT (A, n=3) have relatively few axons straying from the dorsal funiculus (boxed region). Purple arrows denote sensory misprojections found in Robo1-/-;Robo2-/--;Dcc+/+ embryos (C, n=2) or DCC-/- (B, n=6). In Robo1-/-;Robo2-/-;Dcc-/- mutants (D, n=3), the dorsal funiculus is completely lost and disorganized with axons wandering into the dorsomedial region of the spinal cord. (E–H) Inverted fluorescent images of NF staining in the cross section of E11.5 embryos with various genotypes. Orange arrows indicate horizontal misprojections inside the spinal cord found in Robo1-/-;Robo2-/- mutants and blue arrows indicate dorsal misprojections along the pial surface associated with Dcc-/- mutants. Lines with arrow at both ends (blue) indicate the distance between dorsal misprojections to the midline. (I–J) Quantification of dorsal and horizontal misprojections based on the distance from the roof plate to the DREZ (I, blue bars, n=3, except n=4 for WT) and the total length of horizontal fibers (J, orange bars, n=3). Statistics from one-way ANOVA analysis: for dorsal fiber distance in I, WT vs. R1-/-;R2-/- p=0.0008; WT vs. DCC-/- p=0.0001; WT vs. R1-/-;R2-/-; DCC-/- p<0.0001; for dorsal fiber length in J, WT vs. R1-/-;R2-/- p=0.0010; WT vs. DCC-/- p=0.0054; WT vs. R1-/-;R2-/-; DCC-/- p<0.0001. ** p<0.01; *** p<0.001; **** p<0.0001, ns: not significant. Bars: 100 μm.
Figure 5—figure supplement 1.
Figure 5—figure supplement 1.. Dcc expression in mouse embryonic spinal cords.
Dark field images of in situ hybridization using 35S-labeled mRNA probes in cross sections (16 μm) of mouse spinal cords from E10.5 and E11.5 embryos. Dcc is expressed mainly inside the spinal cord and weakly in the DRG (*). FP: floor plate.
Figure 6.
Figure 6.. Cartoon illustration of the different guidance roles of Slit and Ntn1 during bifurcation.
A working model for the role of Slit and Ntn1 in regulating branch guidance at two different steps during bifurcation. The primary axon of the central projection from DRG neurons first extends toward the dorsal spinal cord. After reaching the DREZ, the axon is turned by Slit into the rostrocaudal direction. After forming the second branch stimulated by CNP, the two bifurcated axons continue to grow along the DREZ with their trajectories regulated by a Ntn1-dependent guidance mechanism.

Update of

References

    1. Altman J, Bayer SA. The development of the rat spinal cord. Advances in Anatomy, Embryology, and Cell Biology. 1984;85:1–164. doi: 10.1007/978-3-642-69537-7. - DOI - PubMed
    1. Armijo-Weingart L, Gallo G. It takes a village to raise a branch: Cellular mechanisms of the initiation of axon collateral branches. Molecular and Cellular Neurosciences. 2017;84:36–47. doi: 10.1016/j.mcn.2017.03.007. - DOI - PMC - PubMed
    1. Bin JM, Han D, Lai Wing Sun K, Croteau L-P, Dumontier E, Cloutier J-F, Kania A, Kennedy TE. Complete loss of netrin-1 results in embryonic lethality and severe axon guidance defects without increased neural cell death. Cell Reports. 2015;12:1099–1106. doi: 10.1016/j.celrep.2015.07.028. - DOI - PubMed
    1. Chédotal A. Roles of axon guidance molecules in neuronal wiring in the developing spinal cord. Nature Reviews. Neuroscience. 2019;20:380–396. doi: 10.1038/s41583-019-0168-7. - DOI - PubMed
    1. Ding YQ, Kim JY, Xu YS, Rao Y, Chen ZF. Ventral migration of early-born neurons requires Dcc and is essential for the projections of primary afferents in the spinal cord. Development. 2005;132:2047–2056. doi: 10.1242/dev.01798. - DOI - PMC - PubMed

MeSH terms

LinkOut - more resources