. 2024 Oct;11(40):e2405949.
doi: 10.1002/advs.202405949. Epub 2024 Aug 19.

Predicting Antigen-Specificities of Orphan T Cell Receptors from Cancer Patients with TCRpcDist

Affiliations

Predicting Antigen-Specificities of Orphan T Cell Receptors from Cancer Patients with TCRpcDist

Marta A S Perez et al. Adv Sci (Weinh). 2024 Oct.

Abstract

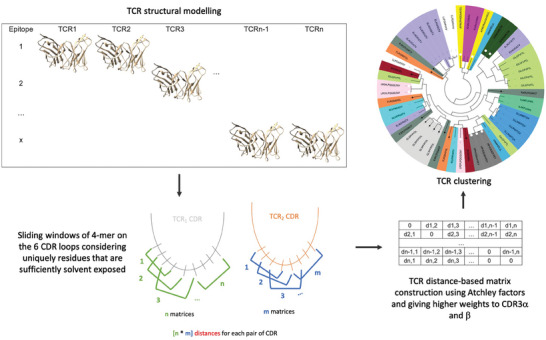
Approaches to analyze and cluster T-cell receptor (TCR) repertoires to reflect antigen specificity are critical for the diagnosis and prognosis of immune-related diseases and the development of personalized therapies. Sequence-based approaches showed success but remain restrictive, especially when the amount of experimental data used for the training is scarce. Structure-based approaches which represent powerful alternatives, notably to optimize TCRs affinity toward specific epitopes, show limitations for large-scale predictions. To handle these challenges, TCRpcDist is presented, a 3D-based approach that calculates similarities between TCRs using a metric related to the physico-chemical properties of the loop residues predicted to interact with the epitope. By exploiting private and public datasets and comparing TCRpcDist with competing approaches, it is demonstrated that TCRpcDist can accurately identify groups of TCRs that are likely to bind the same epitopes. Importantly, the ability of TCRpcDist is experimentally validated to determine antigen specificities (neoantigens and tumor-associated antigens) of orphan tumor-infiltrating lymphocytes (TILs) in cancer patients. TCRpcDist is thus a promising approach to support TCR repertoire analysis and TCR deorphanization for individualized treatments including cancer immunotherapies.

Keywords: deorphanization; epitope specificity; specificity prediction; t cell receptors (TCRs); tcr clustering; tumor antigens.


Conflict of interest statement

VZ is consultant for Cellestia Biotech. GC has received grants, research support or is coinvestigator in clinical trials by Bristol‐Myers‐Squibb, Celgene, Boehringer Ingelheim, Tigen, Roche, Iovance and Kite. GC has received honoraria for consultations or presentations by Roche, Genentech, BMS, AstraZeneca, Sanofi‐Aventis, Nextcure and GeneosTx. GC has patents in the domain of antibodies and vaccines targeting the tumor vasculature as well as technologies related to T‐cell expansion and engineering for T‐cell therapy. GC receives royalties from the University of Pennsylvania. SB and AH have patents in technologies related to T‐cell expansion and engineering for T‐cell therapy. Other authors declare no competing interests.

Figures

Figure 1
Figure 1
Representative scheme for the clustering pipeline used in TCRpcDist‐3D. The clustering pipeline consists of four main steps. First, all possible sliding windows of 4 residues that constitute the so‐called 4‐mer subunits are identified. The CDR residues that cannot directly contact the peptide, as determined by their solvent accessibility in the structural models, can be excluded from the process. Next, each 4‐mer subunit is converted into a biophysicochemical representation using 5 Atchley factors. For each CDR of a pair of TCRs, all the n 4‐mer motifs that are possible to construct from the first TCR with all the m possible 4‐mer motifs of the second TCR are compared. This results in n × m matrix comparisons for each CDR for each pair of TCRs. The matrix comparisons are performed via a Manhattan distance score normalized over the maximum possible distance. This score ranges from 0, for 4‐mers sharing the same biophysicochemical properties, to 1, for 4‐mers that have the highest difference in biophysicochemical properties. The method was developed using TCR‐pMHC PDB structures before being tested for use with TCR homology models for broader applications. The clustering accuracy is found maximal when a weighting of ≈30% is applied to the subset of amino acids in CDR3α or CDR3β and a weighting of 10% are given to the subset of amino acids in CDR1α, CDR2α, CDR1β, or CDR2β, respectively. The clustering accuracy is better when, together with the weighting factors, only residues sufficiently exposed to the solvent, thus potentially able to contribute to the pMHC binding interface, are part of the 4‐mers.
Figure 2
Figure 2
TCRpcDist clustering TCRs and correlating with their specificity. A) shows hierarchical clustering of a set of 54 TCRs recognizing 16 different pMHC using the Atchley‐based distance considering only sliding windows of 4 consecutive residues of the CDR3β. After clustering, each TCR is colored according to the pMHC it binds. The sequence of the bound peptide is also given; B) quality of the cluster as measured by the number of color changes and the pMHC‐distance, for diverse weightings of the contributions of the various CDRs. The maximal clustering efficiency is highlighted in yellow and obtained when each CDR3s contribute by 30% and each of the remaining CDRs by 10% to the distance calculation; C) shows the hierarchical clustering of a set of 54 TCRs recognizing 16 different pMHC using the Atchley‐based distance considering all 6 TCR CDRs (i.e., CDR1α, CDR2α, CDR3α, CDR1β, CDR2β, and CDR3β). After clustering, each TCR is colored according to the pMHC it binds. The sequence of the bound peptide is also given; D) exploring the best nSESA threshold. The clustering efficiency as measured by the number of color changes and the pMHC‐distance is maximal when residues with nSESA < 5% in CDRs 1 and 2 and residues with nSESA < 20% in CDRs 3 are excluded from the distance calculation; E) shows hierarchical clustering of a set of 54 TCRs recognizing 16 different pMHC using the Atchley‐based distance considering all 6 TCR CDRs (i.e., CDR1α, CDR2α, CDR3α, CDR1β, CDR2β, and CDR3β), as well as residues buriedness calculated on the PDB structures. After clustering, each TCR is colored according to the pMHC it binds. The sequence of the bound peptide is also given; F) illustrates how solvent exposed residues are included in the distance calculation while buried residues are excluded (The TCR structure corresponds to PDB ID 4JRX); G) shows hierarchical clustering of a set of 54 TCRs recognizing 16 different pMHC using the Atchley‐based distance considering all 6 TCR CDRs (i.e., CDR1α, CDR2α, CDR3α, CDR1β, CDR2β, and CDR3β), as well as residues buriedness calculated on 3D models created by our pipeline that models TCRs from sequences. After clustering, each TCR is colored according to the pMHC it binds. The sequence of the bound peptide is also given; H) table shows how often a TCR with the same specificity is found in the top 1, 2, 5 and 10 TCRs with the closest distances using 4 versions of TCRpcDist (using just CDR3β, using all CDRs, using all CDRs + nSESA (residues buriedness) taken from PDB structures and using all CDRs + nSESA (residues buriedness) taken from 3D models constructed by our pipeline to model sequences). Area Under ROC curve (AUC) as a measure of accuracy and respective standard deviation is also presented.
Figure 3
Figure 3
TCRpcDist clustering TCRs and correlating with their specificity using a private set of TCRs with known specificity. A) shows the hierarchical clustering of a test set of 45 TCRs recognizing 12 different pMHC using the Atchley‐based distance considering only sliding windows of 4 consecutive residues of the CDR3β. These TCRs were not used to choose the TCRpcDist parameters. After clustering, each TCR is colored according to the pMHC it binds. The sequence of the bound peptide is also given; B) shows the hierarchical clustering of a set of 45 TCRs recognizing 12 different pMHC using the Atchley‐based distance and considering all 6 TCR CDRs (i.e., CDR1α, CDR2α, CDR3α, CDR1β, CDR2β, and CDR3β). After clustering, each TCR is colored according to the pMHC it binds. The sequence of the bound peptide is also given; C) shows the hierarchical clustering of a set of 45 TCRs recognizing 12 different pMHC using the Atchley‐based distance, considering all 6 TCR CDRs (i.e., CDR1α, CDR2α, CDR3α, CDR1β, CDR2β, and CDR3β) as well as residues buriedness. After clustering, each TCR is colored according to the pMHC it binds. The sequence of the bound peptide is also given; D) table shows how often a TCR with the same specificity is found in the top 1, 2, 5 and 10 TCRs with the closest distances using the 3 versions of TCRpcDist, TCRbase (webserver: https://services.healthtech.dtu.dk/services/TCRbase‐1.0/ ) and TCRdist3[ 14 ] approaches. AUC as a measure of accuracy and respective standard deviation is also presented; E) shows hierarchical clustering of a set of 45 TCRs recognizing 12 different pMHC using TCRdist3.[ 14 ]
Figure 4
Figure 4
ROC curves computed using the TCRpcDist‐3D and TCRdist3[ 9 , 17 ] approaches for 4 independent sets: the private set of 45 TCRs, the set of 84 PDB structures, the 10X Genomics set comprising 1′956 TCRs and the VDJdb2022 comprising 8′128 TCRs covering 337 pMHC bound by a single TCR and 334 pMHC bound by at least two TCRs.
Figure 5
Figure 5
Percentage of success in pairing TCRs with the same specificity at different TCRpcDist‐3D distance thresholds using the 10X Genomics dataset, after removing the overrepresented KLGGALQAK peptide.
Figure 6
Figure 6
Using TCRpcDist‐3D to deorphanize TCRs found in cancer cells of patients Mel#1, Mel#2, Mel#3, Mel#4. A) TCRs orphans tested experimentally. Each dot corresponds to the TCRpcDist‐3D value between the orphan TCR and the closest reference TCR, and the corresponding EF value; B) the hierarchical clustering tree of the TCR orphans tested experimentally and the TCRs with known specificity used as reference; C) validation of peptide‐specificity predicted through TCRpcDist‐3D (round 1 of experiments). Validation of antigen‐specificity for two positive TCRs found by TCRpcDist‐3D screening. TCRalpha‐ and TCRbeta‐coding RNA was transfected into recipient Jurkat cells engineered for human CD8 expression and CRISPR TCRalphabeta‐KO. After over‐night incubation cells were stained with the CMV pp65‐multimer (TPRVTGGGAM, HLA‐B*07). A previously identified pp65‐specific TCR and an irrelevant TCR were used respectively as technical positive (CTRL+) and negative control. An irrelevant EBV B2LF‐1‐multimer (RAKFKQLL, HLA‐B*08) was used to further confirm the specificity of the two predicted TCRs; D) functional characterization of two TCRs predicted through TCRpcDist‐3D in the first round of experiments. The functional avidity of both CMV pp65‐specific TCRs was measured using activated primary T cells. Shown are the normalized relative frequencies of IFNγ‐producing T cells and the EC50 (effect concentration 50%, peptide concentration required for half‐maximal T cell activation) is given for each TCR. Color‐coded corresponding TCR sequences are reported on the right.
Figure 7
Figure 7
3D models superimposition of Mel#6 TCR specific for the neoAg SLKLHYQL/HLA‐B*08:01, in light brown with the orphan Mel#6 TCR with closest TCRpcDist‐3D distance, in light purple. Orphans and closest TCR are described in detail in Table 4. These TCRs exhibit a very small TCRpcDist‐3D distance, 0.02, since they share the same TRAV and TRBV and exhibit the same 4‐mer in CDR3α, YGQN, and nearly the same 4‐mer in CDR3β SLSA versus SLSG. The CDR3s 4‐mer features, highlighted in bold in the table and in sticks in the 3D models, are solvent exposed and able to interact with the peptide.

References

    1. Baulu E., Gardet C., Chuvin N., Depil S., Sci. Adv. 2023, 9, adf3700. - PMC - PubMed
    1. a) Davis M. M., Bjorkman P. J., Nature 1988, 334, 395; - PubMed
    2. b) Garcia K. C., Degano M., Speir J. A., Wilson I. A., Rev. Immunogenet. 1999, 1, 75. - PubMed
    1. Davis M. M., Boyd S. D., Curr. Opin. Immunol. 2019, 59, 109. - PMC - PubMed
    1. a) Borrman T., Cimons J., Cosiano M., Purcaro M., Pierce B. G., Baker B. M., Weng Z., Proteins 2017, 85, 908; - PMC - PubMed
    2. b) Gálvez J., Gálvez J. J., García‐Peñarrubia P., Front. Immunol. 2019, 10, 349; - PMC - PubMed
    3. c) Schmidt J., Chiffelle J., Perez M. A. S., Magnin M., Bobisse S., Arnaud M., Genolet R., Cesbron J., Barras D., Navarro Rodrigo B., Benedetti F., Michel A., Queiroz L., Baumgaertner P., Guillaume P., Hebeisen M., Michielin O., Nguyen‐Ngoc T., Huber F., Irving M., Tissot‐Renaud S., Stevenson B. J., Rusakiewicz S., Dangaj Laniti D., Bassani‐Sternberg M., Rufer N., Gfeller D., Kandalaft L. E., Speiser D. E., Zoete V., et al., Nat. Commun. 2023, 14, 3188. - PMC - PubMed
    1. Chiffelle J., Genolet R., Perez M. A., Coukos G., Zoete V., Harari A., Curr. Opin. Biotechnol. 2020, 65, 284. - PubMed

MeSH terms

Substances