. 2024 Oct;11(39):e2403058.
doi: 10.1002/advs.202403058. Epub 2024 Aug 19.

Ginsenoside Rg3 Restores Mitochondrial Cardiolipin Homeostasis via GRB2 to Prevent Parkinson's Disease

Affiliations

Ginsenoside Rg3 Restores Mitochondrial Cardiolipin Homeostasis via GRB2 to Prevent Parkinson's Disease

Li-Feng-Rong Qi et al. Adv Sci (Weinh). 2024 Oct.

Abstract

Regulating cardiolipin to maintain mitochondrial homeostasis is a promising strategy for addressing Parkinson's disease (PD). Through a comprehensive screening and validation process involving multiple models, ginsenoside Rg3 (Rg3) as a compound capable of enhancing cardiolipin levels is identified. This augmentation in cardiolipin levels fosters mitochondrial homeostasis by bolstering mitochondrial unfolded protein response, promoting mitophagy, and enhancing mitochondrial oxidative phosphorylation. Consequently, this cascade enhances the survival of tyrosine hydroxylase positive (TH+) dopaminergic neurons, leading to an amelioration in motor performance within PD mouse models. Using limited proteolysis-small-molecule mapping combined with molecular docking analysis, it has confirmed Growth Factor Receptor-Bound Protein 2 (GRB2) as a molecular target for Rg3. Furthermore, these investigations reveal that Rg3 facilitates the interaction between GRB2 and TRKA (Neurotrophic Tyrosine Kinase, Receptor, Type 1), thus promotes EVI1 (Ecotropic Virus Integration Site 1 Protein Homolog) phosphorylation by ERK, subsequently increases CRLS1 (Cardiolipin Synthase 1) gene expression and boosts cardiolipin synthesis. The absence of GRB2 or CRLS1 significantly attenuates the beneficial effects of Rg3 on PD symptoms. Finally, Tenofovir Disoproxil Fumarate (TDF) that also promotes the binding between GRB2 and TRKA is further identified. The identified compounds, Rg3 and TDF, exhibit promising potential for the prevention of PD by bolstering cardiolipin expression and reinstating mitochondrial homeostasis.

Keywords: CRLS1; EVI1; GRB2; TRKA; cardiolipin.


Conflict of interest statement

The authors declare no conflict of interest.

Figures
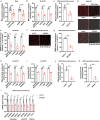
Figure 1
Figure 1
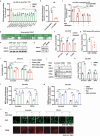
Mitochondrial CL depletion and mitochondrial dysfunction in PD models. a) Mitochondrial CL levels in SN of AAV5‐Vector‐ and AAV5‐A53T‐αSyn‐injected mice, and in SN of saline‐ and MPTP‐treated mice (20 mg kg−1, i.p.) (n = 10 mice per group). SH‐SY5Y cells transfected with pCMV3‐Vector or pCMV3‐A53T‐αSyn‐His for 48 h (b, d, e, h and i). SH‐SY5Y cells were treated with mpp+ (600 µM) or 6‐OHDA (60 µM) for 24 h (b, d, e, h and i). b) Mitochondrial CL levels in SH‐SY5Y cells. Three independent experiments per condition were performed. c) Mitochondrial CL levels in UC017 and SPD501 DA neurons. Five independent experiments per condition were performed. d,e) Mitochondrial membrane potential assessed via TMRM staining in SH‐SY5Y cells. Quantification of mean fluorescence intensity of TMRM is shown. Three independent experiments per condition were performed (scale bar = 50 µm). f,g) Mitochondrial membrane potential assessed via TMRM staining in UC017 and SPD501 DA neurons. Quantification of mean fluorescence intensity of TMRM is shown. Three independent experiments per condition were performed (scale bar = 20 µm). The representative images were obtained from three independent experiments (d and f). h,i) Measurement of mitochondrial cytochrome c oxidase activity (h) and quantification of intracellular ATP concentration (i) in SH‐SY5Y cells. Three independent experiments per condition were performed. j,k) Measurement of mitochondrial cytochrome c oxidase activity (j) and quantification of intracellular ATP concentration (k) in UC017 and SPD501 DA neurons. Three independent experiments per condition were performed. l) mRNA expression of genes related to mitophagy, mitoUPR and Oxphos in UC017 and SPD501 DA neurons. Three independent experiments per condition. Data are normalized to untreated group (e) or UC017 group (g,l). Mean ± standard error of the mean is presented. *p < 0.05, **p < 0.01, ***p < 0.001. Student's two‐tailed unpaired t‐test (a–c, e, g–l). Source data are provided in the Source Data file.
Figure 2
Figure 2
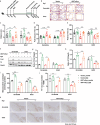
Upregulation of CL for neuroprotection via GRB2. a) A volcano plot illustrates proteins quantified by label‐free mass spectrometry with the potential to bind Rg3. Only proteins identified in two or three replicates, demonstrating with a fold change >5.5 and a p‐value < 0.02, were considered as Rg3‐binding proteins. b) SH‐SY5Y cells were treated with Rg3 (5 µM) or DMSO (0.1%) for 24 h after transfection with indicated siRNAs and pCMV3‐Vector or pCMV3‐A53T‐αSyn‐His for 24 h. Cytotoxicity was assessed using CCK‐8 assay, with five independent experiments per condition. c) Following transfection with Scramble or GRB2 siRNAs for 24 h, SH‐SY5Y cells were treated with Rg3 (5 µM) or DMSO (0.1%) for 24 h. Mitochondrial CL levels were quantified, with three independent experiments per condition. d–f) Soluble protein fraction was heated for denaturation in SH‐SY5Y cells treated with Rg3 (5 µM) or DMSO (0.1%) for 24 h. Representative images of western blotting for GRB2 and GAPDH in soluble protein fraction are shown d). Quantification of GRB2 levels (e) and GAPDH levels (f). g) The binding affinity between Rg3 and GRB2 was determined on a ForteBio Octet system. h) Potential cross‐linking sites for GRB2. The dashed lines represent the distance between amino acid residues and Rg3. Leu‐120, Arg‐67 and Arg‐86 were identified as sites cross‐linked with Rg3 through hydrogen bonds. Data are normalized to Vector_DMSO group (b). Mean ± standard error of the mean is presented. *p < 0.05, **p < 0.01, ***p < 0.001, ****p < 0.0001, ns, not significant. One‐way ANOVA with Tukey's multiple comparisons test (b), two‐way ANOVA with Sidak's multiple comparisons test (c, e, f). Source data are provided in the Source Data file.
Figure 3
Figure 3
Rg3 enhanced the interaction between GRB2 and TRKA in human neural cells. a–c) SH‐SY5Y cells were treated with Rg3 (5 µM) or DMSO (0.1%) for 24 h. Western blotting was performed to assess the expression of TRKA and EGFR in cell lysates immunoprecipitated with an anti‐GRB2 antibody a). Quantification of TRKA levels b) and EGFR levels (c). d) SH‐SY5Y cells were treated with Rg3 (5 µM) or DMSO (0.1%) for 24 h after transfection with Scramble or TRKA siRNAs for 24 h. Quantification of mitochondrial CL in SH‐SY5Y cells. Three independent experiments per condition were performed in (a–d. e) The binding conformation of GRB2 and TRKA is depicted on the left. The binding conformation of GRB2 and TRKA after binding to Rg3 is depicted on the right. f–h) SH‐SY5Y cells were treated with Rg3 (5 µM), GW441756 (10 µM) or DMSO (0.1%) for 6 h. Analysis of higher‐molecular‐mass species containing GRB2 and TRKA was conducted via Native PAGE and immunoblotting, with GAPDH serving as the loading control (f). Representative images of western blotting of p‐TRKA, TRKA and GAPDH in cell lysates (g). Quantification of p‐TRKA levels (h). Three independent experiments per condition were performed in f–h. i–k) Wild‐type or mutant GRB2 was preincubated with Rg3 for 30 min. The binding affinity between TRKA and GRB2 (i), TRKA and GRB2‐Rg3 (j) and TRKA and GRB2 mutant‐Rg3 (k) was determined using a ForteBio Octet system. Three independent experiments per condition were performed in (i–k). Data are normalized to DMSO group (b, c and h). Mean ± standard error of the mean is presented. *p < 0.05, **p < 0.01, ***p < 0.001, ns, not significant. Student's two‐tailed unpaired t‐test (b, c), two‐way ANOVA with Sidak's multiple comparisons test (d), One‐way ANOVA with Tukey's multiple comparisons test (h). Source data are provided in the Source Data file.
Figure 4
Figure 4
Rg3 induced upregulation of CRLS1 expression in human neural cells. a) YFP signals in NL5901 strains treated with Rg3 (10 µM) or DMSO for 12 days. Quantification of YFP fluorescence intensity is shown. Four independent experiments per condition were performed. b) N2 strains cultured for three generations on culture plates with bacteria containing indicated siRNAs. NAO staining evaluated CL levels in N2 strains. Quantification of mean NAO fluorescence intensity is shown. c) YFP signals in NL5901 strains treated with Rg3 (10 µM), CL (100 µg mL−1) or DMSO for 12 days. Quantification of YFP fluorescence intensity is shown. Three independent experiments per condition were performed in (b and c). d) Statistical analysis of genome‐wide differential expression analysis of CRLS1 in the human SN and putamen. e–h) Representative western blot images of of CRLS1 in SH‐SY5Y cells transfected with pCMV3‐Vector or pCMV3‐A53T‐αSyn‐His for 48 h (e) or treated with mpp+ (600 µM) or 6‐OHDA (60 µM) for 24 h (e), and in UC017 and SPD501 DA neurons (g). Quantification of CRLS1 levels f,h). Three independent experiments per condition were performed in (e–h). i) SH‐SY5Y cells were treated with Rg3 (5 µM) or DMSO (0.1%) for 24 h after transfection with either scramble siRNA or CRLS1 siRNA, and either pCMV3‐Vector or pCMV3‐A53T‐αSyn‐His for 24 h. Cytotoxicity was assessed using CCK‐8 assay, with five independent experiments per condition. j,k) Representative western blot images of CRLS1, GRB2, TRKA in SH‐SY5Y cells treated with Rg3 (5 µM) or DMSO (0.1%) for 24 h after transfection with Scramble, GRB2 or TRKA siRNAs for 24 h. Quantification of CRLS1 levels (k). l–o) SH‐SY5Y cells transfected with pCMV3‐A53T‐αSyn‐His, scramble siRNA or CRLS1 siRNA for 24 h were treated with DMSO (0.1%), Rg3 (5 µM) or CL (10 µM) for 24 h. Quantification of mean NAO fluorescence intensity is shown (l). Quantification of mean TMRM fluorescence intensity is shown m). NAO staining for CL in SH‐SY5Y cells (scale bar = 100 µm) (n). TMRM staining was performed to assess mitochondrial membrane potential in SH‐SY5Y cells (scale bar = 50 µm) (o). Three independent experiments per condition were performed in (j–o). The representative images were obtained from three independent experiments (n, o). Data are normalized to Scramble group (b, c), DMSO group (f), UC017 group (h) or Scramble_DMSO group (i, k, l and m). Mean ± standard error of the mean is presented. *p < 0.05, **p < 0.01, ***p < 0.001, ****p < 0.0001, ns, not significant. One‐way ANOVA with Dunnett's multiple comparisons test (a), student's two‐tailed unpaired t‐test (b, f and h), two‐way ANOVA with Sidak's multiple comparisons test (c, i, k, l and m). Source data are provided in the Source Data file.
Figure 5
Figure 5
Rg3‐mediated upregulation of CRLS1 in an EVI1‐dependent manner. a,b) SH‐SY5Y cells were treated with DMSO (0.1%) and Rg3 (5 µM) for 24 h. The cells were stained with antibodies against EVI1 (scale bar = 30 µm). Blue colour represents the nucleus a). Quantification of the mean fluorescence intensity of nuclear EVI1 is shown b). c,d) Nuclear and cytoplasmic protein fraction in SH‐SY5Y cells were treated with DMSO (0.1%), or Rg3 (5 µM) for 24 h after transfection with Scramble, GRB2 or TRKA siRNAs for 24 h. Representative western blot images of EVI1 in nuclear fraction and GRB2 and TRKA in cytoplasmic fraction are shown (c). Quantification of EVI1 levels (d). e–h) SH‐SY5Y cells were treated with DMSO (0.1%), or Rg3 (5 µM) for 24 h after transfection with Scramble or EVI1 siRNAs for 24 h. Representative western blot images of EVI1 in nuclear fraction and CRLS1 in cytoplasmic fraction are shown (e). Quantification of EVI1 levels (f) and CRLS1 levels (g). Quantification of mitochondrial CL in SH‐SY5Y cells (h). Three independent experiments per condition were performed in (a–h). The representative images were obtained from three independent experiments (a). i) Diagram of a putative EVI1‐binding site, a pair of EVI1‐binding site primers and a pair of HNF1A‐binding site primers in the CRLS1 promoter. j) The EVI1‐binding motif within the fragment of the CRLS1 promoter was verified via EMSA. k,l) ChIP assay revealed the enrichment of the CRLS1 promoter in DNA isolated from SH‐SY5Y cells treated with Rg3 (5 µM) and anti‐EVI1 antibodies. m–o) Following a 24 h transfection with either Scramble or EVI1 siRNAs, SH‐SY5Y cells were transfected with pcDNA3.1(+)‐EVI1 or pcDNA3.1(+)‐S728A‐EVI1 and treated with DMSO (0.1%) or Rg3 (5 µM) for 24 h. Representative western blot images of EVI1 in nuclear fraction and CRLS1 in cytoplasmic fraction are shown (m). Quantification of EVI1 levels (n) and CRLS1 levels (o). Three independent experiments per condition were performed in (j–o). Data are normalized to those of the DMSO group (b, l, n and o) or the Scramble_DMSO group (d, f, g and h). Mean ± standard error of the mean is presented. *p < 0.05, **p < 0.01, ***p < 0.001, ****p < 0.0001, ns, not significant. Student's two‐tailed unpaired t‐test (b, l), two‐way ANOVA with Sidak's multiple comparisons test (d, f, g, h, k, n and o). Source data are provided in the Source Data file.
Figure 6
Figure 6
Rg3 alleviated A53T‐αSyn‐induced motor function deficits through Grb2 and Crls1. a) In vivo experimental scheme for assessing the therapeutic effects of Rg3. The brains and SN of mice were dissected for further analysis. b) Movement track in the open field test. c) Total distance travelled in the open field. d) Time required to descend the pole. e) Time taken to fall off the rotarod. (n = 10 mice per group in (b–e). f–h) Representative western blot images of Crls‐1, Th and Gapdh in SN (f). Quantification of Crls‐1 levels (g). Quantification of Th levels (h). i) Mitochondrial CL levels in the SN of mice. Three independent experiments were performed in (f–i). j) Quantification of TH+ neurons. k) Immunohistochemical staining of TH+ neurons (scale bar = 100 µm; n = 3 mice per group in (j, k). Data are normalized to Vector_cmcNa group (g,h). Mean ± standard error of the mean is presented. *p < 0.05, **p < 0.01, ***p < 0.001, ****p < 0.0001, ns, not significant. Two‐way ANOVA with Sidak's multiple comparisons test (c–e, g–j). Source data are provided in the Source Data file.
Figure 7
Figure 7
Synergistic efficacy of Rg3 and L‐DOPA in alleviating A53T‐αSyn‐Induced motor function deficits. a) In vivo experimental scheme for investigating the therapeutic effects of Rg3 (20 mg kg−1) and L‐DOPA (20 mg kg−1). The brain and SN of mice were dissected for further analysis. b) Movement track in the open field test. c) Total distance travelled in the open field test. d) Descent time in the pole test. e) Time‐to‐fall in the rotarod test (n = 10 mice per group in (b–e). f) Immunohistochemical staining of TH+ neurons (scale bar = 100 µm). g) Quantification of TH+ neurons (n = 3 mice per group in (f and g). Mean ± standard error of the mean is presented. *p < 0.05, **p < 0.01, ***p < 0.001, ****p < 0.0001. One‐way ANOVA with Tukey's multiple comparisons test (c–e, g). Source data are provided as a Source Data file.
Figure 8
Figure 8
TDF targeting the TRKA‐GRB2‐CRLS1 axis enhanced CL expression and alleviated symptoms of PD. a) Experimental scheme for SPR technology to screen compounds binding to GRB2. b–d) SH‐SY5Y cells were stimulated with TDF (10 µM) or DMSO (0.1%) for 24 h. Western blotting was performed to evaluate the expression of TRKA and EGFR in cell lysates immunoprecipitated with an anti‐GRB2 antibody (b). Quantification of TRKA levels (c) and EGFR levels (d). e,f) Representative western blot images of CRLS1, GRB2, TRKA in SH‐SY5Y cells treated with TDF (10 µM) or DMSO (0.1%) for 24 h after transfection with Scramble, GRB2 or TRKA siRNAs for 24 h. Quantification of CRLS1 levels (f). g) SH‐SY5Y cells were treated with TDF (10 µM) or DMSO (0.1%) for 24 h after transfection with Scramble, GRB2 or TRKA siRNAs for 24 h. Quantification of mitochondrial CL in SH‐SY5Y cells. Three independent experiments per condition were performed in (b–g). h) Movement track in the open field test. i) Total distance travelled in the open field. j) Time required to descend the pole. k) Time required to fall off the rotarod. (n = 10 mice per group in (h–k). l) Immunohistochemical staining of TH+ neurons (scale bar = 100 µm). m) Quantification of TH+ neurons. (n = 3 mice per group in l, m). Data are normalised to those of the DMSO group (c,d) and the Scramble_DMSO group (f). Mean ± standard error of the mean is presented. *p < 0.05, **p < 0.01, ***p < 0.001, ****p < 0.0001, ns, not significant. Student's two‐tailed unpaired t‐test (c,d), two‐way ANOVA with Sidak's multiple comparisons test (f,g,i,j,k and m). Source data are provided in the Source Data file.
Figure 9
Figure 9
Schematic diagram of the mechanism through which Rg3 and TDF triggers the binding of GRB2 to TRKA and promotes ERK activation, resulting in EVI1 transactivation, CRLS1 expression and CL biosynthesis.

References

    1. Kalia L. V., Lang A. E., The Lancet 2015, 386, 896. - PubMed
    1. a) Kim S., Wong Y. C., Gao F., Krainc D., Nat. Commun. 2021, 12, 1807; - PMC - PubMed
    2. b) Senyilmaz D., Virtue S., Xu X., Tan C. Y., Griffin J. L., Miller A. K., Vidal‐Puig A., Teleman A. A., Nature 2015, 525, 124; - PMC - PubMed
    3. c) Mor D. E., Sohrabi S., Kaletsky R., Keyes W., Tartici A., Kalia V., Miller G. W., Murphy C. T., Proc. Natl. Acad. Sci. USA 2020, 117, 26438. - PMC - PubMed
    1. a) Choi M. L., Chappard A., Singh B. P., Maclachlan C., Rodrigues M., Fedotova E. I., Berezhnov A. V., De S., Peddie C. J., Athauda D., Virdi G. S., Zhang W., Evans J. R., Wernick A. I., Zanjani Z. S., Angelova P. R., Esteras N., Vinokurov A. Y., Morris K., Jeacock K., Tosatto L., Little D., Gissen P., Clarke D. J., Kunath T., Collinson L., Klenerman D., Abramov A. Y., Horrocks M. H., Gandhi S., Nat. Neurosci. 2022, 25, 1134; - PMC - PubMed
    2. b) Di Maio R., Barrett P. J., Hoffman E. K., Barrett C. W., Zharikov A., Borah A., Hu X., McCoy J., Chu C. T., Burton E. A., Hastings T. G., Greenamyre J. T., Sci. Transl. Med. 2016, 8, 342ra78; - PMC - PubMed
    3. c) Tanudjojo B., Shaikh S. S., Fenyi A., Bousset L., Agarwal D., Marsh J., Zois C., Heman‐Ackah S., Fischer R., Sims D., Melki R., Tofaris G. K., Nat. Commun. 2021, 12, 3817. - PMC - PubMed
    1. a) Imberechts D., Kinnart I., Wauters F., Terbeek J., Manders L., Wierda K., Eggermont K., Madeiro R. F., Sue C., Verfaillie C., Vandenberghe W., Brain : J. Neurol. 2022, 145, 4368; - PMC - PubMed
    2. b) Ge P., Dawson V. L., Dawson T. M., Mol. Neurodegener. 2020, 15, 20. - PMC - PubMed
    1. a) Schildknecht S., Di Monte D. A., Pape R., Tieu K., Leist M., Trends Pharmacol. Sci. 2017, 38, 541; - PubMed
    2. b) Tanner C. M., Kamel F., Ross G. W., Hoppin J. A., Goldman S. M., Korell M., Marras C., Bhudhikanok G. S., Kasten M., Chade A. R., Comyns K., Richards M. B., Meng C., Priestley B., Fernandez H. H., Cambi F., Umbach D. M., Blair A., Sandler D. P., Langston J. W., Environ. Health Perspect. 2011, 119, 866. - PMC - PubMed

LinkOut - more resources